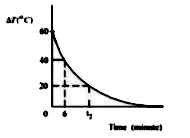
In an experiment to verify Newton's law of cooling, a graph is plotted between the temperature difference (ΔT) of the water and surroundings and time as shown in figure. The initial temperature of water is taken as 80∘ C. The value of t2 mentioned in the graph will be_______

ΔT=Twater−Tsourrounding=T−Ts
At t =0, ΔT=60 and t=80∘ C
80−Ts=60,∴Ts=20∘ C
Newton law of cooling
−Tf−TiΔt=kTi+Tfi2−Ts
between 0 to 6 minute.
20t2−6=k[(40+202+20)−20]
After dividing by t2=16 min.
Topper's Solved these Questions
- BOOK - JEE MAINS PREVIOUS YEARCHAPTER - JEE MAINS 2022EXERCISE - PHYSICS (SECTION -A)20videos
JEE MAINS 2022
- BOOK - JEE MAINS PREVIOUS YEARCHAPTER - JEE MAINS 2022EXERCISE - PHYSICS (SECTION -B)10videos
JEE MAINS 2022
- BOOK - JEE MAINS PREVIOUS YEARCHAPTER - JEE MAINS 2022EXERCISE - PHYSICS60videos
JEE MAINS 2022
- BOOK - JEE MAINS PREVIOUS YEARCHAPTER - JEE MAINS 2021EXERCISE - Physics (Section B )10videos
JEE MAINS 2021
- BOOK - JEE MAINS PREVIOUS YEARCHAPTER - JEE MAINS 2023 JAN ACTUAL PAPEREXERCISE - Question360videos
JEE MAINS 2023 JAN ACTUAL PAPER
Similar Questions
Knowledge Check
- Question 1 - Select One
Newton’s law of cooling, holds good only if the temperature difference between the body and the surroundings is
ALess than 10∘CBMore than 10∘CCLess than 100∘CDMore than 100∘C - Question 2 - Select One
Newton's law of cooling holds good provided the temperature difference between the body and the surroundings is .
AlargeBsmallCvery largeDany value - Question 3 - Select One
In Newton's law of cooling experiment, we plot a graph of (dθdt) against the temperature difference (θ−θ0). The graph is
Aa curve passing through the originBa straight line passing through the originCa straight line having an intercept on the y axisDa straight line having an intercept on the temperature axis
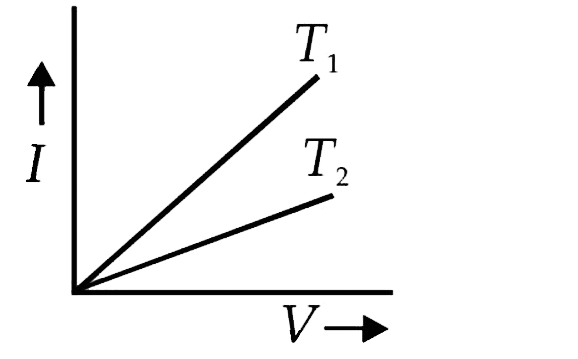
I-V graph for a metallie wire at two different tempearture, T1andT2 is as shown in the figure. Which of the two temperatures is lower and why ?
 View Solution
The current voltage graphs for a given metalic wire two different temperature T1 and T2 are shown in figure The temperature T2 is greater than T1. Is this statement true or false?
 View Solution
The correct graph between the temperature of a hot body kept in cooler surrounding and time is (Assume newton's law of cooling)
View SolutionAccording to Newton's law of cooling, the rate of cooling of a body is proportional to (Δθ)n, where Δθ is the difference of the temperature of the body and the surroundings, and n is equal to
View SolutionAccording to Newton's law of cooling, the rate of cooling of a body in air is proportional to the difference between the temperature of the body and the temperature of the surrounding air. If the air temperature is 20∘C and the body cools for 20 minutes from 140∘C→80∘C, then the temperature will be 50∘C in
View Solution

