Shown below are the black body radiation curves at temperature T1 and T2(T2>T1). Which of the following plots is correct?
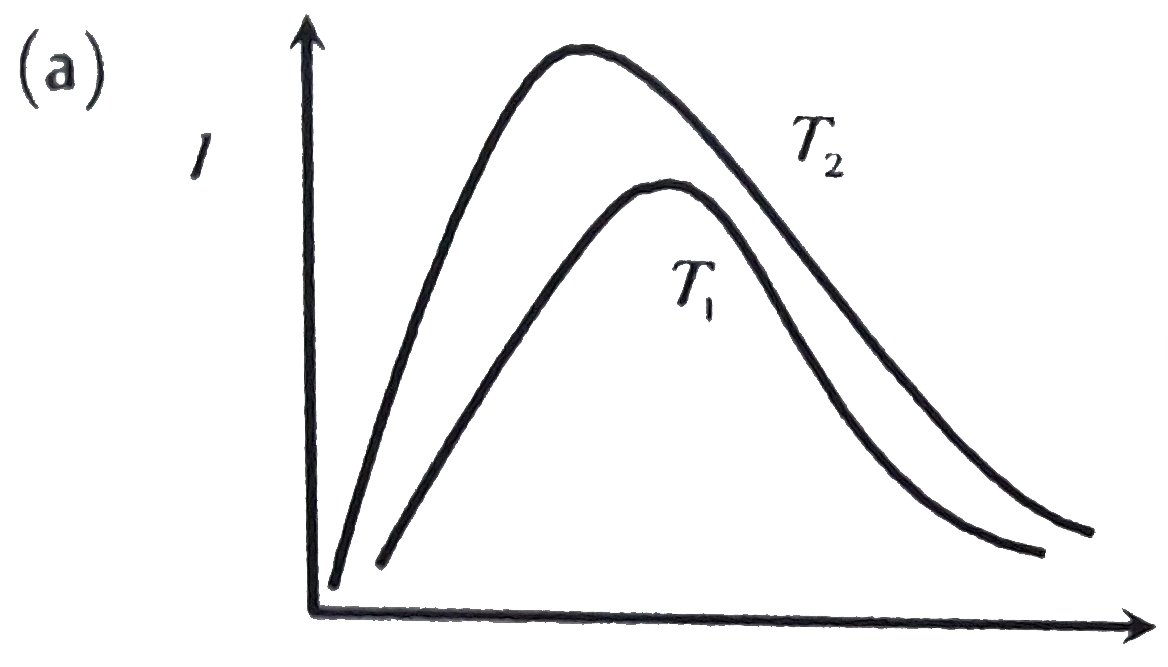
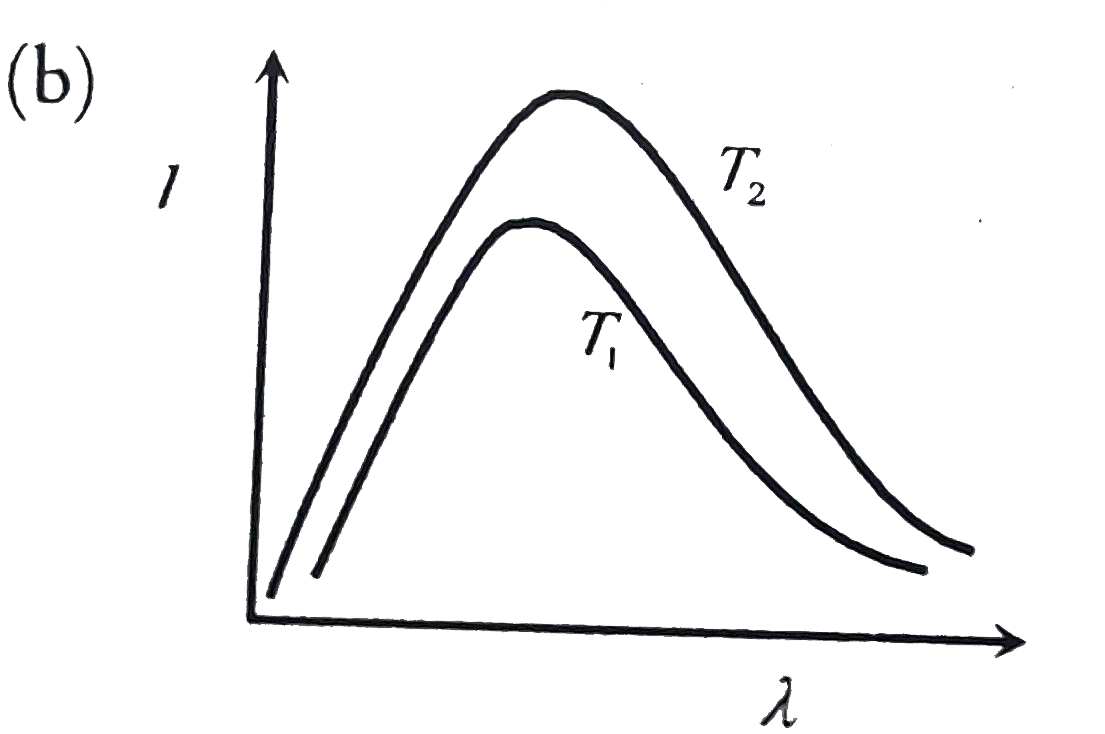
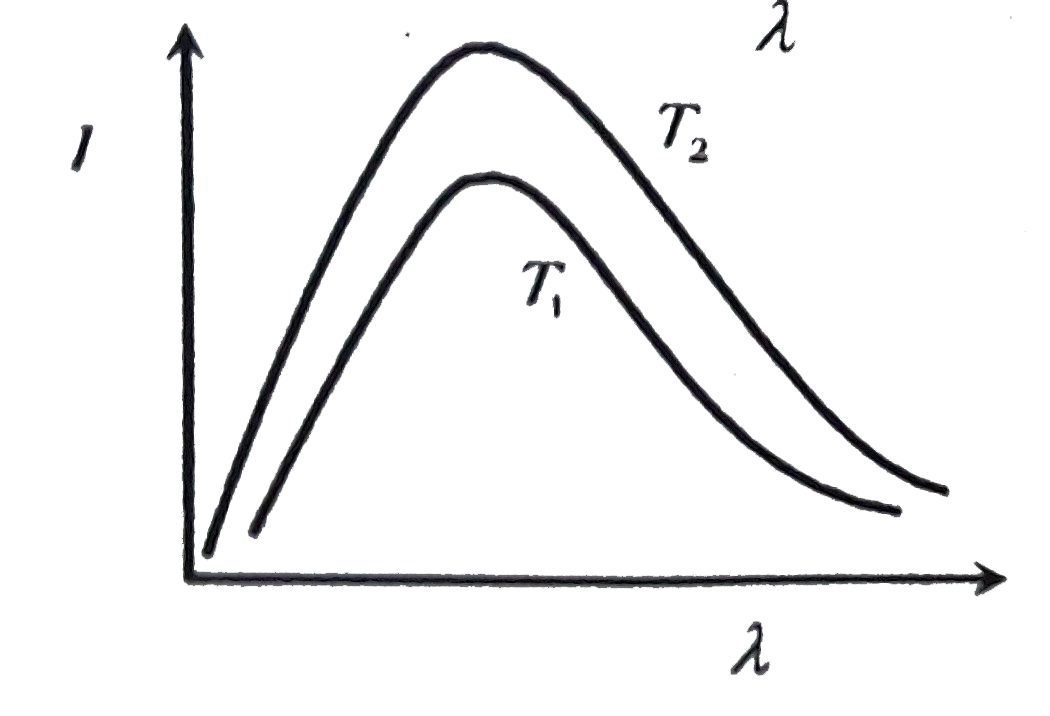

The correct Answer is:A
Step by step video, text & image solution for Shown below are the black body radiation curves at temperature T_(1) and T_(2) (T_(2) gt T_(1)). Which of the following plots is correct? by Physics experts to help you in doubts & scoring excellent marks in Class 11 exams.
Updated on:21/07/2023Topper's Solved these Questions
- TRANSMISSION OF HEATBOOK - ERRORLESS CHAPTER - TRANSMISSION OF HEATEXERCISE - Assertion & Reason
24 Videos
- TRANSMISSION OF HEATBOOK - ERRORLESS CHAPTER - TRANSMISSION OF HEATEXERCISE - ET Self Evaluation Test
23 Videos
- TRANSMISSION OF HEATBOOK - ERRORLESS CHAPTER - TRANSMISSION OF HEATEXERCISE - Critical Thinking
36 Videos
- THERMOMETRY, THERMAL EXPANSION AND CALORIMETRY BOOK - ERRORLESS CHAPTER - THERMOMETRY, THERMAL EXPANSION AND CALORIMETRY EXERCISE - Self Evaluation Test
15 Videos
- UNITS, DIMENSION & MEASUREMENTSBOOK - ERRORLESS CHAPTER - UNITS, DIMENSION & MEASUREMENTSEXERCISE - All Questions
333 Videos
Similar Questions
Knowledge Check
Show below are the black body radiation curves at temperature T1 and T2(T2>T1). Which of the following plots is correct?
A B
B C
C D
D
A black body radiates heat at temperatures T1 and T2(T2>T1 the frequency corresponding to maxium energy is
Amore atT1Bmore at T2Cequal for T1 and T2Dindependent of T1 and T2A black body radiates heat at temperatures T1 and T2(T2>T1 the frequency corresponding to maxium energy is
Amore atT1Bmore at T2Cequal for T1 and T2Dindependent of T1 and T2
Select the graph that correctly describes the adsorption isotherms at two temperatures T1 and T2(T1>T2) for a gas : (x — mass of the gas adsorbed m-mass of adsorbent P - pressure)
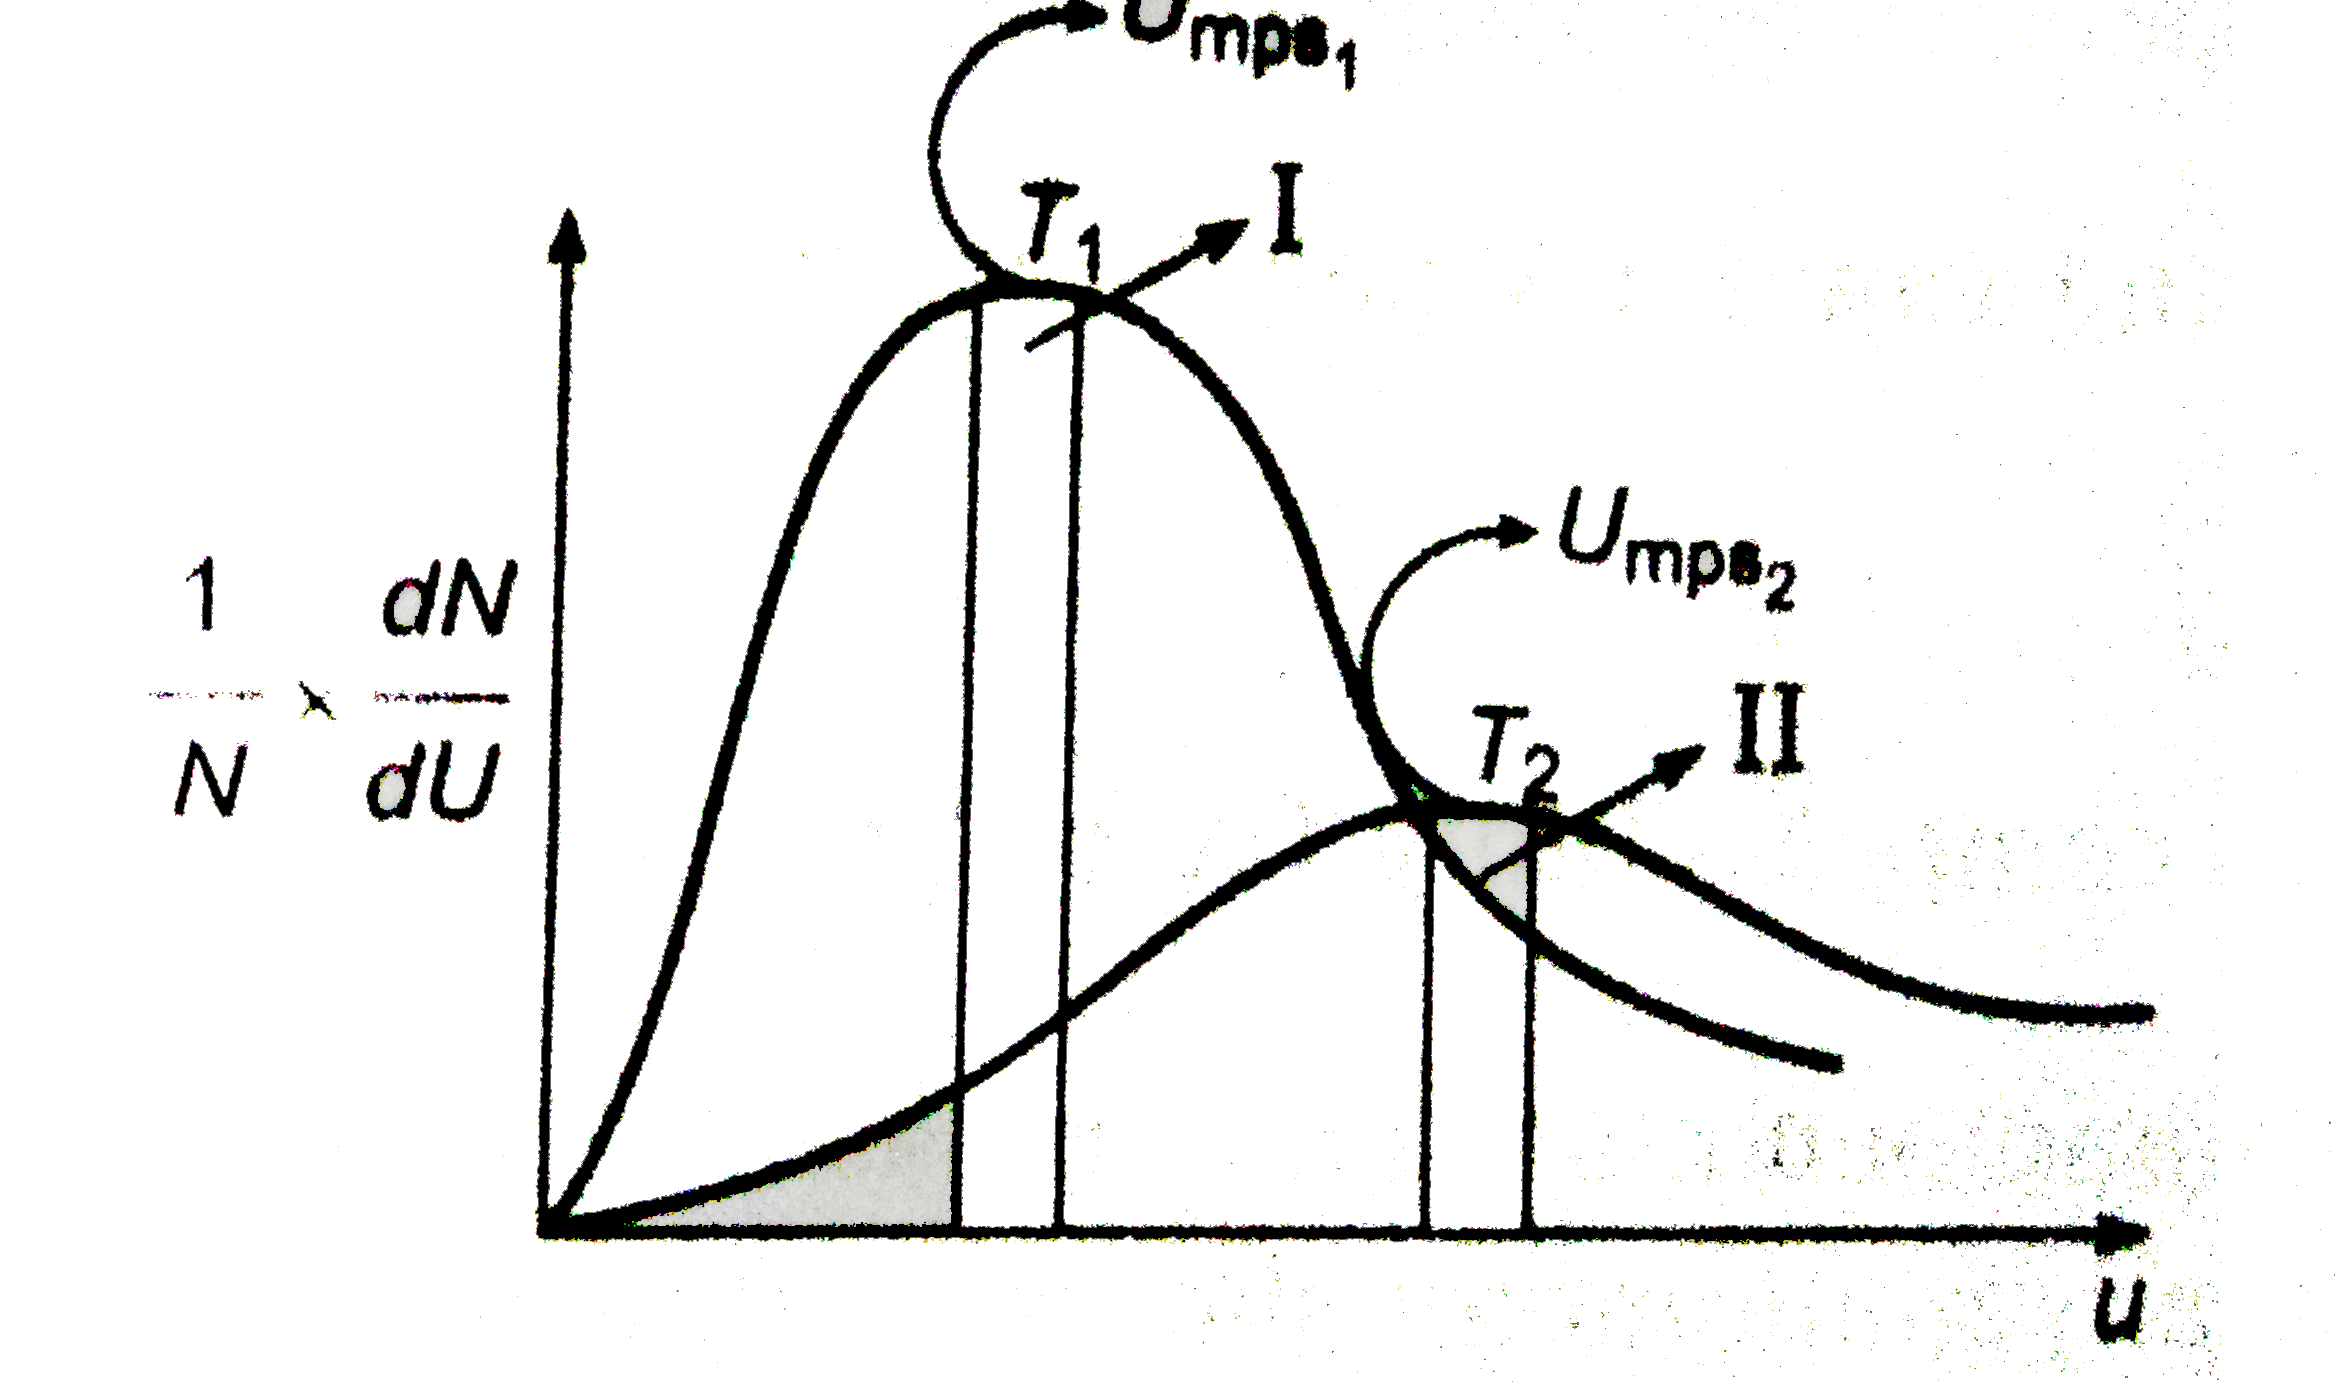
View SolutionFollowing represents the Maxwell distribution curve for an ideal gas at two temperature T1 and T2 . Which of the following option(s) is/are true?
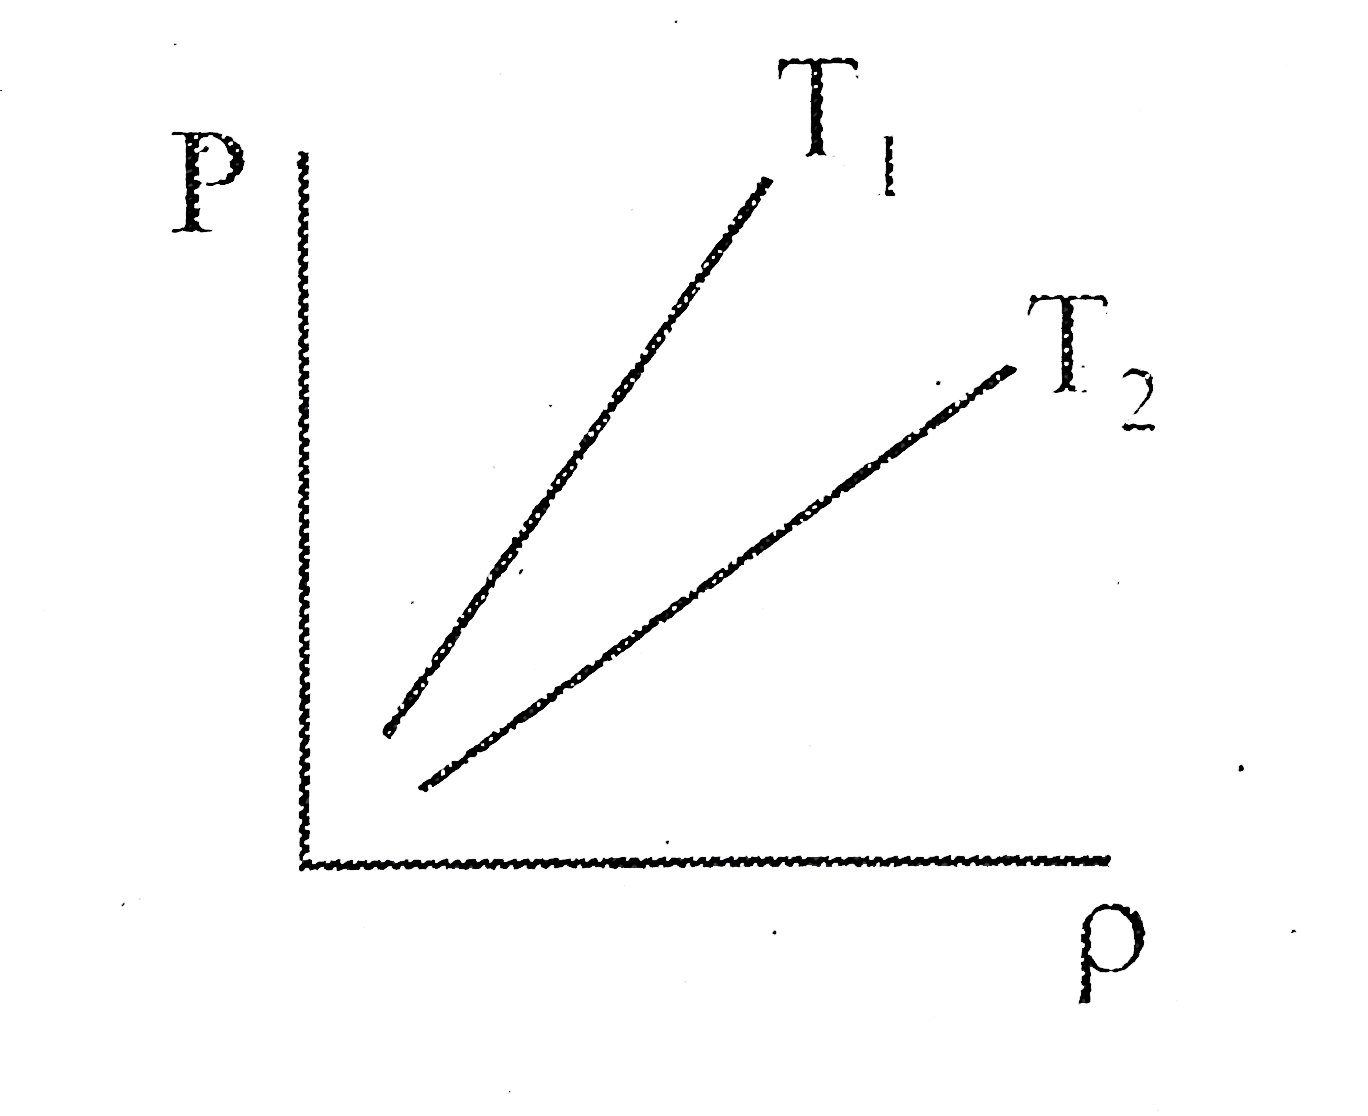
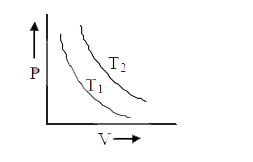
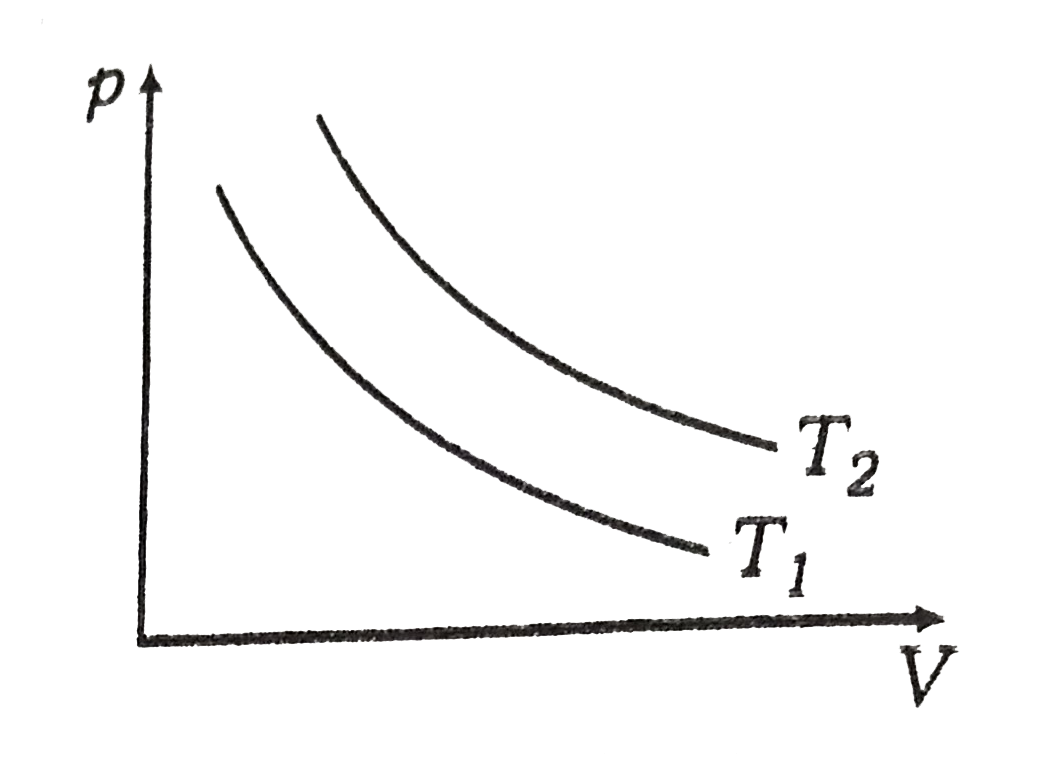
View SolutionThe adjoining fgure shows graph of pressure and volume of a gas at two temperatures T1 and T2 Which one the following is correct
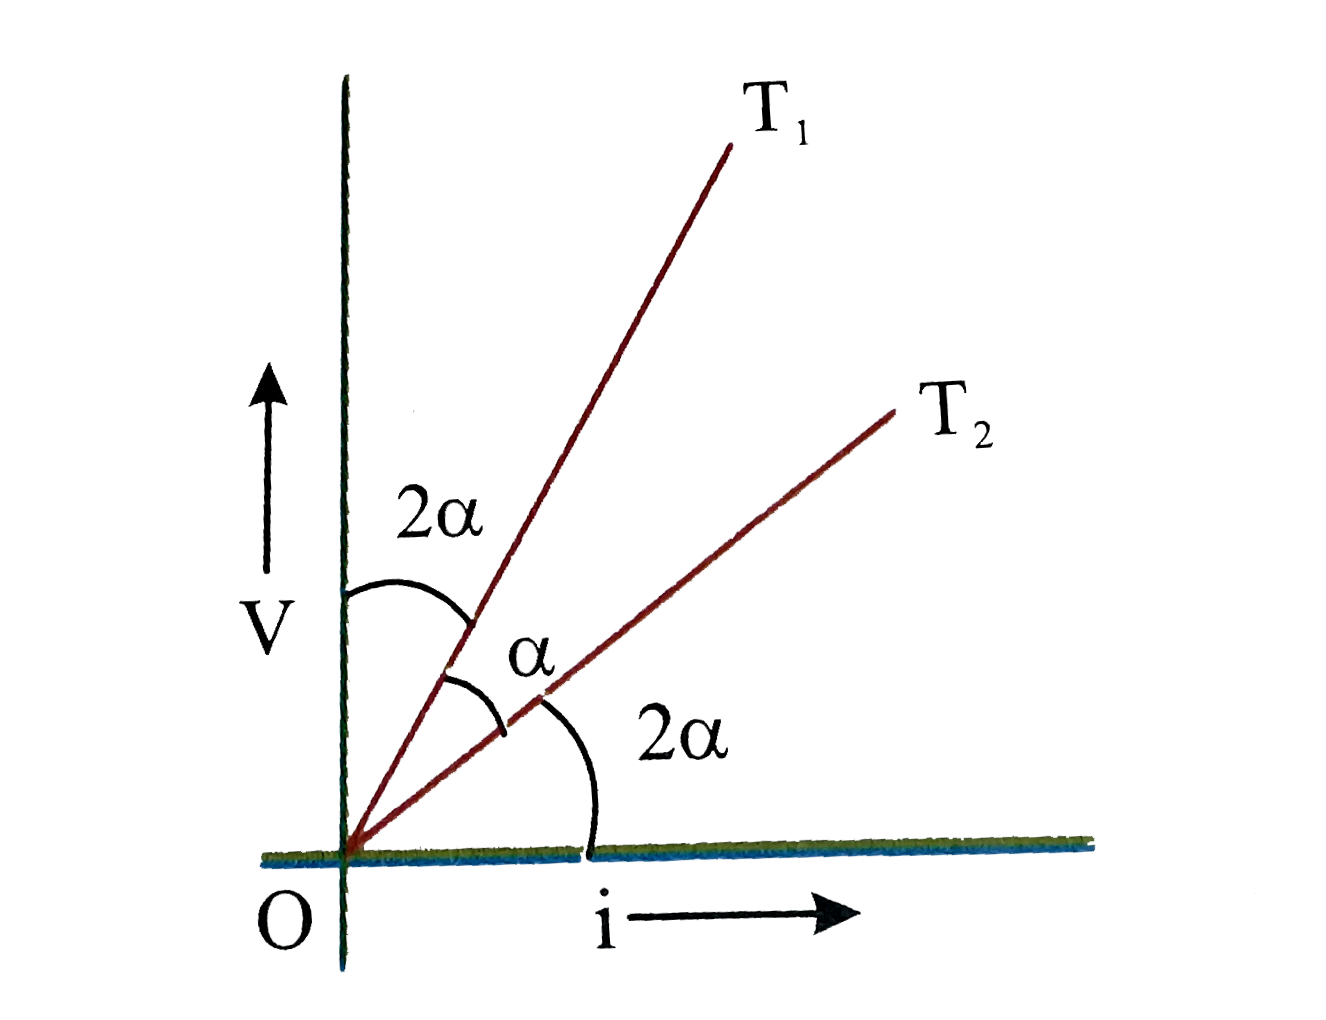
View SolutionThe figure shows the variation of V with i at temperatures T1 and T2. Then T1−T2 is proportional to
View SolutionThe rate at which a black body emits radiation at a temperature T is proportional to
View Solution

