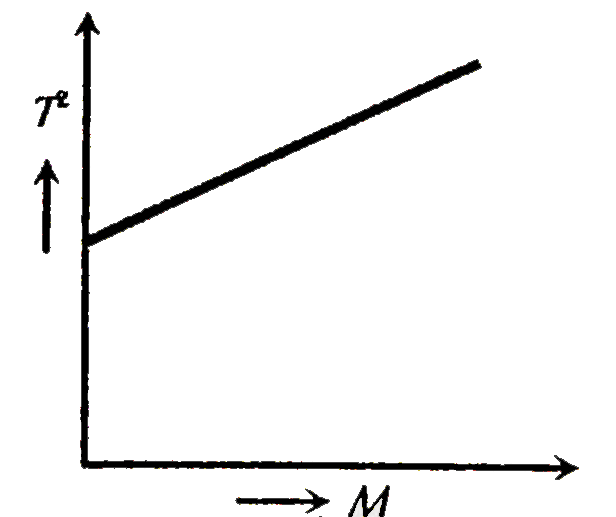
The graph shown was obtained from experimental measurements of the period of oscillations T for different masses M placed in the scale pan on the lower end of the spring balance. The most likely reason for the line not passing through the origin is that the
Stopclock was not regulated
Spring did not obey Hook's law
Mass of the pan was not taken into account
Amplitude of the oscillations was too large
The correct Answer is:C
For the oscillating mass, T=2π√MK
∴T2=4π2MK∴T2∝M
∴ The graph of T2 against M is a straight line and if M=0,T2=0 and it should pass through the origin. But it is not pas"sin"g through the origin. This means that M≠0 or the mass of the pan was not taken into account.
Topper's Solved these Questions
Similar Questions
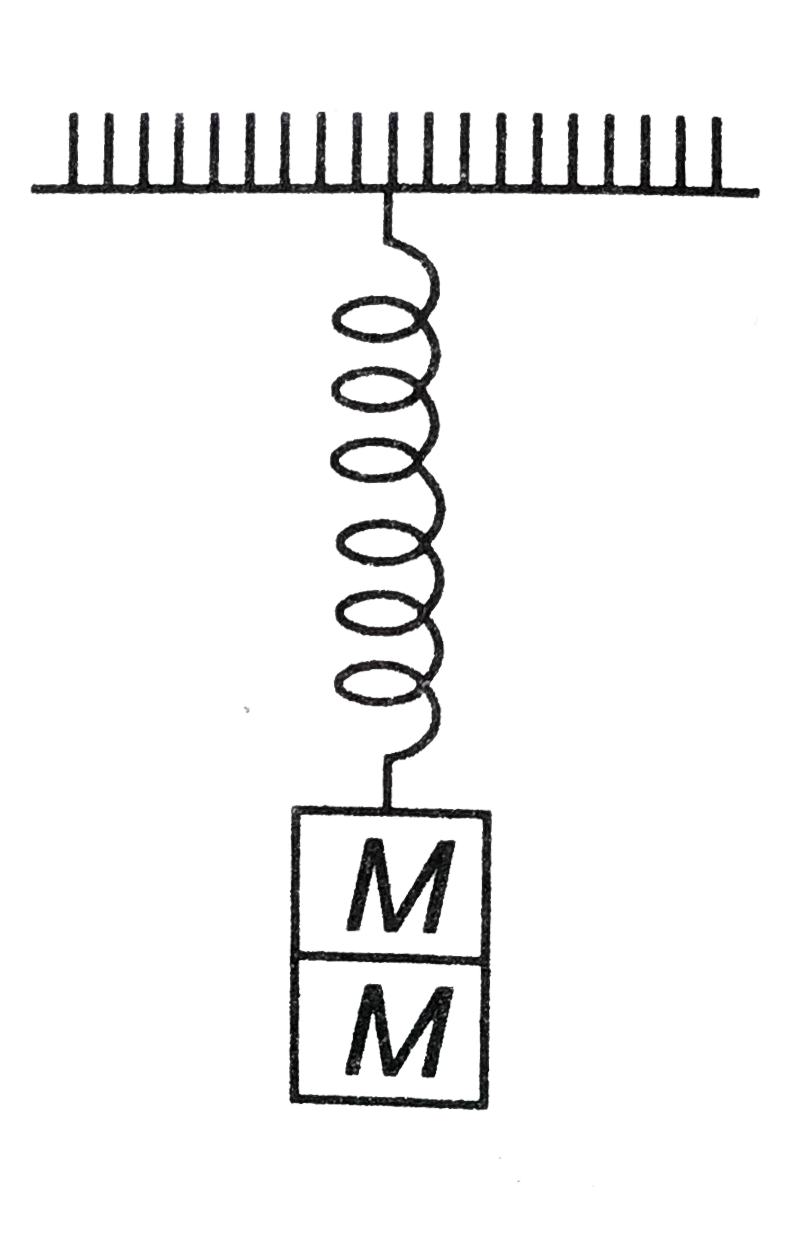
The period of oscillation of a mass M suspended from a spring of spring constant K is T. the time period of oscillation of combined blocks is
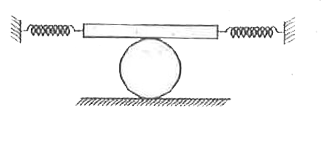
View SolutionIn the figure shown, mass of the plank is m and that of the solid cylinder is 8m. Springs are light. The plank is slightly displaced from equilibrium and then released. Find the period of small oscillations (in seconds) of the plank. There is no slipping at any contact point. The ratio of the mass of the plank adn stiffness of the spring i.e., mK=2π2
View Solution
Knowledge Check
The graph between period of oscillation (T) and mass attached (m) to a spring will be
A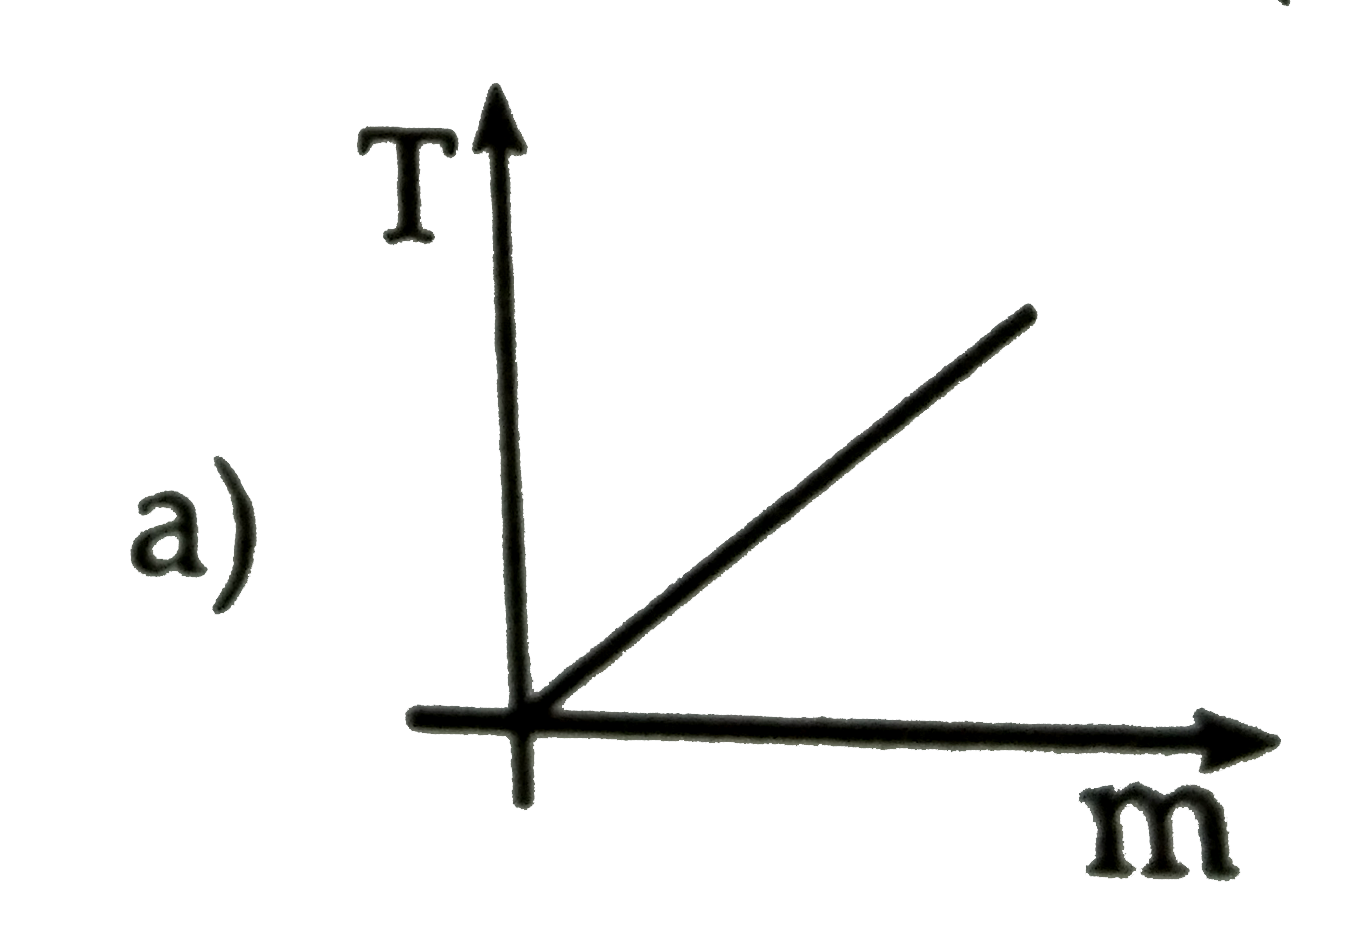 B
B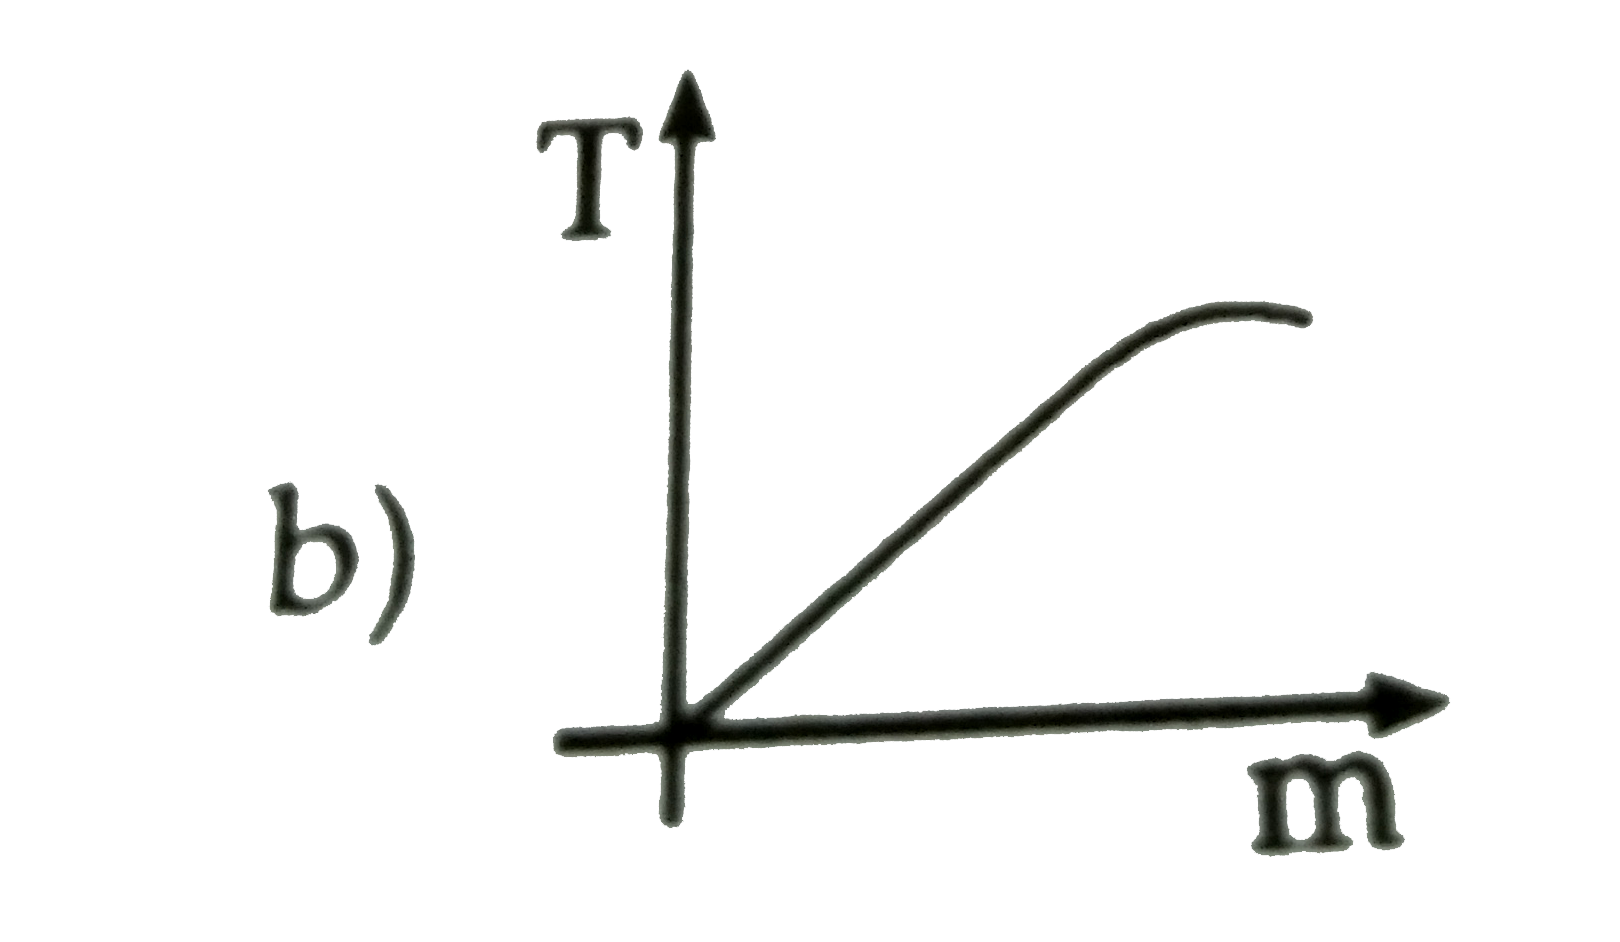 C
C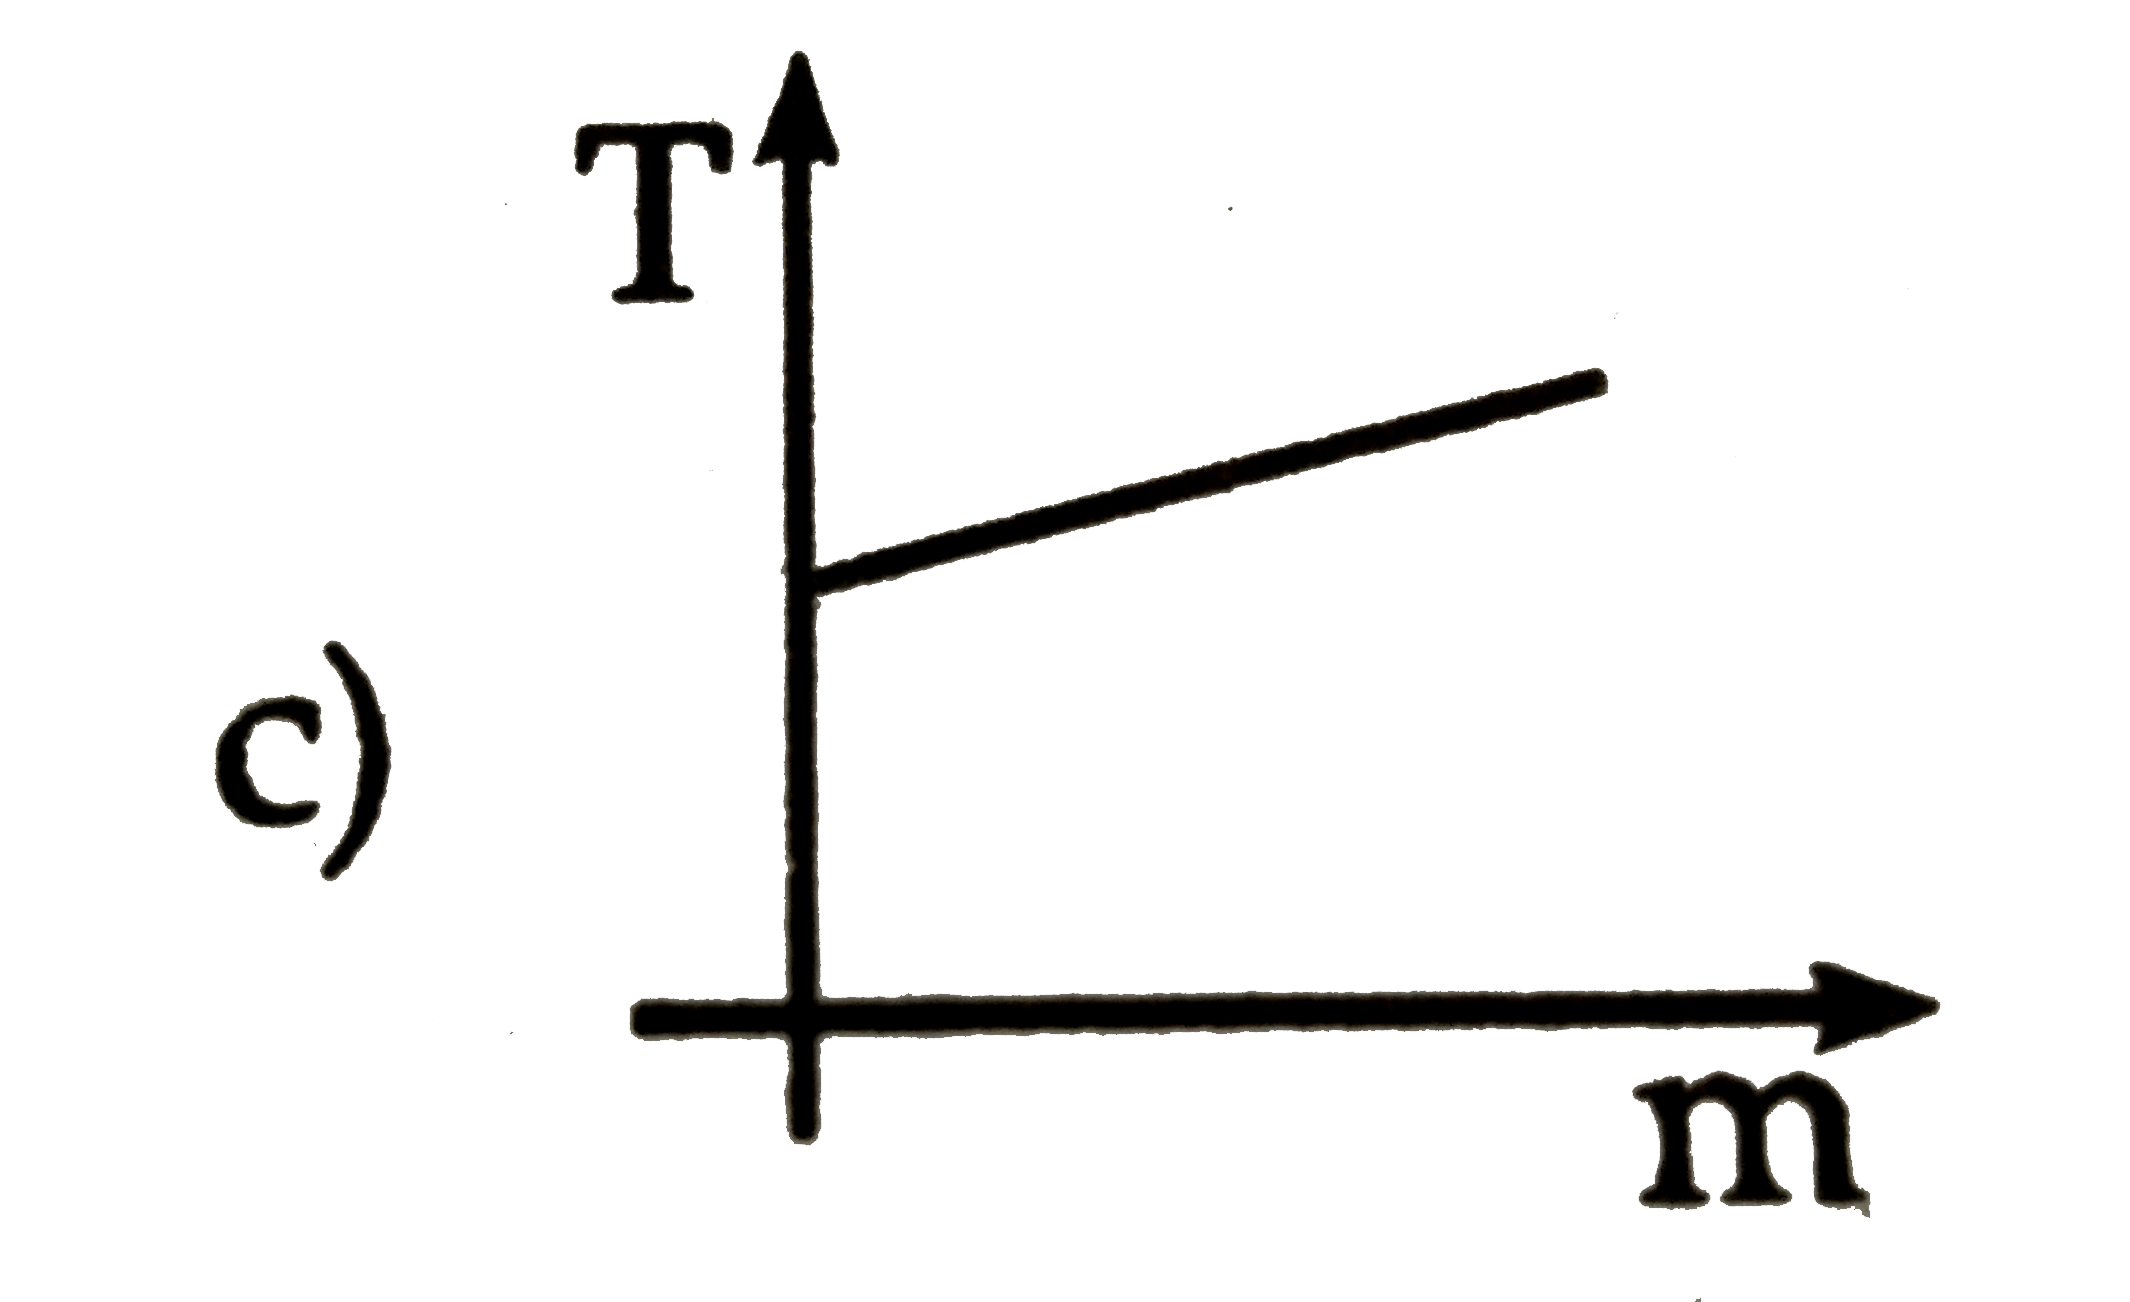 D
D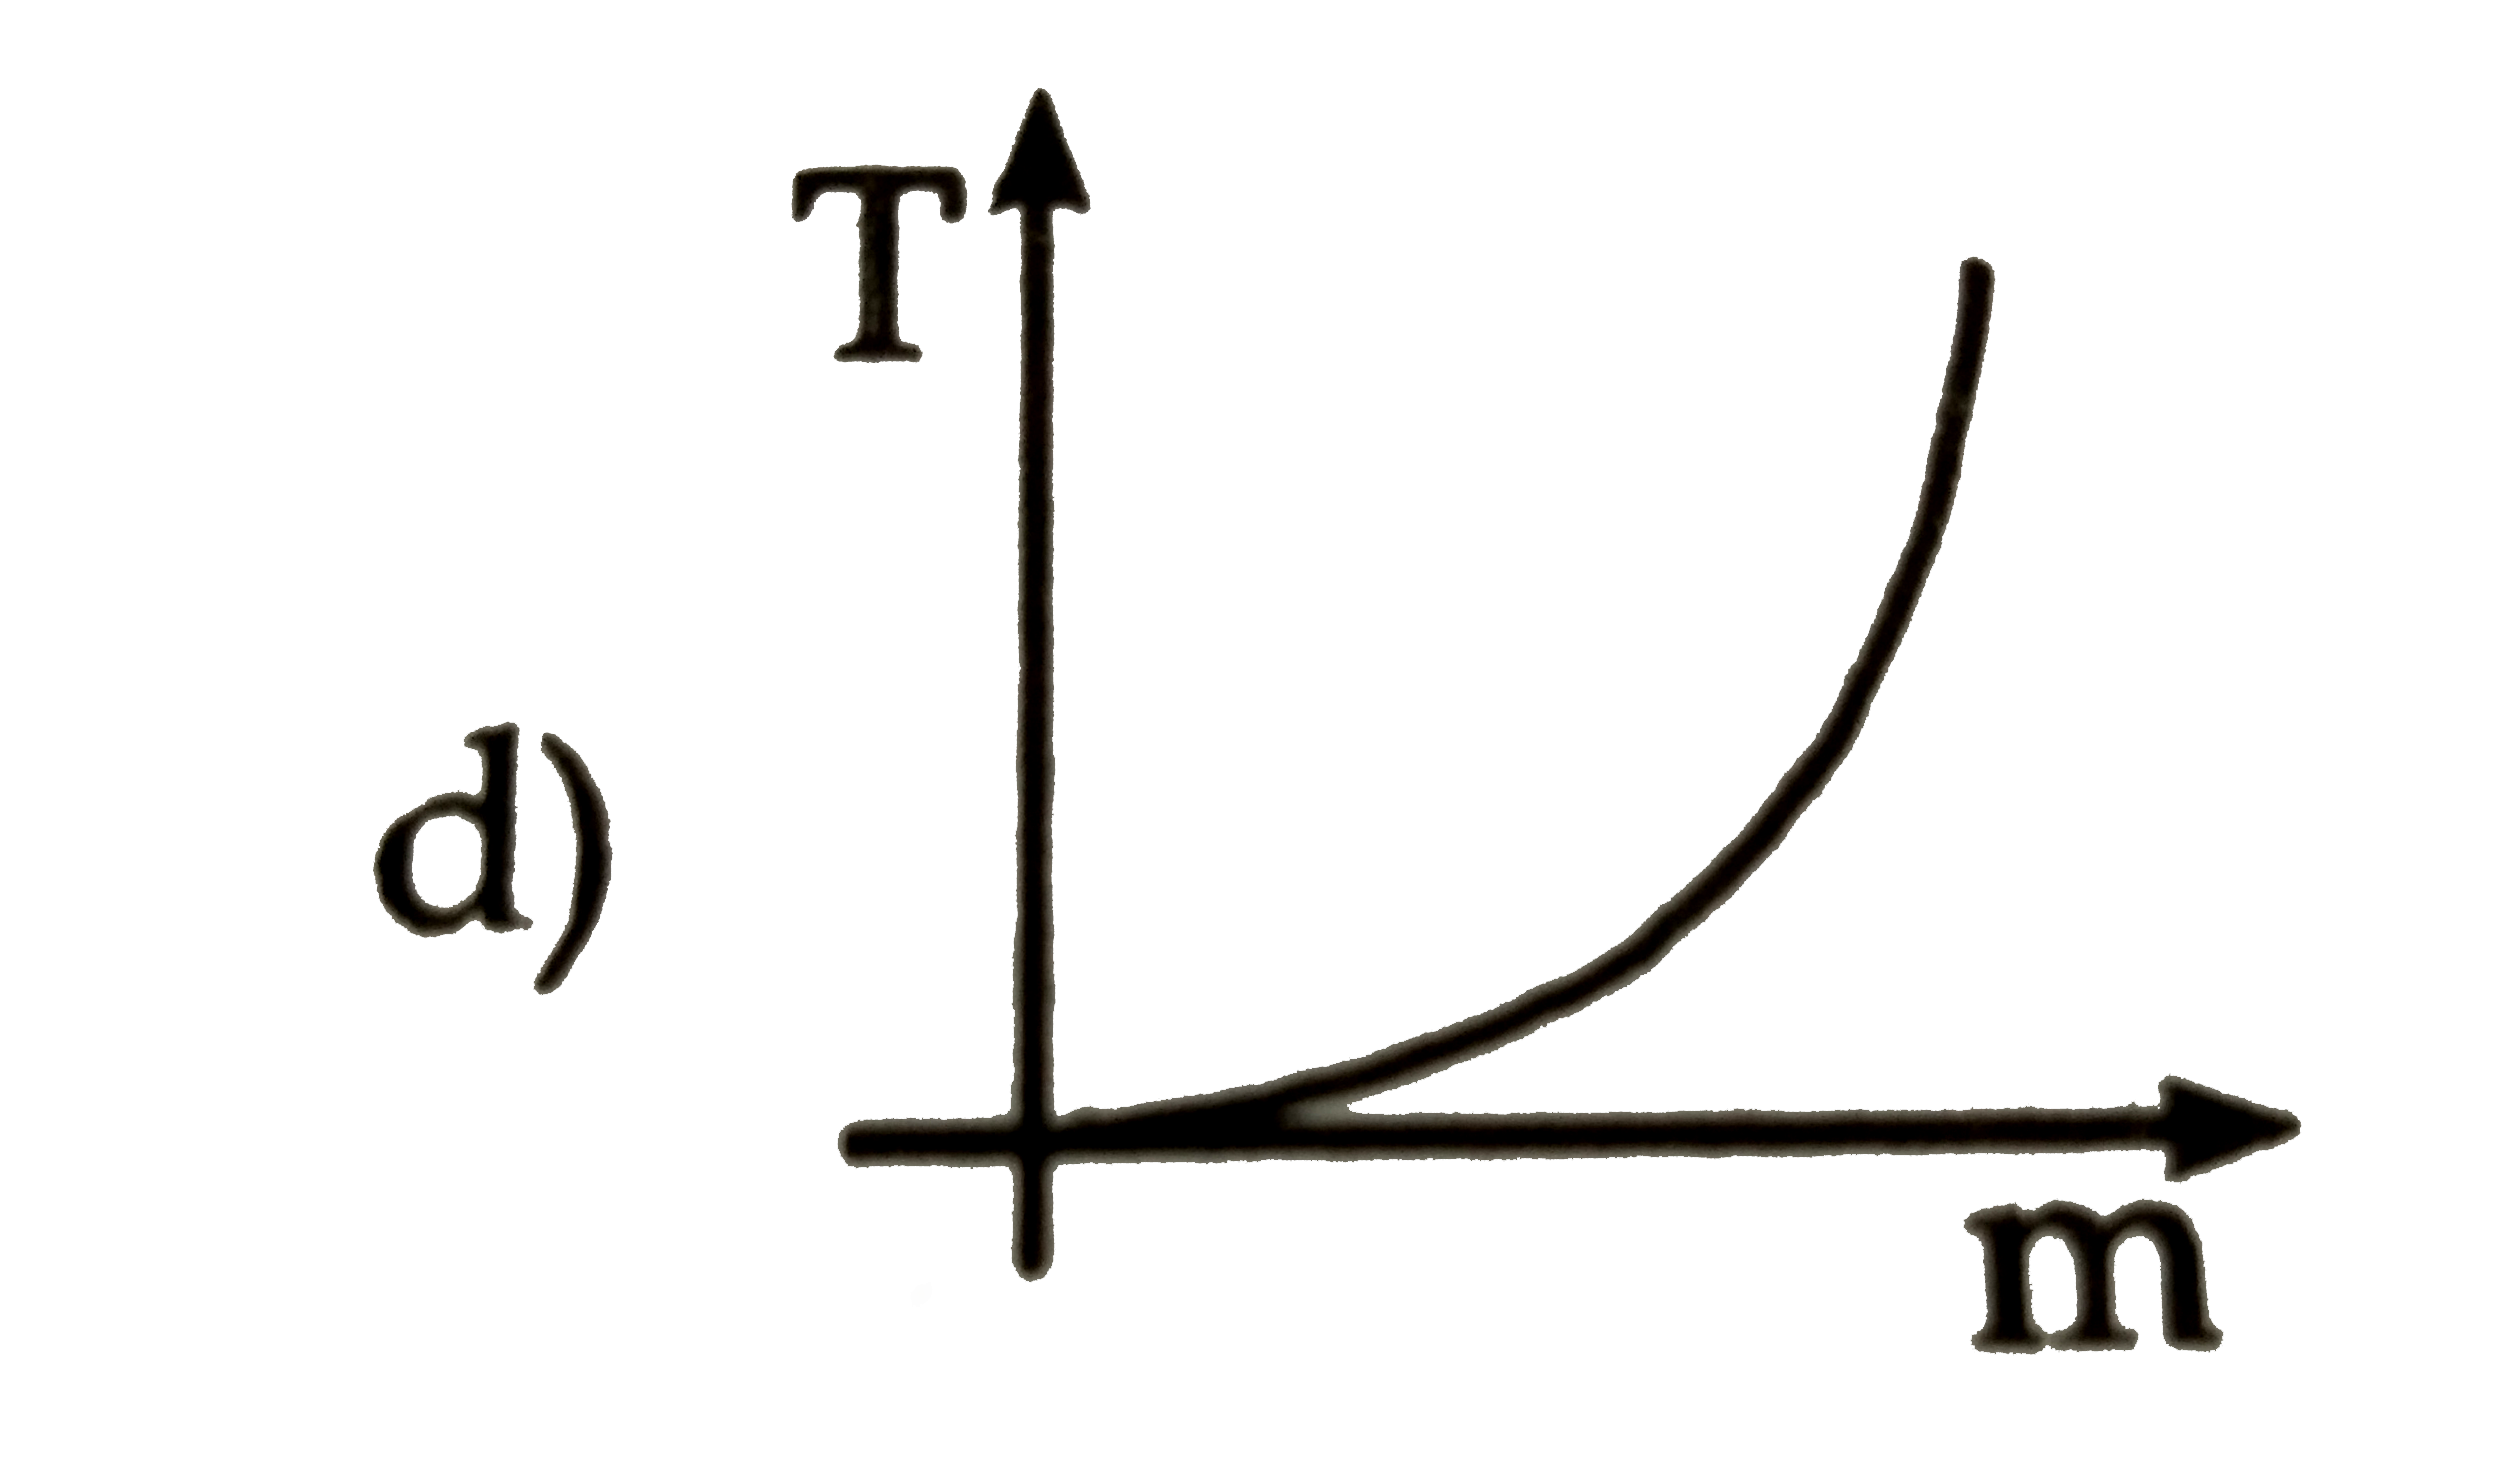
A point mass is placed at a distance a from one end of a rod of mass M and length l on the line which passes through the central axis of the rod. The potential energy of the system.
AU=−GMmaloge(a+1a)BU=−GMm(1a−1a+1)CU=−GMm1loge(a+1a)DU=−GMmaThe period of oscillation of mass M suspended from a spring of negligible mass is T. If along with it another mass M is also suspended, the period of oscillation will now be
ATBT/√2C2TD√2T
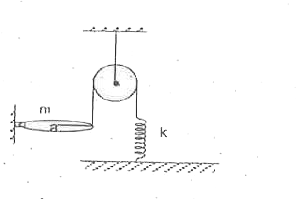
A ring of mass m and radius a is connected to an inextensible string which passes over a frictionless pulley. The other end of string is connected to upper end of a massless spring of spring constant k. The lower end of the spring is fixed. The ring can rotate in the vertical plane about hinge without any friction. If horizontal position of ring is equilibrium position then find time period of small in oscillations of the ring.
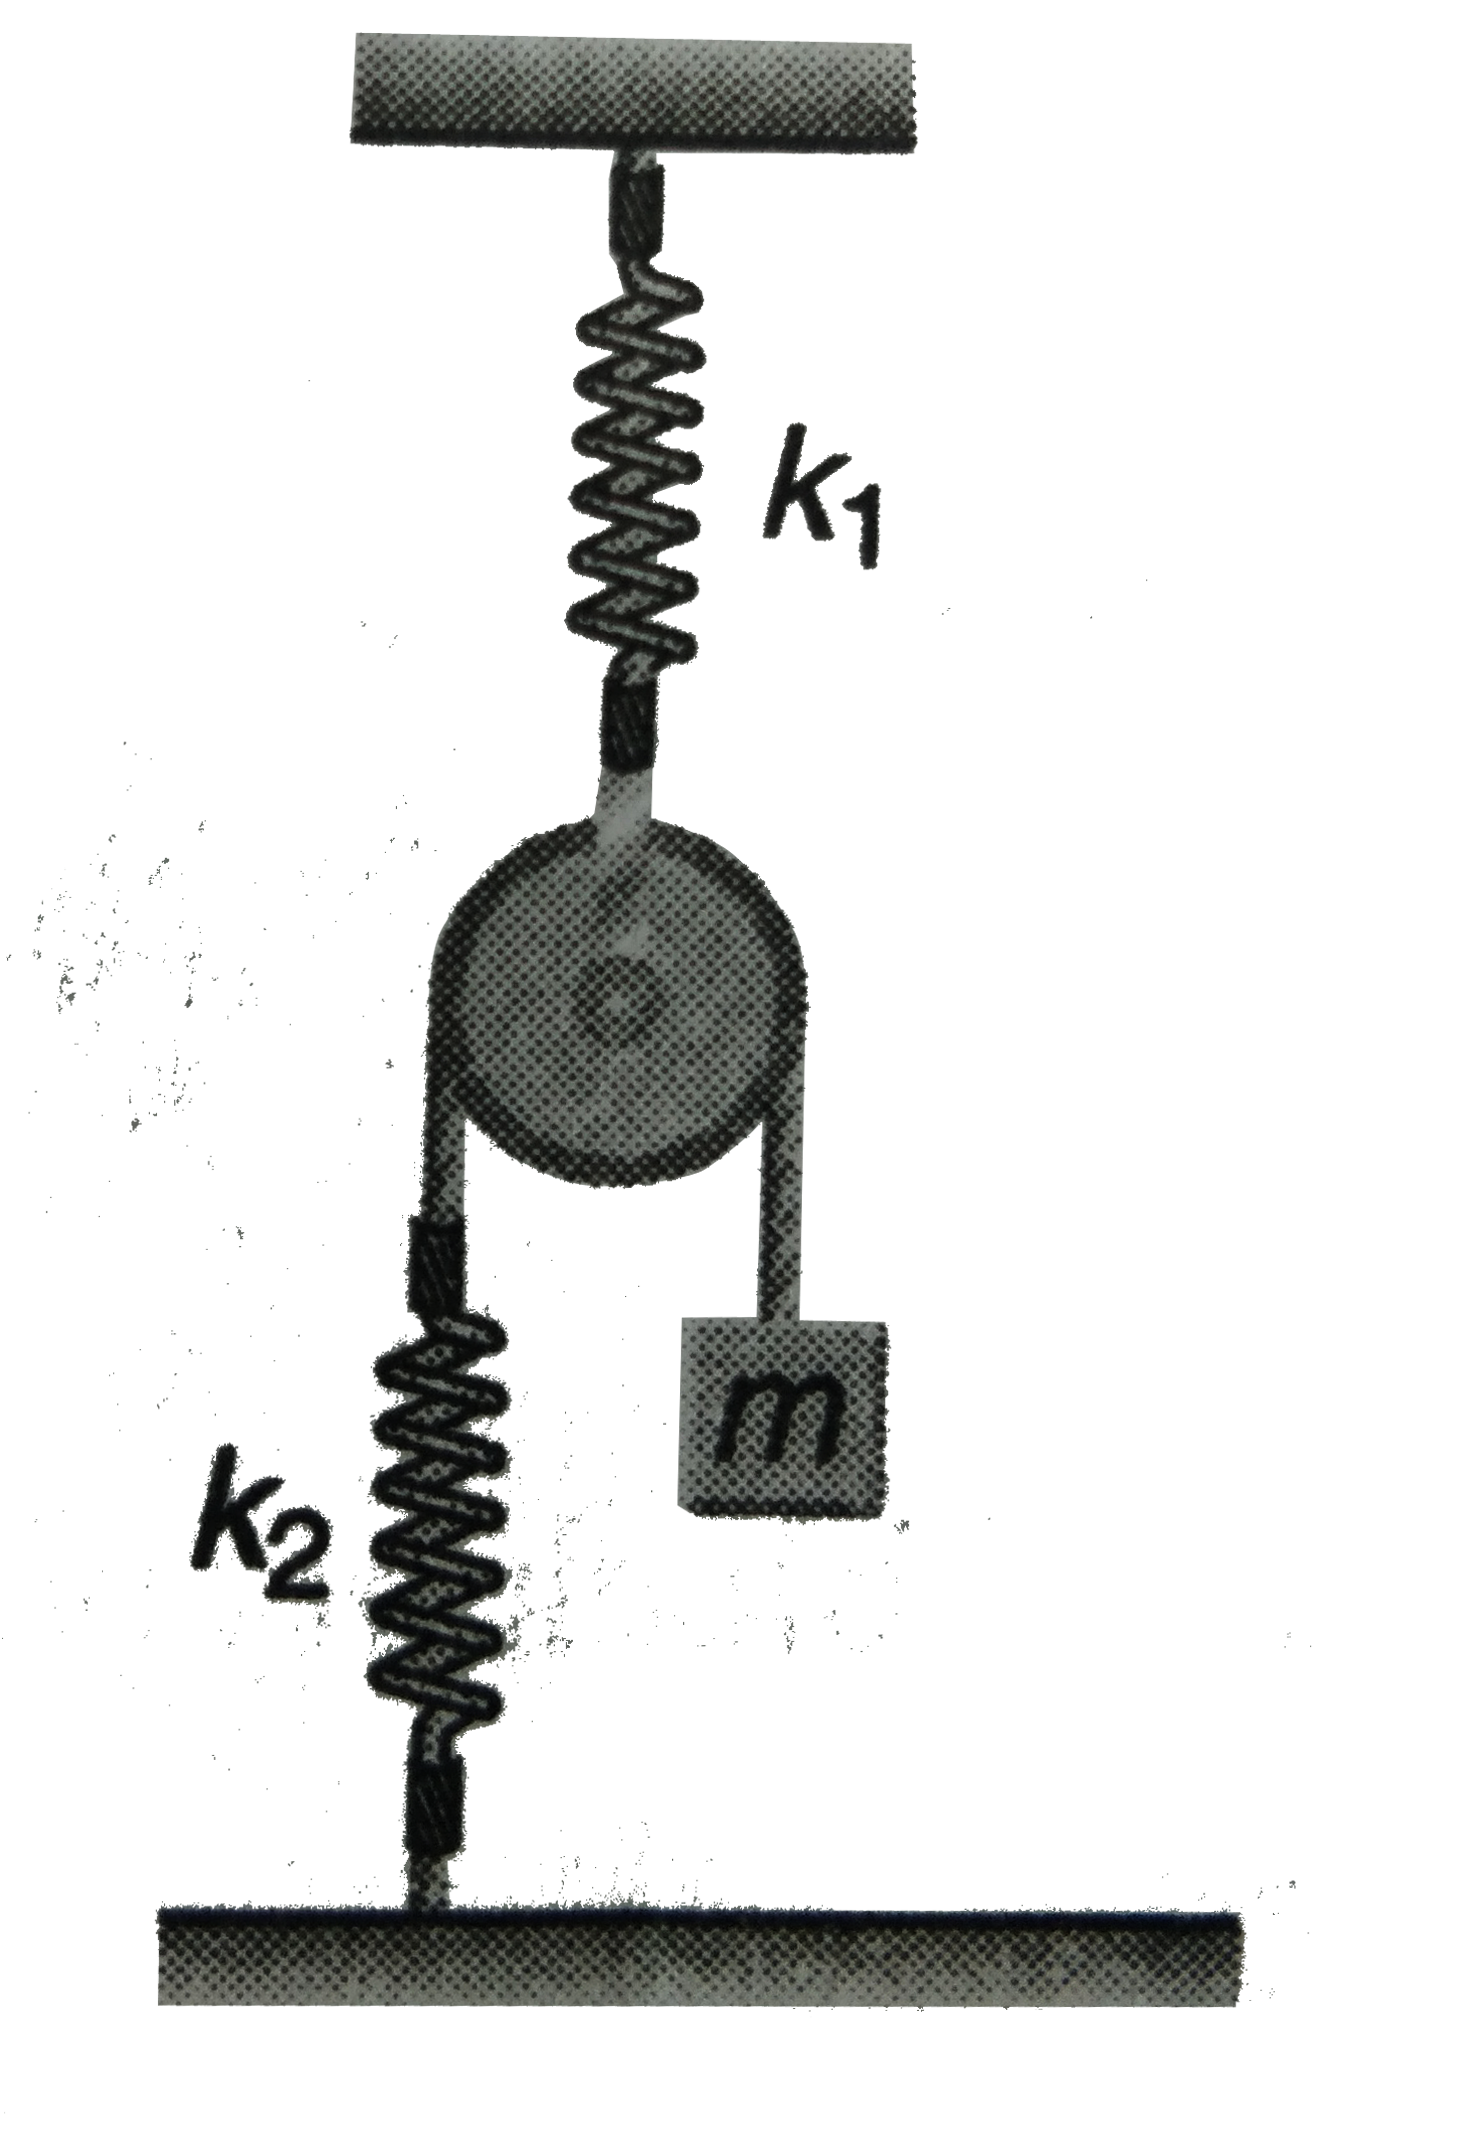
View SolutionA light pulley is suspended at the lower end of a spring of constant k1, as shown in figure. An inextensible string passes over the pulley. At one end of string a mass m is suspended, the other end of the string is attached to another spring of constant k2. The other ends of both the springs are attached to rigid supports, as shown. Neglecting masses of springs and any friction, find the time period of small oscillations of mass m about equilibrium position.
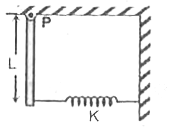
View SolutionA straight rod of light L and mass m is pivoted freely from a point of the roof. Its lower end is connected to an ideal spring of spring constant K. The other end of the spring is connected to the wall as shown in the figure. Find the frequency of small oscillation of the system.
View SolutionA vertical spring has a time period of oscillations of T1 with a load m1 at its end. Its time period is T2 when the load is replaced by another of mass m2. The force constant of the spring is
View SolutionOne mass m is suspended from a spring. Time period of oscilation is T. now if spring is divided into n pieces & these are joined in parallel order then time period of oscillation if same mass is suspended.
View Solution
