Which of the following graphs may not repersent variation of distance (S) with respect ot time (t) ?
(a) 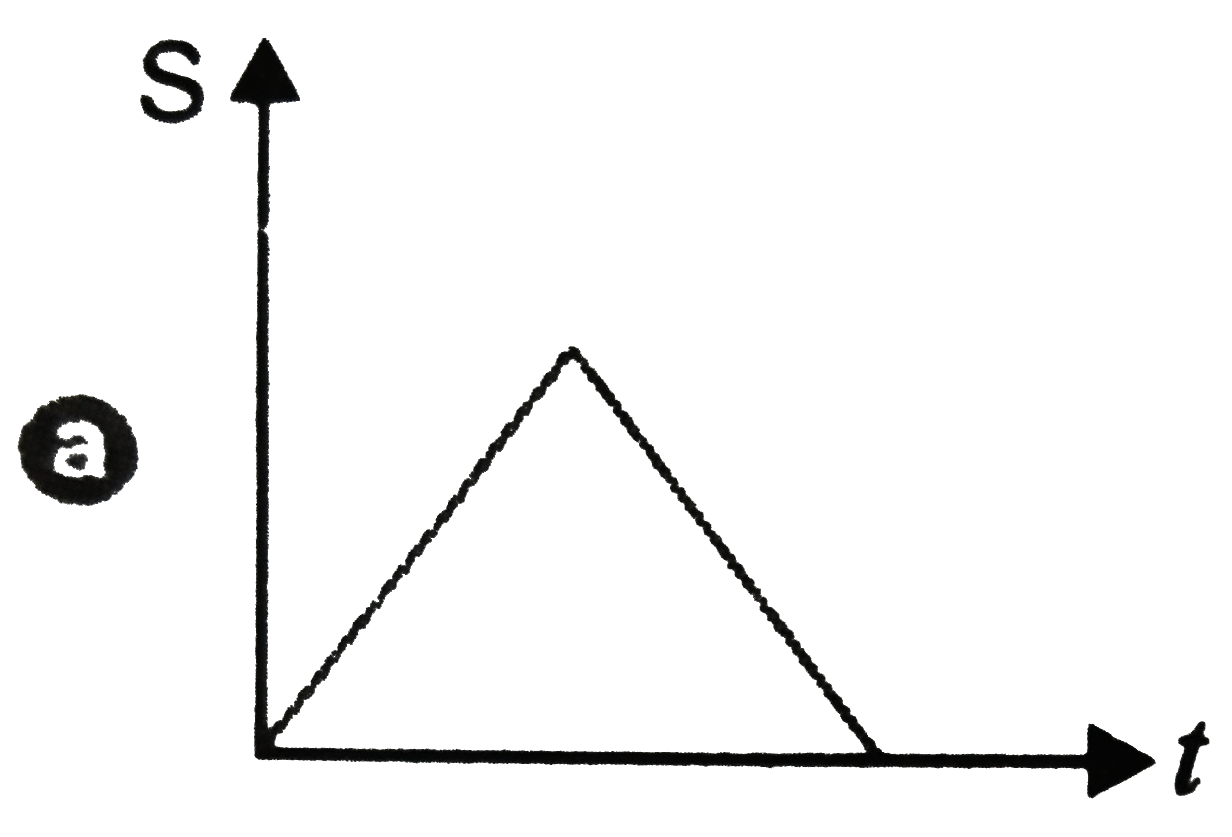
(b) 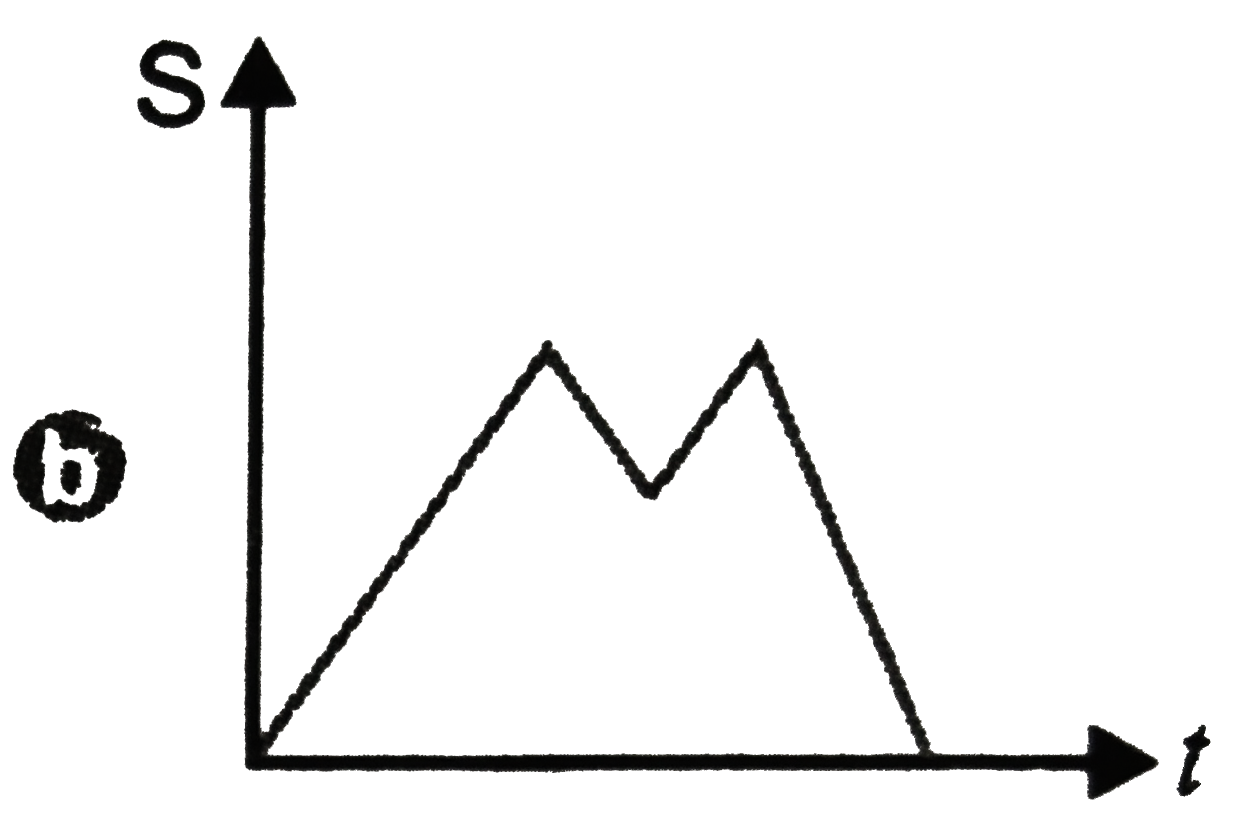
(c ) 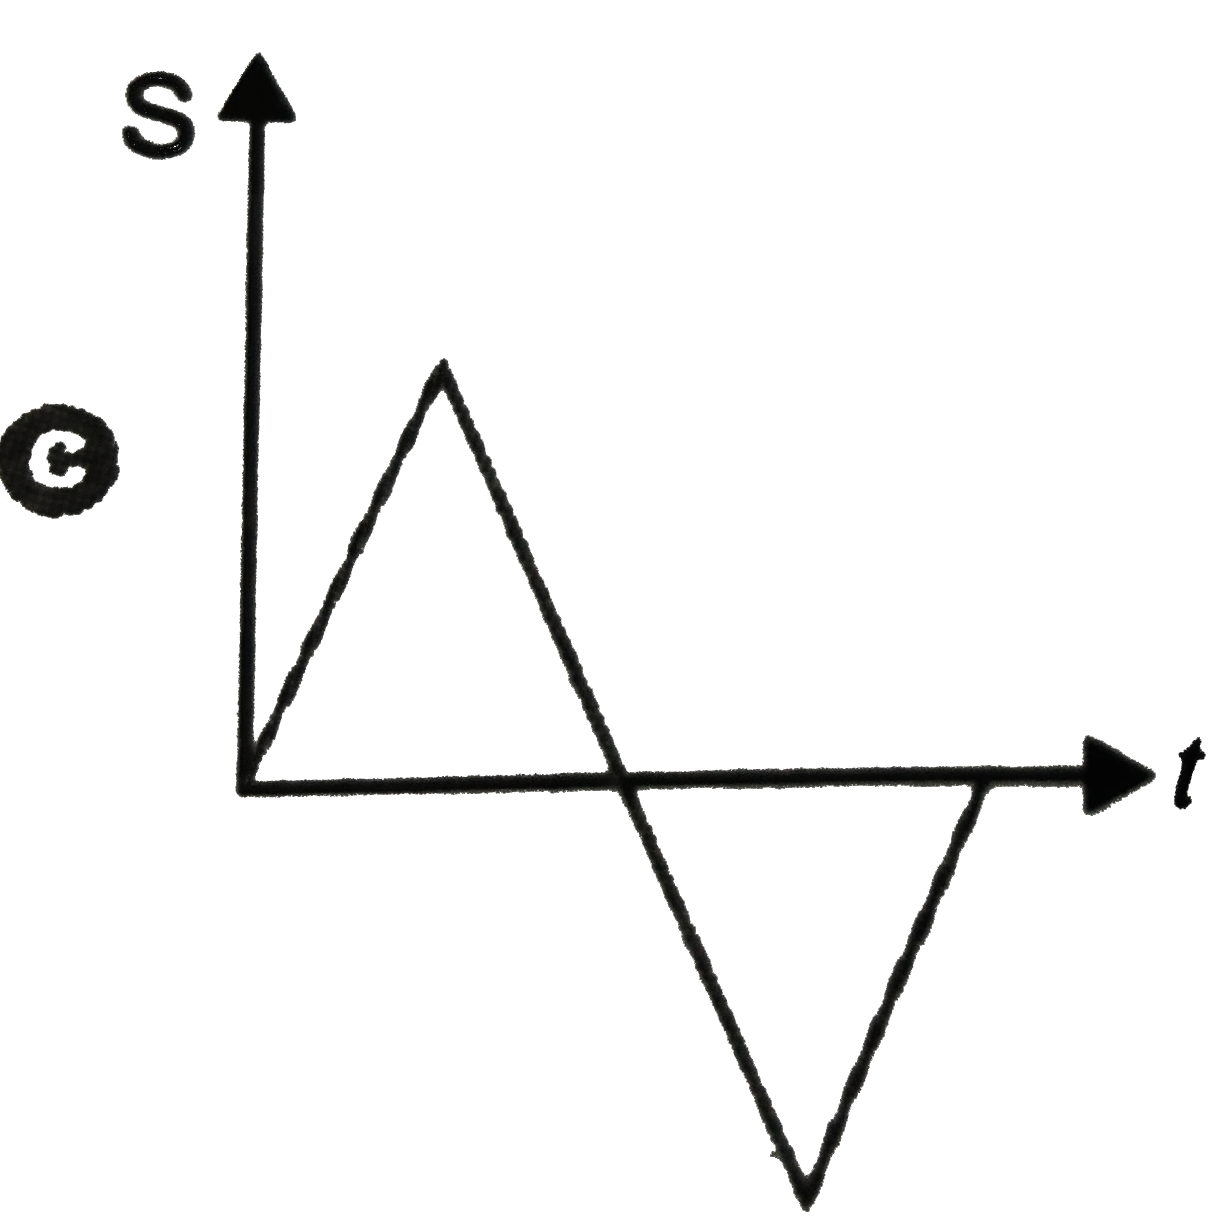
(d) 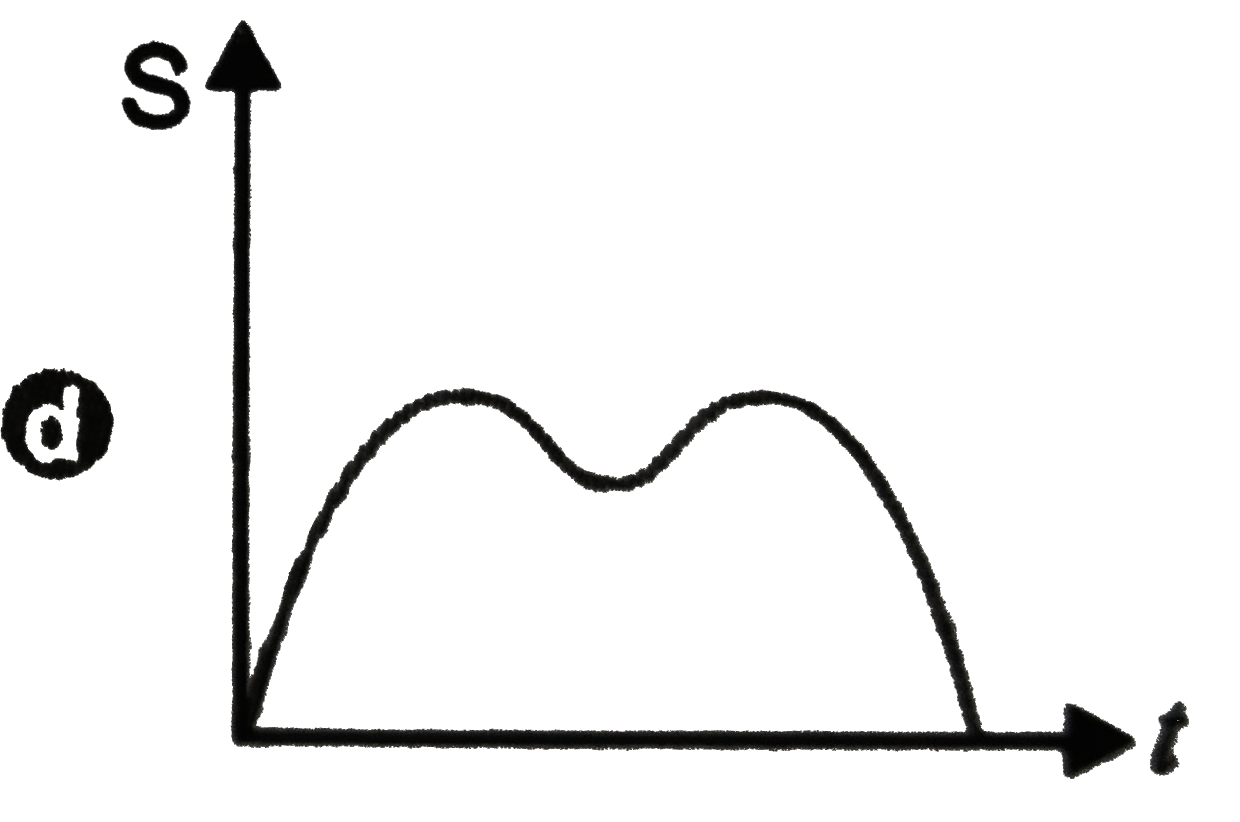
The correct Answer is:C
Groph (c ) is not possible as the distance shown there is begative, which is not possible. The other graphs are possible.
Topper's Solved these Questions
- KINEMATICSBOOK - PRADEEPCHAPTER - KINEMATICSEXERCISE - 4 NCERT multiple Choice
10 Videos
- KINEMATICSBOOK - PRADEEPCHAPTER - KINEMATICSEXERCISE - 4 NCERT Integer type
4 Videos
- KINEMATICSBOOK - PRADEEPCHAPTER - KINEMATICSEXERCISE - 2 NCERT multiple
15 Videos
- GRAVIATIONBOOK - PRADEEPCHAPTER - GRAVIATIONEXERCISE - Assertion-Reason Type Questions
19 Videos
- LAWS OF MOTIONBOOK - PRADEEPCHAPTER - LAWS OF MOTIONEXERCISE - Assertion- Reason Type Questions
17 Videos
Similar Questions
which of the following graph represents the variation of resistivity (ρ) with temperature (T) for copper?
View SolutionA body is acted upon by a constant force fromtime t=0 to a time t=T after which it does not experience any force. Which of the following graphs best represents the variation of the velocity of the body with time ?
View Solution
Knowledge Check
which of the following graph represents the variation of resistivity (ρ) with temperature (T) for copper?
A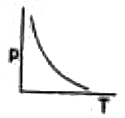 B
B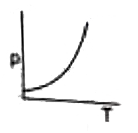 C
C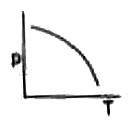 D
D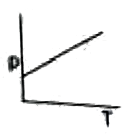
The graph shown the variation with times t of the velocity v of an object . Which one of the following graphs best represents the variation of acceleration a of the object with time t?
 A
A B
B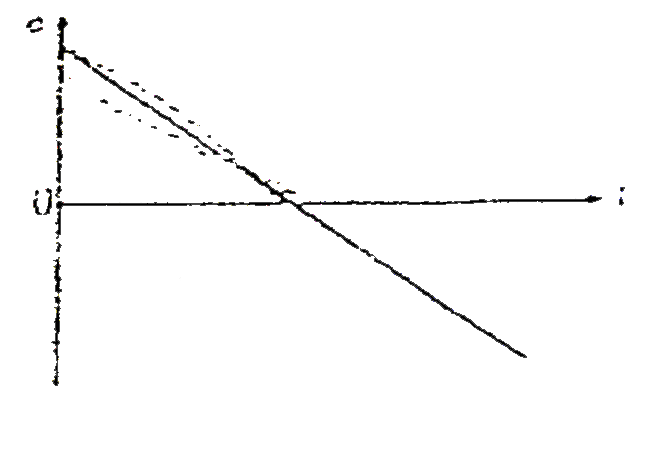 C
C D
D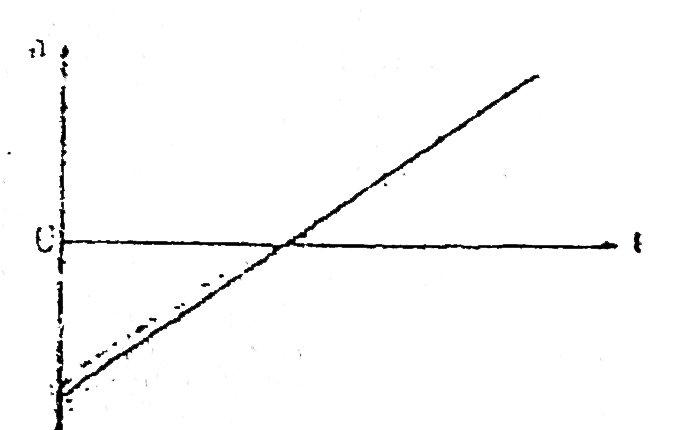
The oscillationof a body on a smooth horizontal surface is represented by the equation
x=Acosωt
where x= displacement at time t, ω= frequency of oscillation. Which one of the following graphs shows correctly the variation of acceleration a with time t ?A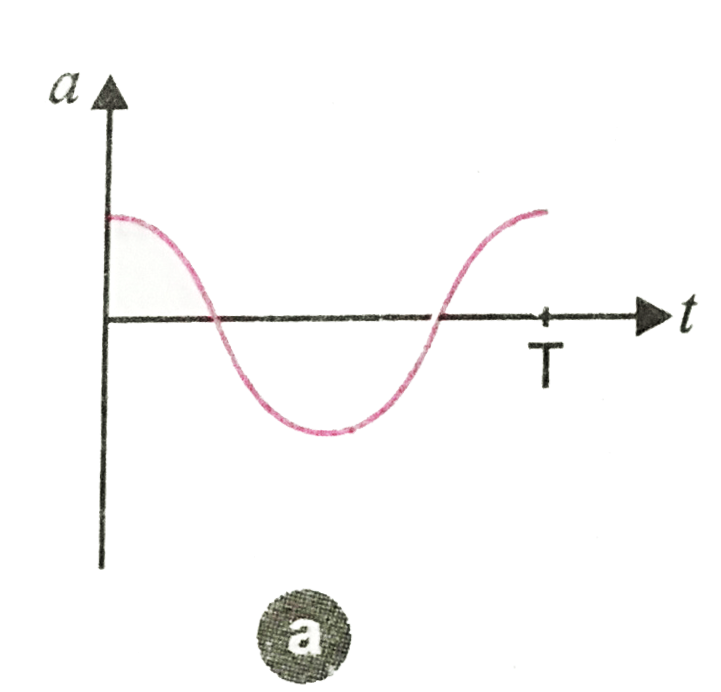 B
B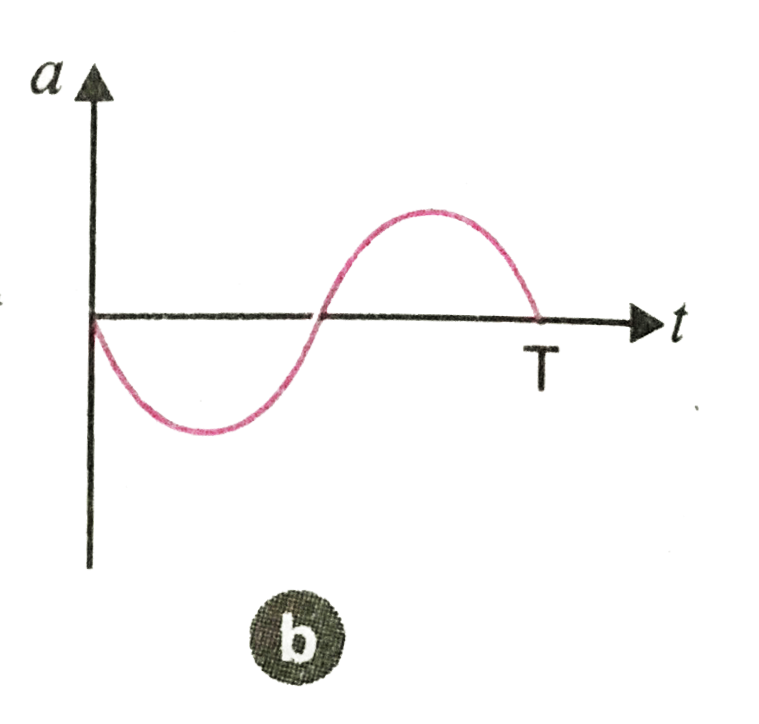 C
C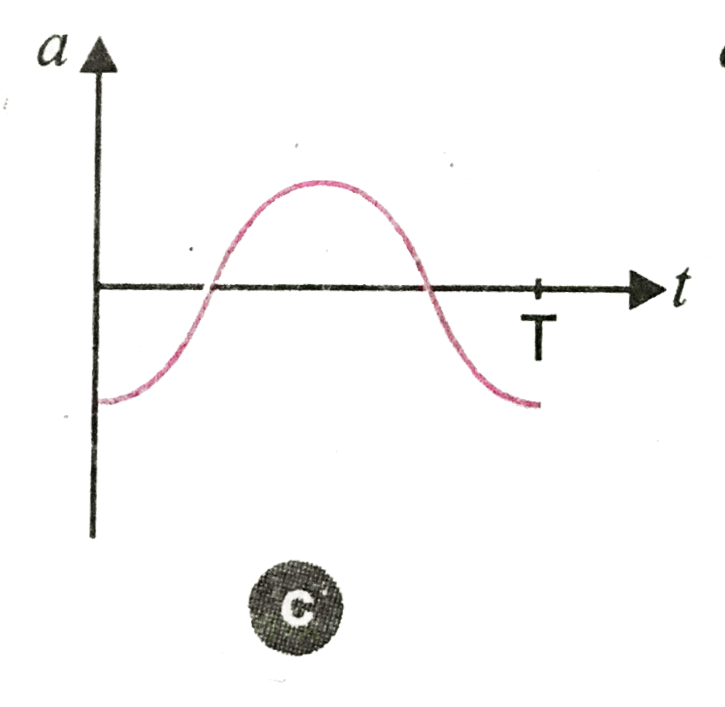 D
D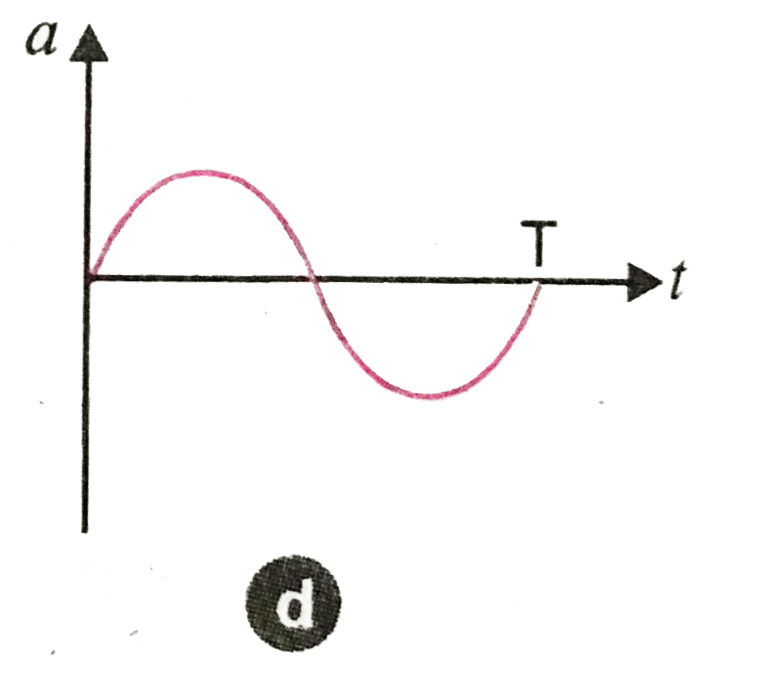
Which one of the following given graphs represents the variation of rate constant (k) with temperature (t) for an endothermic reaction ?
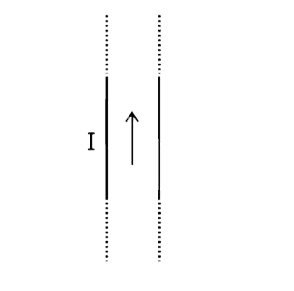
View SolutionCurrent I is flowing in infinitely long wire. Which of the following graphs represents the variation of B w.r.t. axial distance ?
View SolutionIn the graph represent direction of distance (d) vs time (t) ?
View SolutionWhich of the following graphs represents the variation of activity (A) of a radioactive substance with time (t).
View SolutionA body starting from the rest moves along a straight line with constant acceleration .Which one of the following graphs represent the variation of speed (v) and distance (s) ?
View Solution