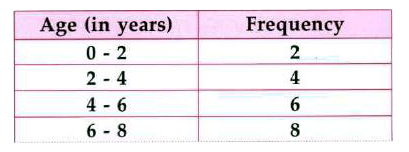
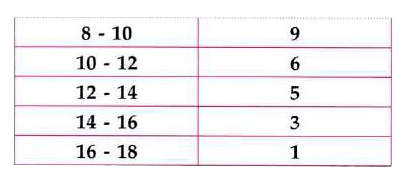
Draw a histogram and the frequency polygon from the following data:

Step by step video & image solution for Draw a histogram and the frequency polygon from the following data: by Maths experts to help you in doubts & scoring excellent marks in Class 9 exams.
Updated on:21/07/2023Topper's Solved these Questions
- BAR GRAPH, HISTOGRAM AND FREQUENCY POLYGONBOOK - RS AGGARWALCHAPTER - BAR GRAPH, HISTOGRAM AND FREQUENCY POLYGONEXERCISE - EXERCISE 17A
12 Videos
- AREAS OF TRIANGLES AND QUADRILATERALSBOOK - RS AGGARWALCHAPTER - AREAS OF TRIANGLES AND QUADRILATERALSEXERCISE - Multiple Choice Questions (Mcq)
16 Videos
- CIRCLES BOOK - RS AGGARWALCHAPTER - CIRCLES EXERCISE - MULTIPLE CHOICE QUESTION(MCQ)
37 Videos
Similar Questions
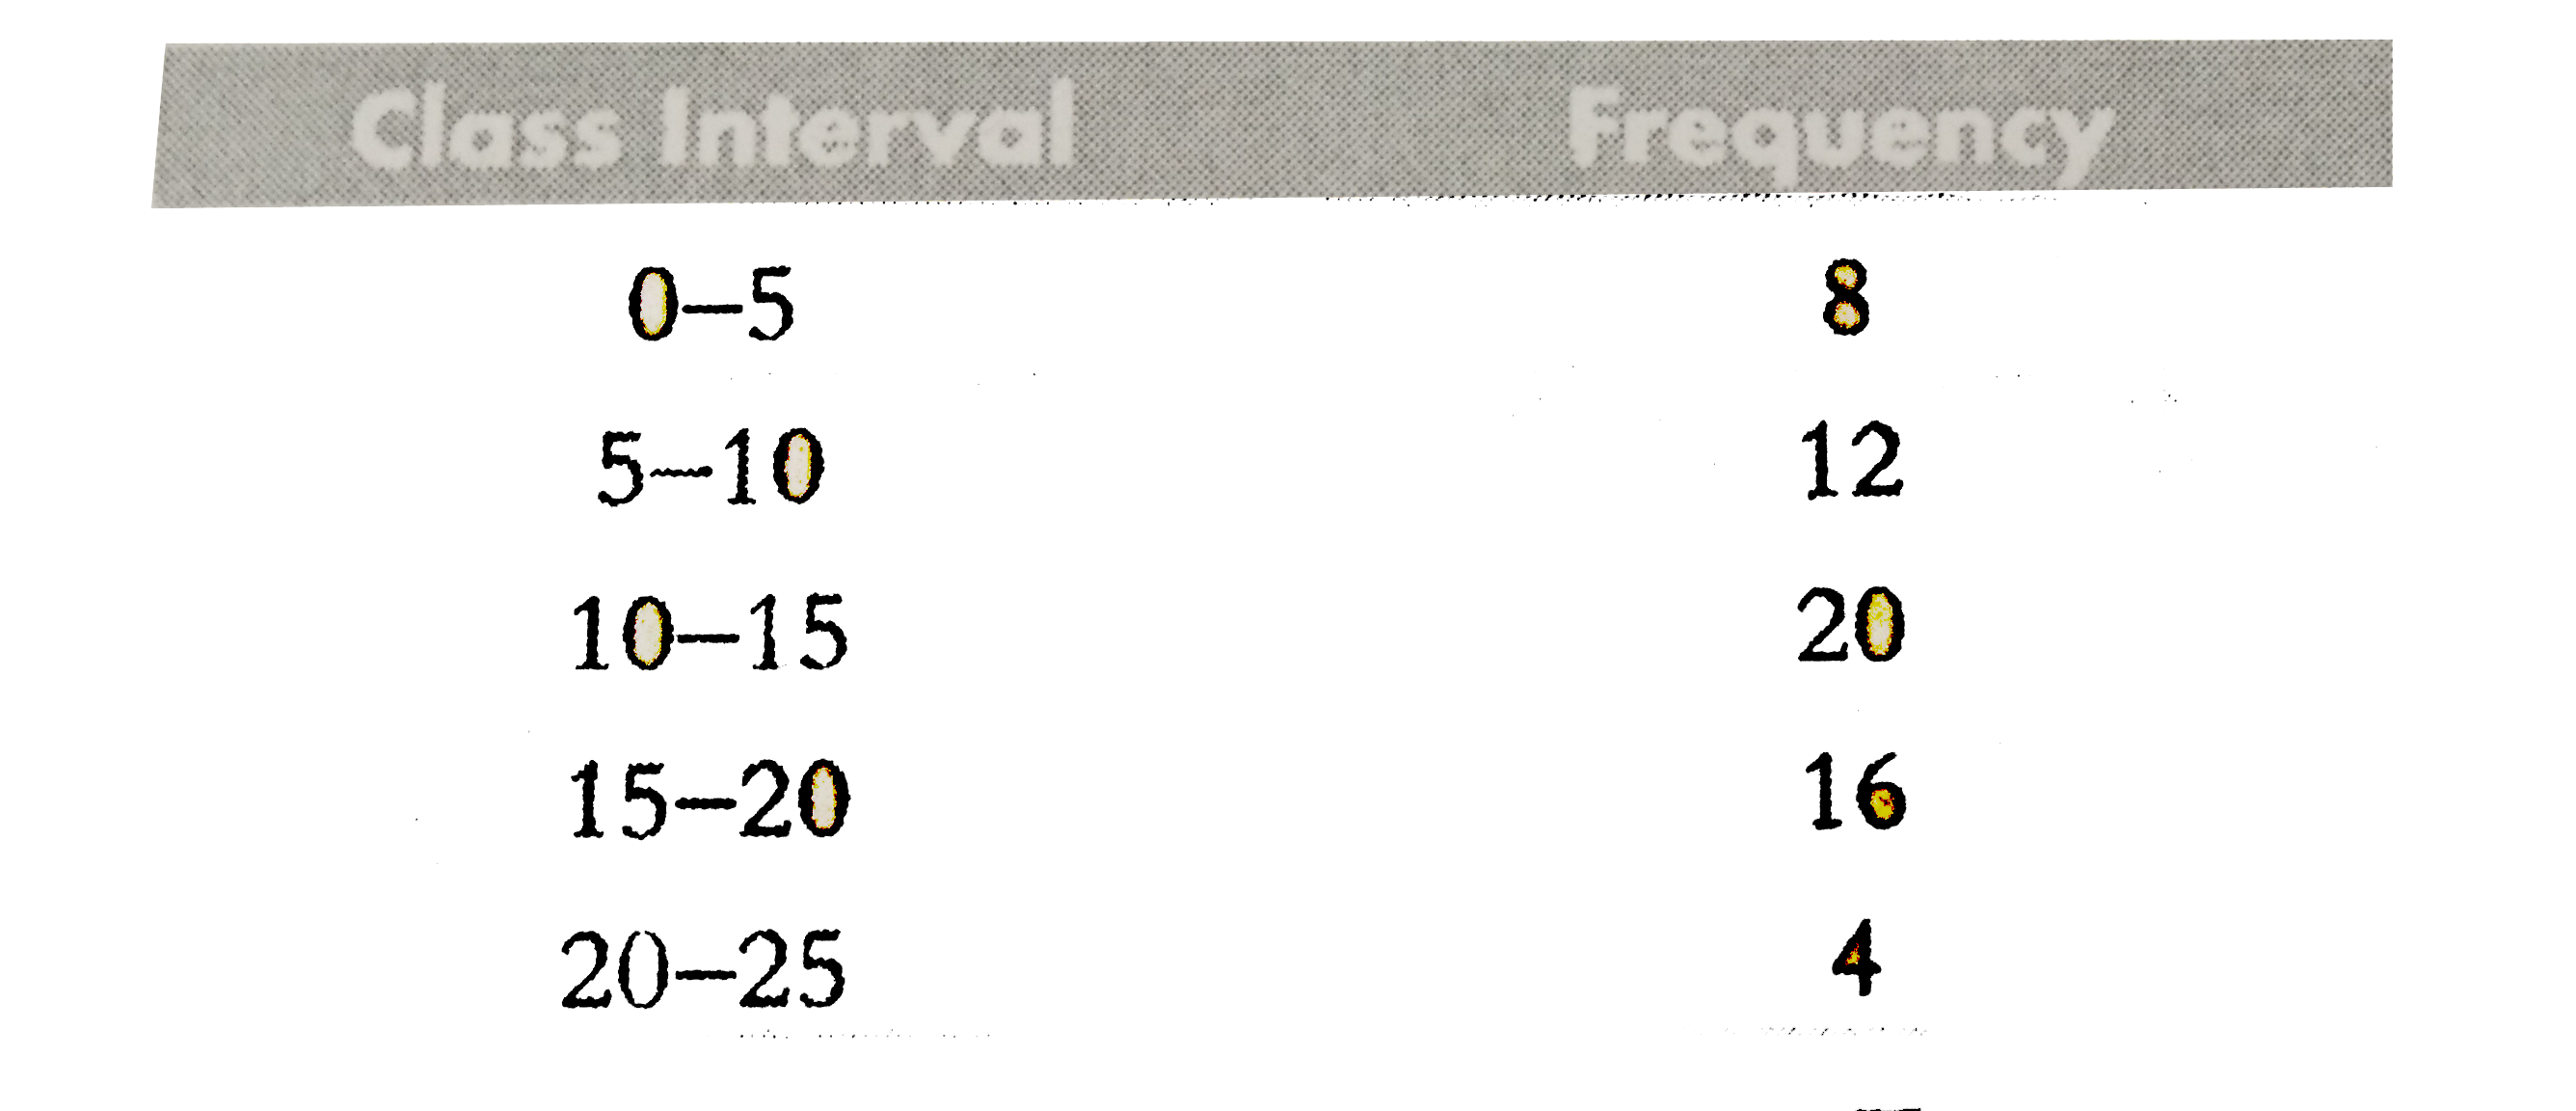
Prepare histogram and frequency polygon from the following data :

View SolutionConstruct the frequency polygon for the following data:

View SolutionDraw histogram and frequency polygon for the following distribution :

View SolutionConstruct a frequency polygon for the following data.


View SolutionDraw a histogram for the frequency distribution of the following data:

View SolutionDraw a histogram for the frequency distribution of the following data:

View Solution(i)Construct a histogram and frequency polygon of the following distribution :

(ii)Show that the area under frequency polygon is equal to the area under histogram.
View SolutionDraw the frequency polygon for the following distribution :

View SolutionDraw the frequency polygon to represent the following data.

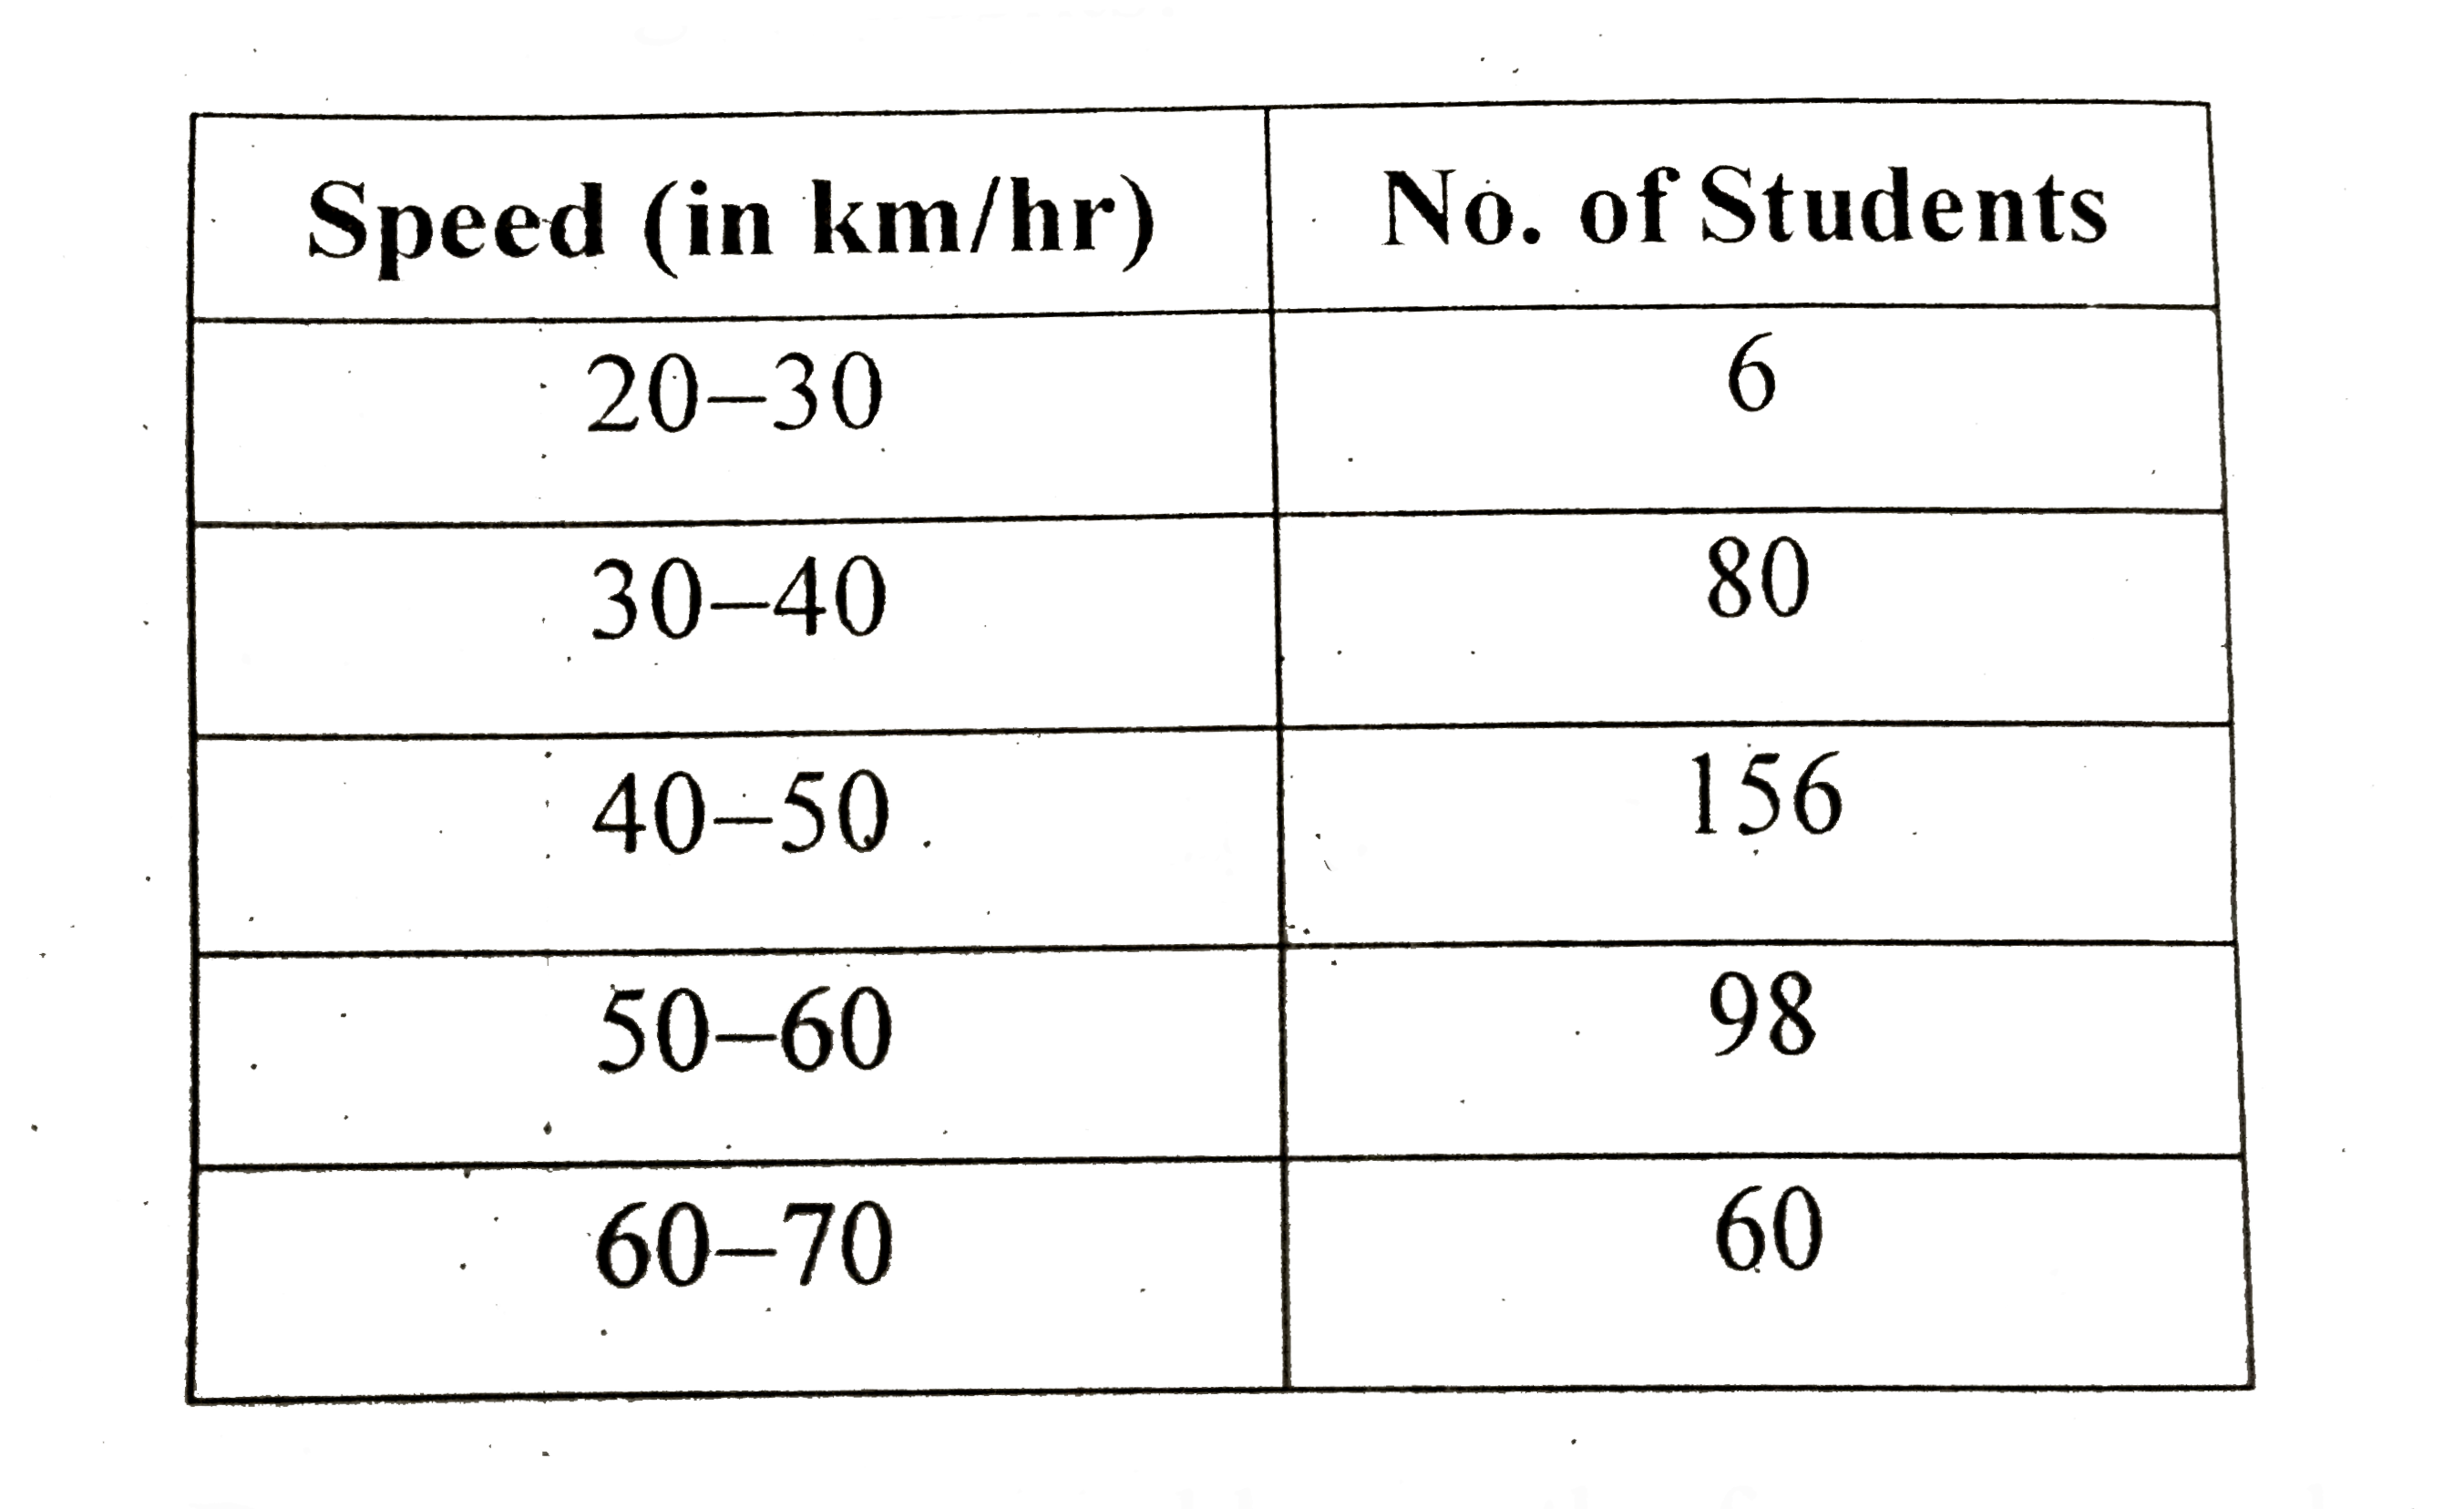
View SolutionGiven below is the frequency distribution of driving speeds (in km/hour) of the vehicles of 400 college students:

Draw Histogram and hence the frequency polygon for the above data.
View Solution
