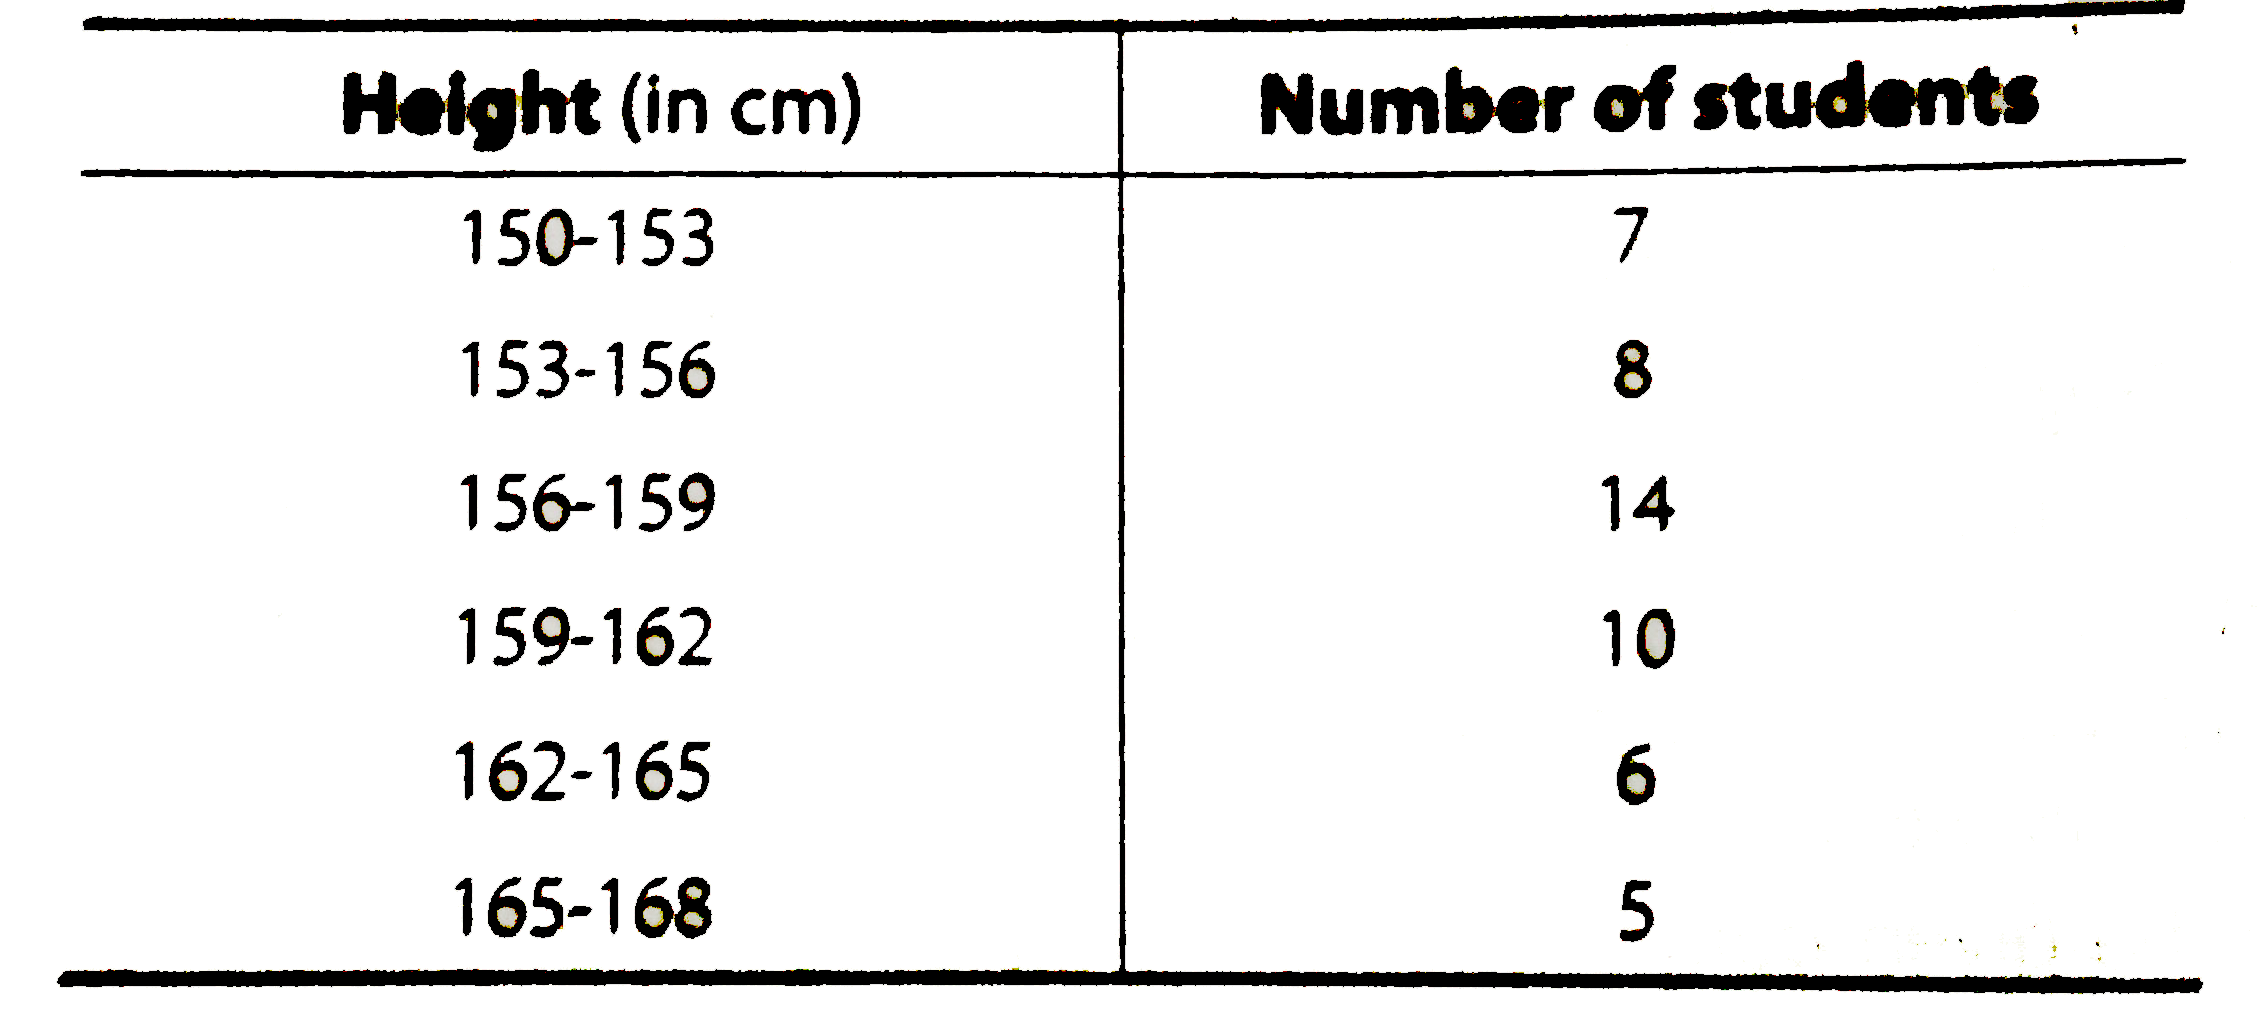
Draw a
histogram for the following data:

The
histogram of the above frequency distribution is given in Figure.
Text Solution
The given frequency distribution is not continuous. So, we first convert it into a continuous frequency distribution.
The difference between the lower limit of a class and the upper limit of the preceding class is
1 i.e. h=1
To convert the given frequency distribution into a continuous frequency distribution, we subtract h2=12=0.5 from each lower limit and add
h2=0.5 to each upper limit.
The distribution so obtained is as given below:


|
Topper's Solved these Questions
Similar Questions
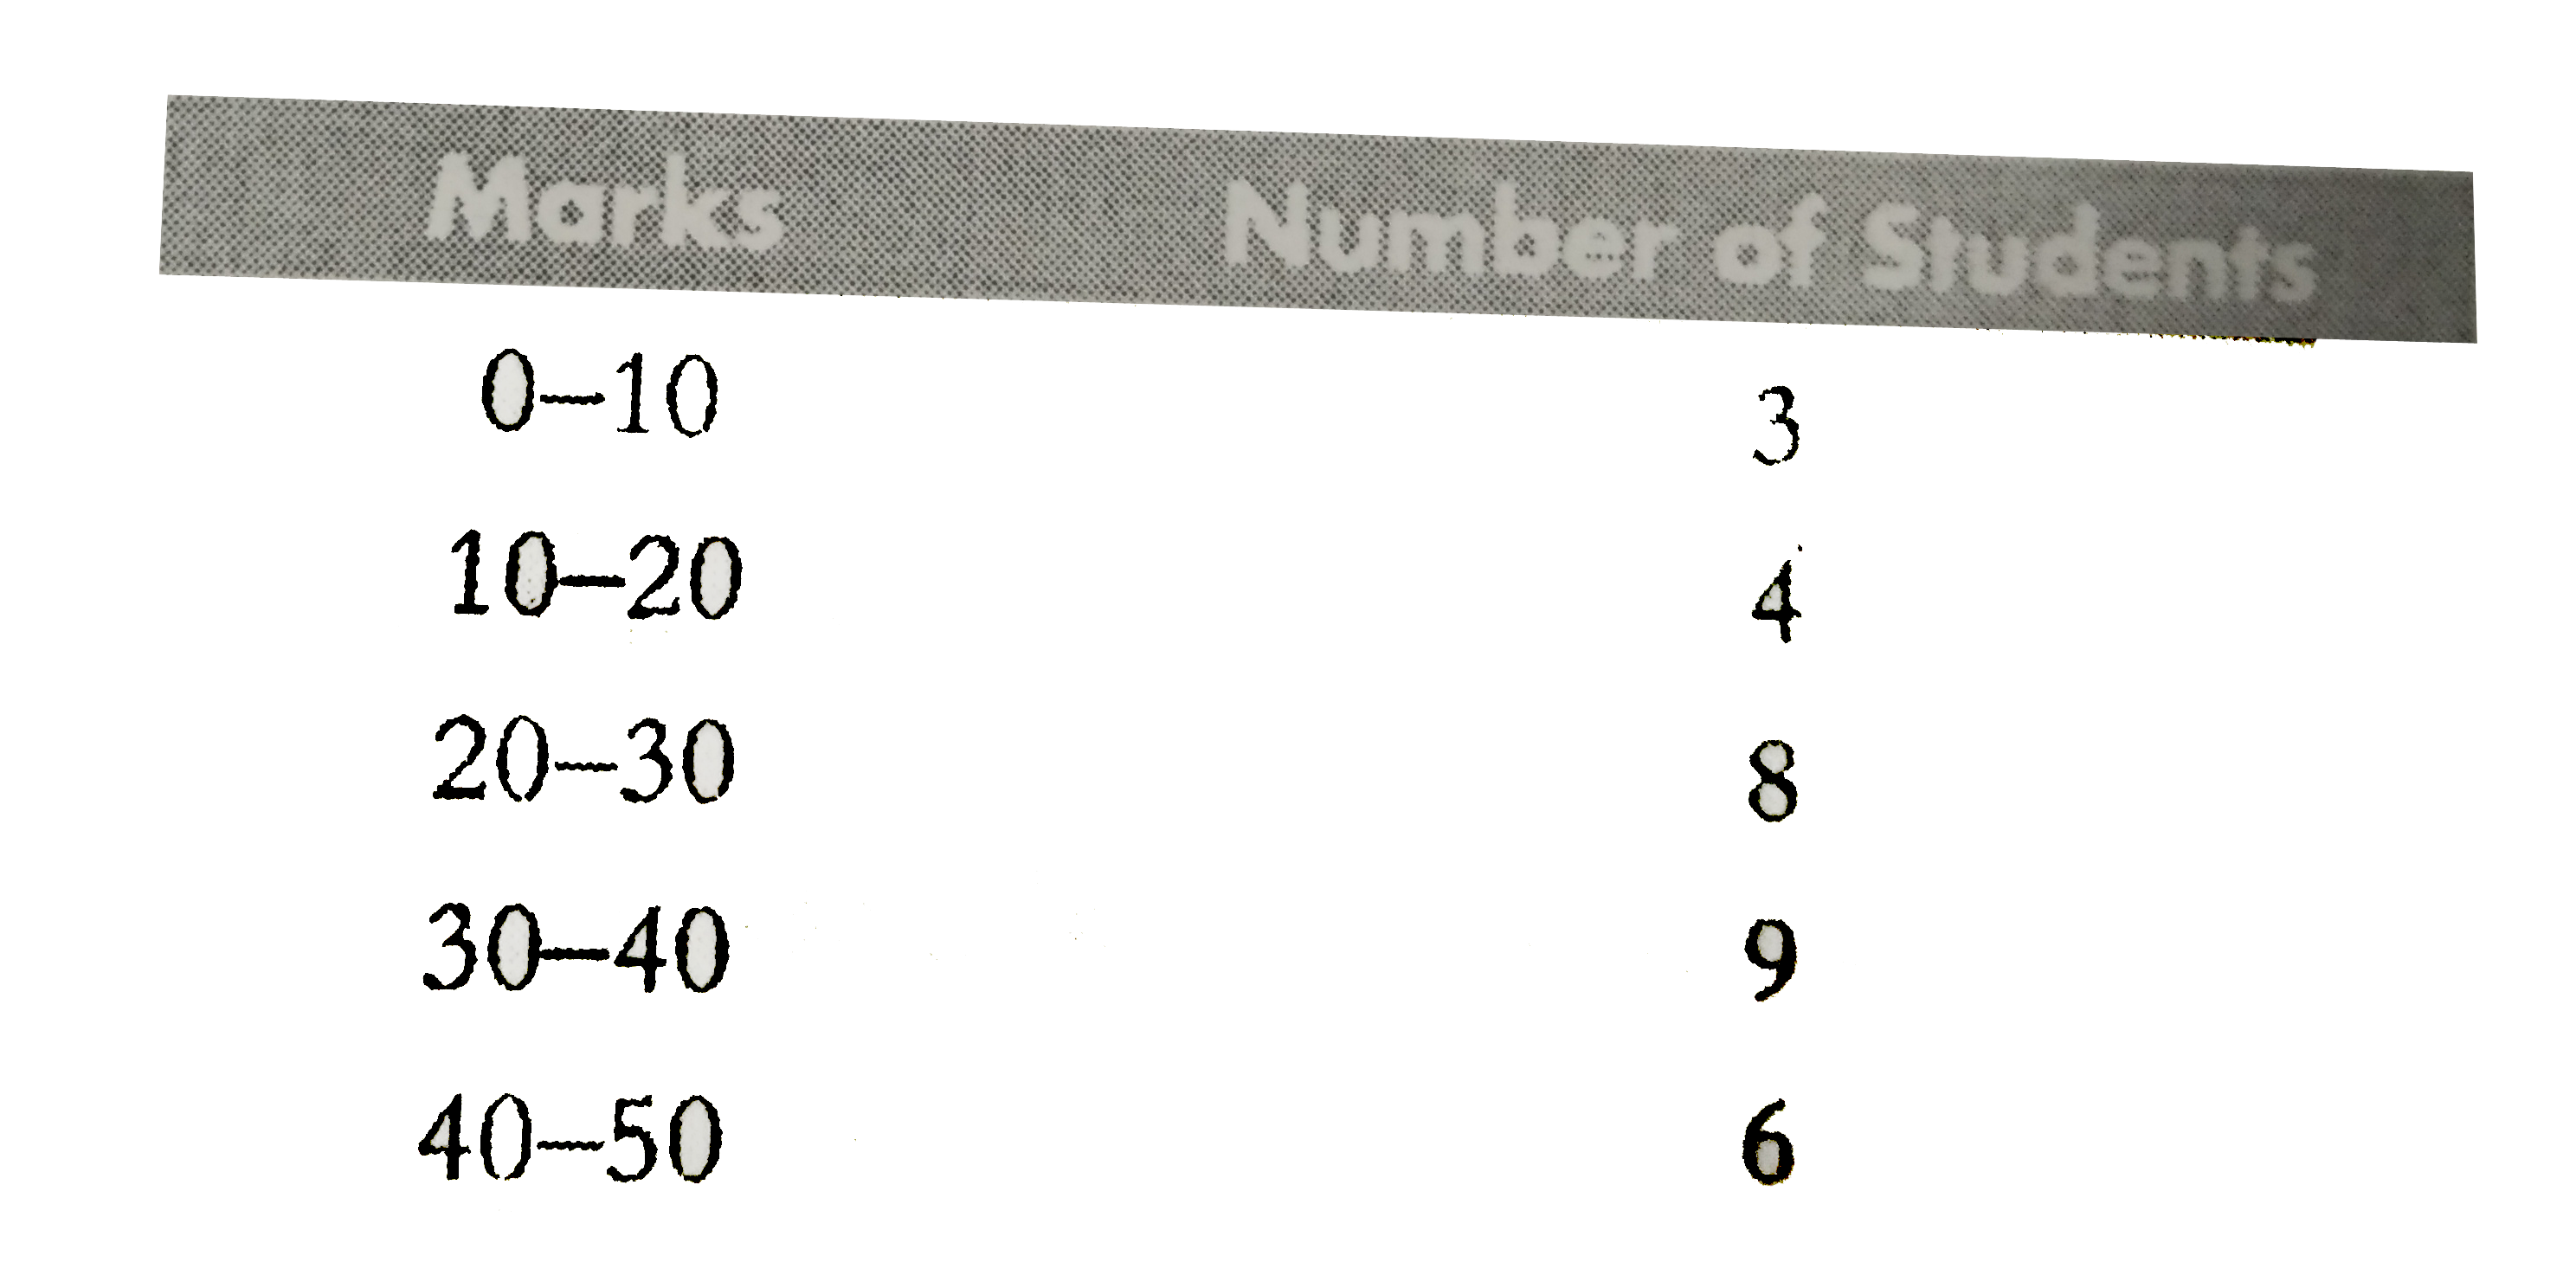
Draw a histogram from the following data:

View SolutionDraw a histogram from the following data:

View SolutionDraw a histogram of the following data :

View SolutionDraw a histogram of the following data.

View SolutionDraw a histogram of the following data

View SolutionDraw a histogram to represent the following data.

View SolutionDraw the histogram for the following frequency distribution :

View SolutionDraw a histogram of the following distribution.

View SolutionDraw a histogram of the following distribution.

View SolutionDraw the histogram for the following distribution :

View Solution
