On a certain day, the temperature in a city was recorded as under:

Illustrate the data by a bar graph.
Step by step video & image solution for On a certain day, the temperature in a city was recorded as under: Illustrate the data by a bar graph. by Maths experts to help you in doubts & scoring excellent marks in Class 9 exams.
Updated on:21/07/2023Topper's Solved these Questions
- BAR GRAPH, HISTOGRAM AND FREQUENCY POLYGONBOOK - RS AGGARWALCHAPTER - BAR GRAPH, HISTOGRAM AND FREQUENCY POLYGONEXERCISE - EXERCISE 17B
16 Videos
- BAR GRAPH, HISTOGRAM AND FREQUENCY POLYGONBOOK - RS AGGARWALCHAPTER - BAR GRAPH, HISTOGRAM AND FREQUENCY POLYGONEXERCISE - EXAMPLE
11 Videos
- AREAS OF TRIANGLES AND QUADRILATERALSBOOK - RS AGGARWALCHAPTER - AREAS OF TRIANGLES AND QUADRILATERALSEXERCISE - Multiple Choice Questions (Mcq)
16 Videos
- CIRCLES BOOK - RS AGGARWALCHAPTER - CIRCLES EXERCISE - MULTIPLE CHOICE QUESTION(MCQ)
37 Videos
Similar Questions
In a survey of 130 families of a colony, the number of children in each family was recorded and the data has been represented by the bar graph, given below.
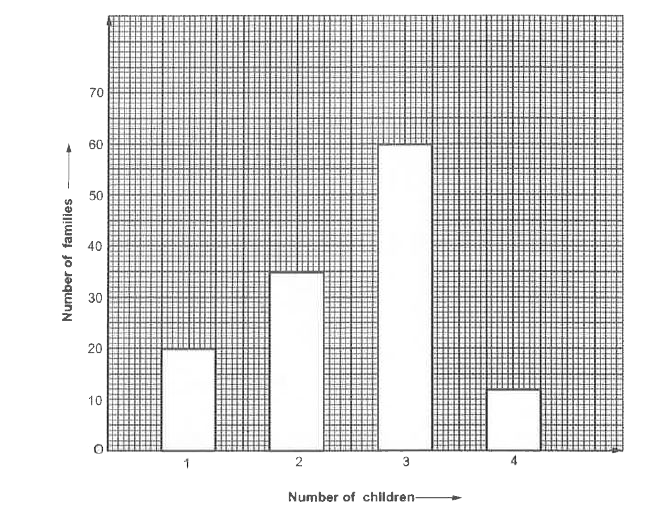
Read the bar graph carefully and answer the questions given below:
(i)what information does the bar graph give?
(ii)how many families have two children ?
(iii)how many families have no children ?
(iv)what percentage of families have 4 children?
View SolutionFollowing table shows the number of bicycles manufactured in a factory during the years 1998 to 2002. Illustrate this data using a bar graph. Choose a scale of your choice
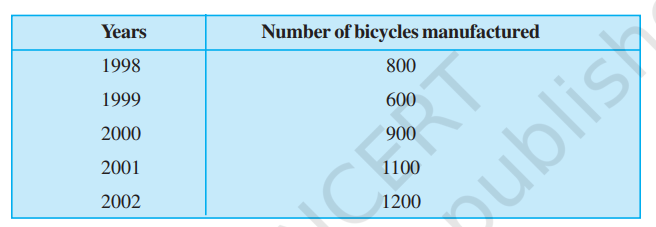
View Solution
Knowledge Check
The temperature (in °C) of a city in a week was recorded as follows :
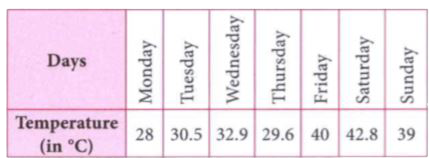
What is the range of the temperature?A20.8∘CB28.6∘CC14.8∘CD32.9∘CUnder constant temperature, graph between P and 1/V is a
AparabolaBhyperbolaCstraight lineDcircle
Following table shows the number of bicycles manufactured in a factory during the years 1998 to 2002. Illustrate this data using a bar graph. Choose a scale of your choice.
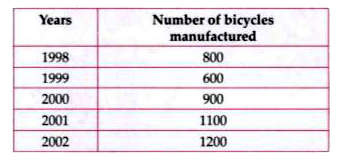
In which year were the maximum number of bicycles manufactured ?
View SolutionFollowing table shows the number of bicycles manufactured in a factory during the years 1998 to 2002. Illustrate this data using a bar graph. Choose a scale of your choice.
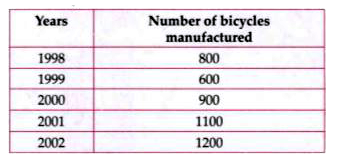
In which year were the minimum number of bicycles manufactured ?
View SolutionOn a particular day, the temperature recorded in New York was 60∘F. What would be the equivalent temperature in .∘C?
View SolutionIn summers,the day time temperature is recorded as (43±1)∘C and in night it is recorded as (35±1)∘C. The fall in temperature is calculated as
View SolutionThe following table shows the number of fruits in a fruit shop. Represent the above data by a bar graph
View Solution. The following data shows the year wise strength of a school.Represent the the above data by bar graph:
View Solution
