The bar graph given below shows the marks of students of a class in a particular subject:
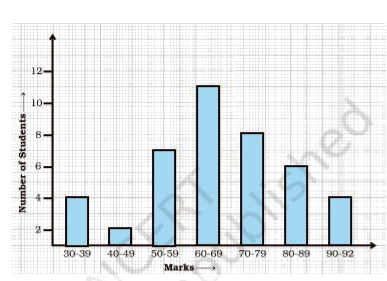
Study the bar graph and answer the following questions:
(a) If 40 is the pass mark, then how many students have failed?
(b) How many students got marks from 50 to 69?
(c) How many students scored 90 marks and above?
(d) If students who scored marks above 80 are given merits then how many merit holders are there?
(e) What is the strength of the class?
Step by step video & image solution for The bar graph given below shows the marks of students of a class in a particular subject: Study the bar graph and answer the following questions: (a) If 40 is the pass mark, then how many students have failed? (b) How many students got marks from 50 to 69? (c) How many students scored 90 marks and above? (d) If students who scored marks above 80 are given merits then how many merit holders are there? (e) What is the strength of the class? by Maths experts to help you in doubts & scoring excellent marks in Class 7 exams.
Topper's Solved these Questions
- BOOK - NCERT EXEMPLARCHAPTER - DATA HANDLINGEXERCISE - THINK AND DISCUSS3videos
DATA HANDLING
- BOOK - NCERT EXEMPLARCHAPTER - DATA HANDLINGEXERCISE - EXERCISE(TRUE OR FALSE)18videos
DATA HANDLING
- BOOK - NCERT EXEMPLARCHAPTER - COMPARING QUANTITIESEXERCISE - THINK AND DISCUSS24videos
COMPARING QUANTITIES
- BOOK - NCERT EXEMPLARCHAPTER - EXPONENTS AND POWERSEXERCISE - EXERCISE136videos
EXPONENTS AND POWERS
Similar Questions
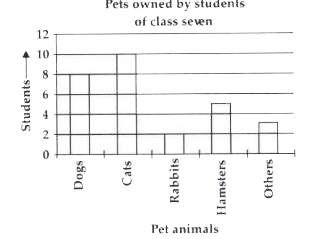
Use the bar graph to answer the following questions
How many students have dog as a pet ?
 View Solution
The sub-divided bar diagram given below depicts the result of B.Com. Students of a college for 3 years. Study the graph and answer the given questions.
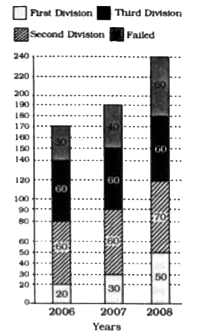
How many percent of students passed in first division in 2007?View Solution
Knowledge Check
- Question 1 - Select One
Study the following histogram of marks in mathematics (out of 50) of students in a class and answer the following questions.
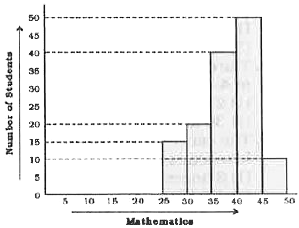
If the pass marks in maths is 31, the number of students who failed in maths is :A10B15C20D0.25 - Question 2 - Select One
The bar graph shows average marks scored in a 100 mark Science exam by students of 7 divisions of Standard X. Study the diagram and answer the following questions.
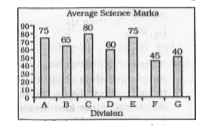
Marks of division F were lesser than that of Division C byA35%B47.25%C45%D43.75% - Question 3 - Select One
The histogram shows the marks obtained by 45 students of a class. Look at the histogram and answer the questions.
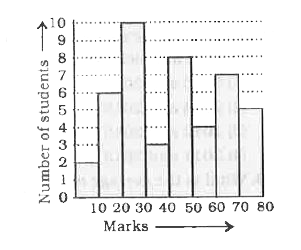
How many students have obtained marks less than 10 ?A2B10C1D4
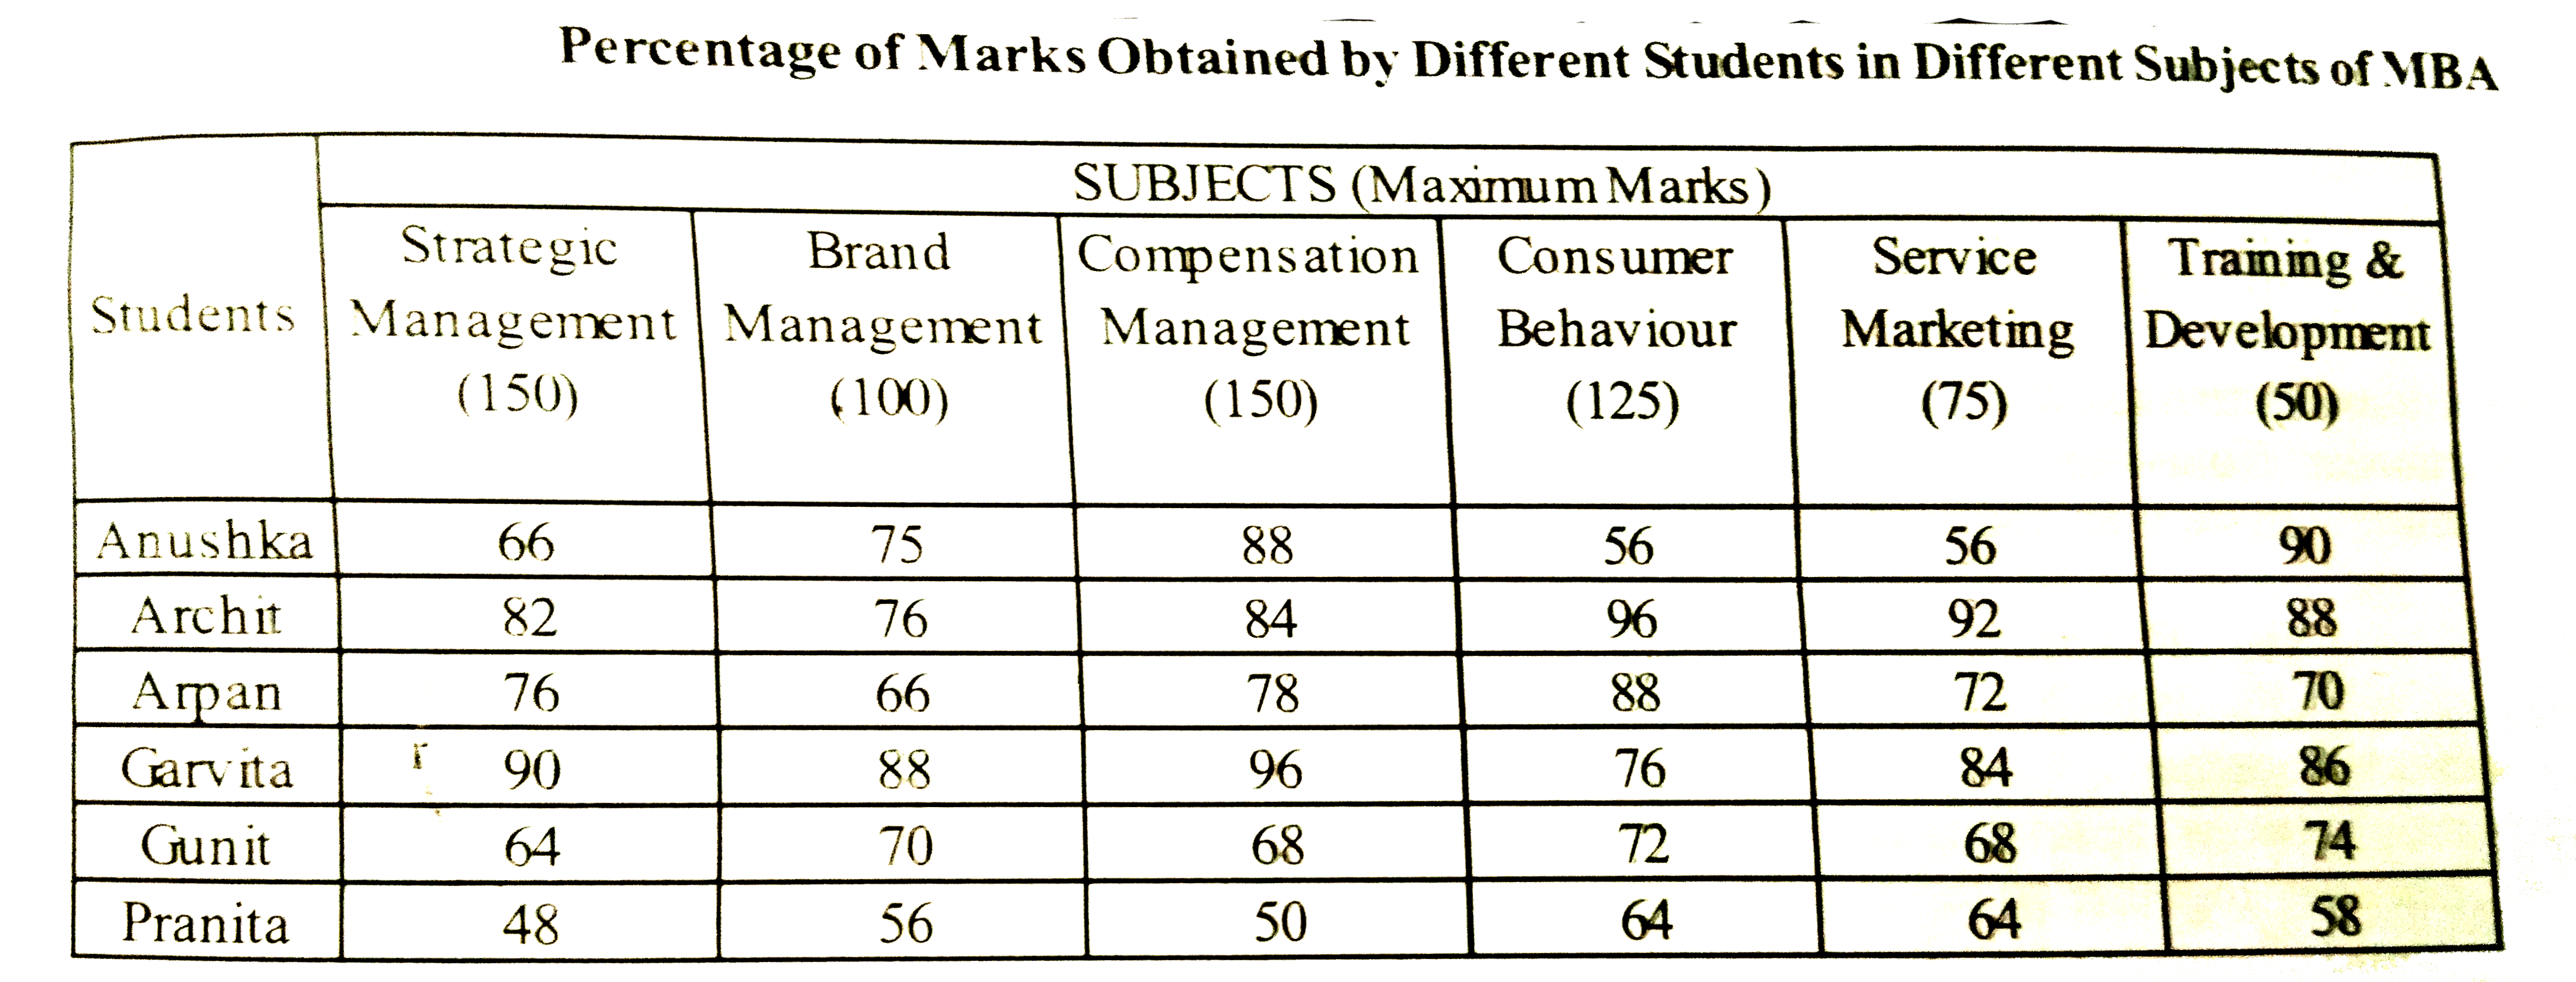
How many students have scored the highest marks in more than one subject ?View SolutionThe bar graph shows average marks scored in a 100 marks History exam by students of 7 divisions of Standard x. Study the diagram and answer the following questions.
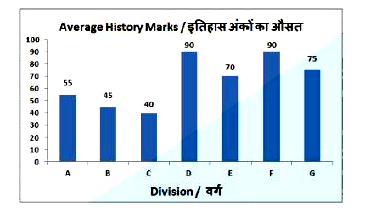
Which division scored the second lowest marks ?View SolutionThe table given below shows the marks obtained by 6 students in 3 subjects.
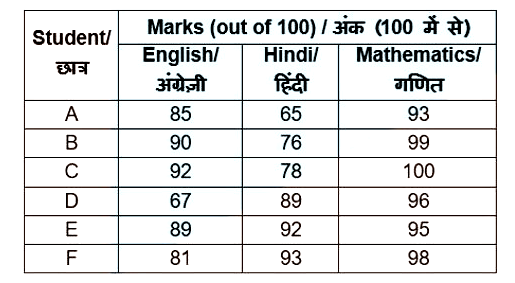
What are the average marks per students in Mathematics?View SolutionRead the adjoining bar graph showing the number ofstudents in a particular class of a school. Answer thefollowing questions :(a) What is the scale of this graph?(b) How many new students are added every year?(c) Is the number of students in the year 2003 twice that in the year 2000?
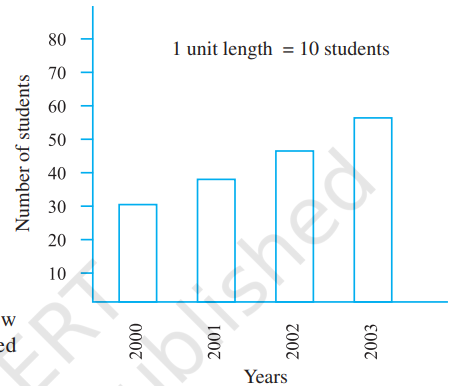 View Solution
The bar graph shows average marks scored in a 100 mark English exam by students of 7 divisions of standard X. Study the diagram and answer the following questions.
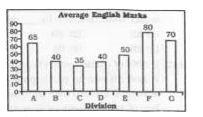
Which division scored the second highest average marks?View Solution

