The birth rate per thousand in five countries over a period of time is shown below:

Represent the above data by a bar graph.
Step by step video & image solution for The birth rate per thousand in five countries over a period of time is shown below: Represent the above data by a bar graph. by Maths experts to help you in doubts & scoring excellent marks in Class 9 exams.
Updated on:21/07/2023Topper's Solved these Questions
- BAR GRAPH, HISTOGRAM AND FREQUENCY POLYGONBOOK - RS AGGARWALCHAPTER - BAR GRAPH, HISTOGRAM AND FREQUENCY POLYGONEXERCISE - EXERCISE 17B
16 Videos
- BAR GRAPH, HISTOGRAM AND FREQUENCY POLYGONBOOK - RS AGGARWALCHAPTER - BAR GRAPH, HISTOGRAM AND FREQUENCY POLYGONEXERCISE - EXAMPLE
11 Videos
- AREAS OF TRIANGLES AND QUADRILATERALSBOOK - RS AGGARWALCHAPTER - AREAS OF TRIANGLES AND QUADRILATERALSEXERCISE - Multiple Choice Questions (Mcq)
16 Videos
- CIRCLES BOOK - RS AGGARWALCHAPTER - CIRCLES EXERCISE - MULTIPLE CHOICE QUESTION(MCQ)
37 Videos
Similar Questions
The birth rate per thousand of five countries over a period of time is shown below.

Country with the highest and lowest birth respectively is:
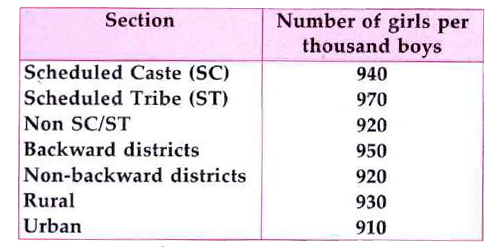
View SolutionThe following data on the number of girls (to the nearest ten) per thousand boys in different sections of Indian society is given below

Represent the information above by a bar graph.
View Solution
Knowledge Check
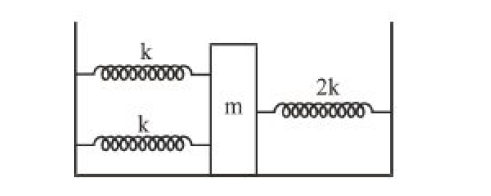
The time period of system shown below is :-
 A2π√m3kB2π√2mkC2π√m4kD2π√mk
Displays data that changes continuously over periods of time
Abar graphBpie graphChistogramDline graphWhich of the graphs shown below represent the motion with uniform speed?
A B
B C
C D
D
The following table shows the number of fruits in a fruit shop. Represent the above data by a bar graph
View SolutionIn a school, there are five sections of Class VI. The number of students in each section is given below:

Represent the above data using a bar graph.
View SolutionA graph that displays data that changes continuously over periods of time is
View SolutionThe runs scored by a cricket team in first 10 overs are given below:

Draw a line graph representing the above data.
View Solution. The following data shows the year wise strength of a school.Represent the the above data by bar graph:
View Solution
