The data given below shows the production of motor bikes in a factory for some months of two consecutive years.

Study the table given above and answer the following questions:
(a) Draw a double bar graph using appropriate scale to depict the above information and compare them.
(b) In which year was the total output the maximum?
(c) Find the mean production for the year 2007.
(d) For which month was the difference between the production for the two years the maximum?
(e) In which month for the year 2008, the production was the maximum?
(l) In which month for the year 2007, the production was the least?
Step by step video & image solution for The data given below shows the production of motor bikes in a factory for some months of two consecutive years. Study the table given above and answer the following questions: (a) Draw a double bar graph using appropriate scale to depict the above information and compare them. (b) In which year was the total output the maximum? (c) Find the mean production for the year 2007. (d) For which month was the difference between the production for the two years the maximum? (e) In which month for the year 2008, the production was the maximum? (l) In which month for the year 2007, the production was the least? by Maths experts to help you in doubts & scoring excellent marks in Class 7 exams.
Topper's Solved these Questions
- BOOK - NCERT EXEMPLARCHAPTER - DATA HANDLINGEXERCISE - THINK AND DISCUSS3videos
DATA HANDLING
- BOOK - NCERT EXEMPLARCHAPTER - DATA HANDLINGEXERCISE - EXERCISE(TRUE OR FALSE)18videos
DATA HANDLING
- BOOK - NCERT EXEMPLARCHAPTER - COMPARING QUANTITIESEXERCISE - THINK AND DISCUSS24videos
COMPARING QUANTITIES
- BOOK - NCERT EXEMPLARCHAPTER - EXPONENTS AND POWERSEXERCISE - EXERCISE136videos
EXPONENTS AND POWERS
Similar Questions
The table below compares the population (in hundreds) of 4 towns over two years:

Study the table and answer the following questions:
(a) Draw a double bar graph using appropriate scale to depict the above information.
(b) In which town was the population growth maximum?
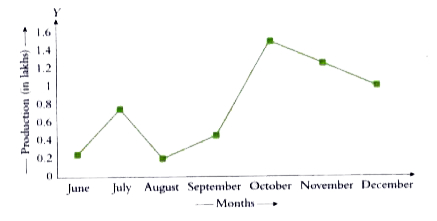
(c) In which town was the population growth least?View SolutionThe line graph given below shows the production of a particular model of bike produced in different months. Read the line graph and answer the following questions:
In which month is the production least?
 View Solution
Knowledge Check
- Question 1 - Select One
Study the bar chart given below and answer the following questions :
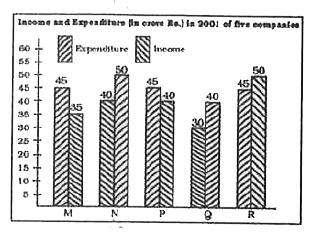
The company earning the maximum percentage of profit in the year 2001 is :AQBMCNDP - Question 2 - Select One
The bar diagram given below shows the productions (in the unit of thousand pieces) of three types of biscuits by a company in the five consecutive years. Study the diagram and answer the following questions.
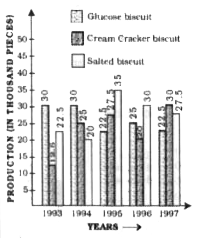
The production of all the three types of biscuits was maximum in the yearA1995B1994C1996D1993 - Question 3 - Select One
The bar diagram given below shows the productions (in the unit of thousand pieces) of three types of biscuits by a company in the five consecutive years. Study the diagram and answer the following questions.
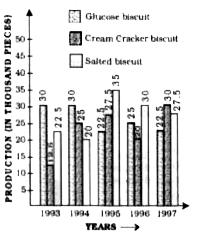
Total production of all the three types of biscuits was the least in the yearA1993B1997C1996D1995
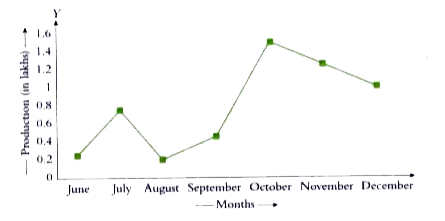
The line graph given below shows the production of a particular model of bike produced in different months. Read the line graph and answer the following questions:
In which month is the production maximum?
 View Solution
Read the bar graph given below and answer the following questions:
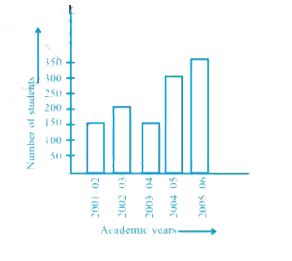
In which year is the number of students maximum?View SolutionThe table below gives the data of tourists visiting 5 hill stations over two consecutive years. Study the table and answer the questions that follow:

(a) Draw a double bar graph to depict the above information using appropriate scale.
(b) Which hill station was visited by the maximum number of tourists in 2008?
(c) Which hill station was visited by the least number of tourists in 2009?
(d) In which hill stations was there increase in number of tourists in the year 2009?View SolutionRead the bar graph given below and answer the following questions:
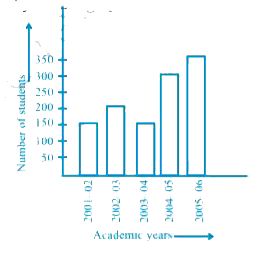
In which year did the number of students decrease as compared to previous year?View SolutionStudy the bar graph given below and answer the questions that follow.
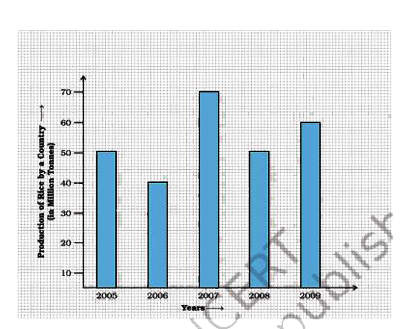
(a) What information does the above bar graph represent?
(b) In which year was production the least?
(c) After which year was the maximum rise in the production?
(d) Find the average production of rice during the 5 years.
(e) Find difference of rice production between years 2006 and 2008.View Solution

