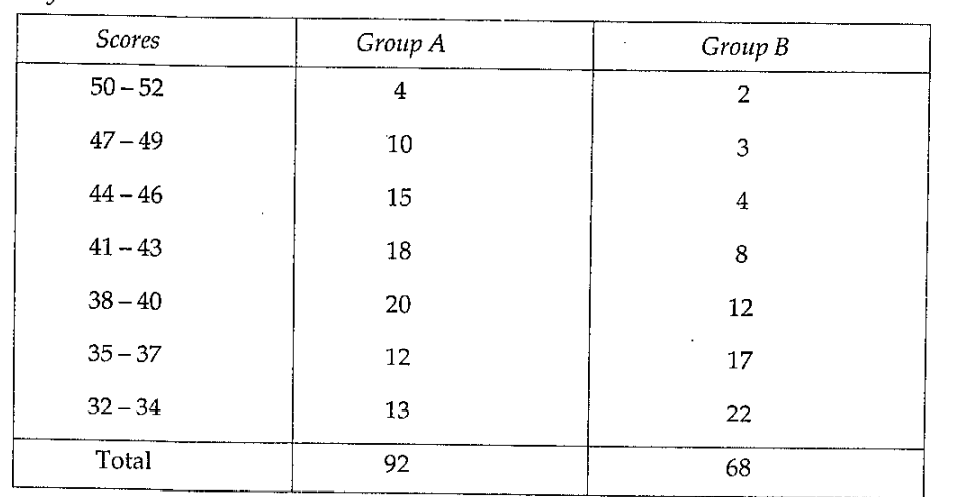
The
following are the scores of two groups of class IV students in a test of
reading ability.

Construct a
frequency polygon for each of these two groups on the same exes.
Topper's Solved these Questions
Similar Questions
Knowledge Check
The average of the test scores of a group of x students is 76 and the average of the test scores of a group of y students is 90. When the scores of the two groups of students are combined, the average test score is 85. What is the value of of xy?
A47B59C23D74
The following are the scores of two groups of class IV students in a test of reading ability. Scores Group A Group B 50-52 47-49 44-46 41-43 38-40 35-37 32-34 4 10 15 18 20 12 13 2 3 4 8 12 17 22 Total 92 68 Construct a frequency polygon for each of these two groups on the same axes.
View SolutionDraw a frequency polygon for the following grouped frequency distrbution table.

View SolutionDraw a frequency polygon for the following grouped frequency distribution table :

View SolutionThe frequency distribution of marks obtained by students in a class test is given below .
Draw frequency polygon and ogive.

View SolutionThe following table gives the distribution of students of two sections according to the marks obtained by them. Represent the marks of the students of botht the sections on the same graph by two frequency polygon. From the two polygons compare the performance of the two sections.
View SolutionThe following table gives the distribution of students of two sections according to the marks obtained by them

Represent the marks of the students of both the sections on the same graph by two frquency polygons. From the two polygons compare the performance of the two sections.
View SolutionThe following table gives the distribution of students of two sections according to the marks obtained by them

Represent the marks of the students of both the sections on the same graph by two frquency polygons. From the two polygons compare the performance of the two sections.
View Solution
