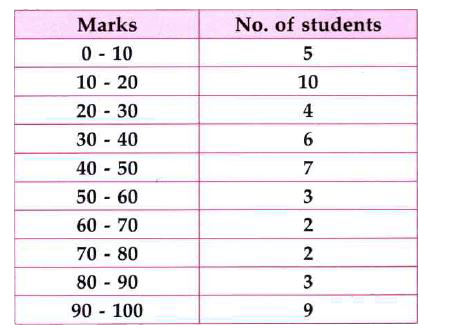
The
following is the distribution of total household expenditure (in Rs.) of
manual worker in a city:

Draw a
histogram and a frequency polygon representing the above data.
Topper's Solved these Questions
Similar Questions
Draw a frequency polygon to represent the following data.

View SolutionFor the following data, draw a histogram and a frequency polygon

View SolutionDraw a histogram and frequency polygon from the following data:

View SolutionDraw the frequency polygon to represent the following data.

View SolutionPrepare histogram and frequency polygon from the following data :

View SolutionThe following data gives the distribution of total household expenditure (in rupees) of manual workers in a city: Expenditure (Rs.) Frequency Expenditure ( Rs.) Frequency 1000-1500 24 3000-3500 30 1500-2000 40 3500-4000 22 2000-2500 33 4000-4500 16 2500-3000 28 4500-5000 7 Find the average expenditure which is being done by the maximum number of manual workers.
View SolutionDraw histogram and frequency polygon for the following distribution :

View SolutionDraw a frequency polygon from the following data:

View SolutionThe following data gives the distribution of total household expendilture ( in Rs.) of workers is a city :

Find the average expenditure which is being done by maximum number of manual workers.
View SolutionThe following data gives the distribution of total household expendilture ( in Rs.) of workers is a city :

Find the average expenditure which is being done by maximum number of manual workers.
View Solution
