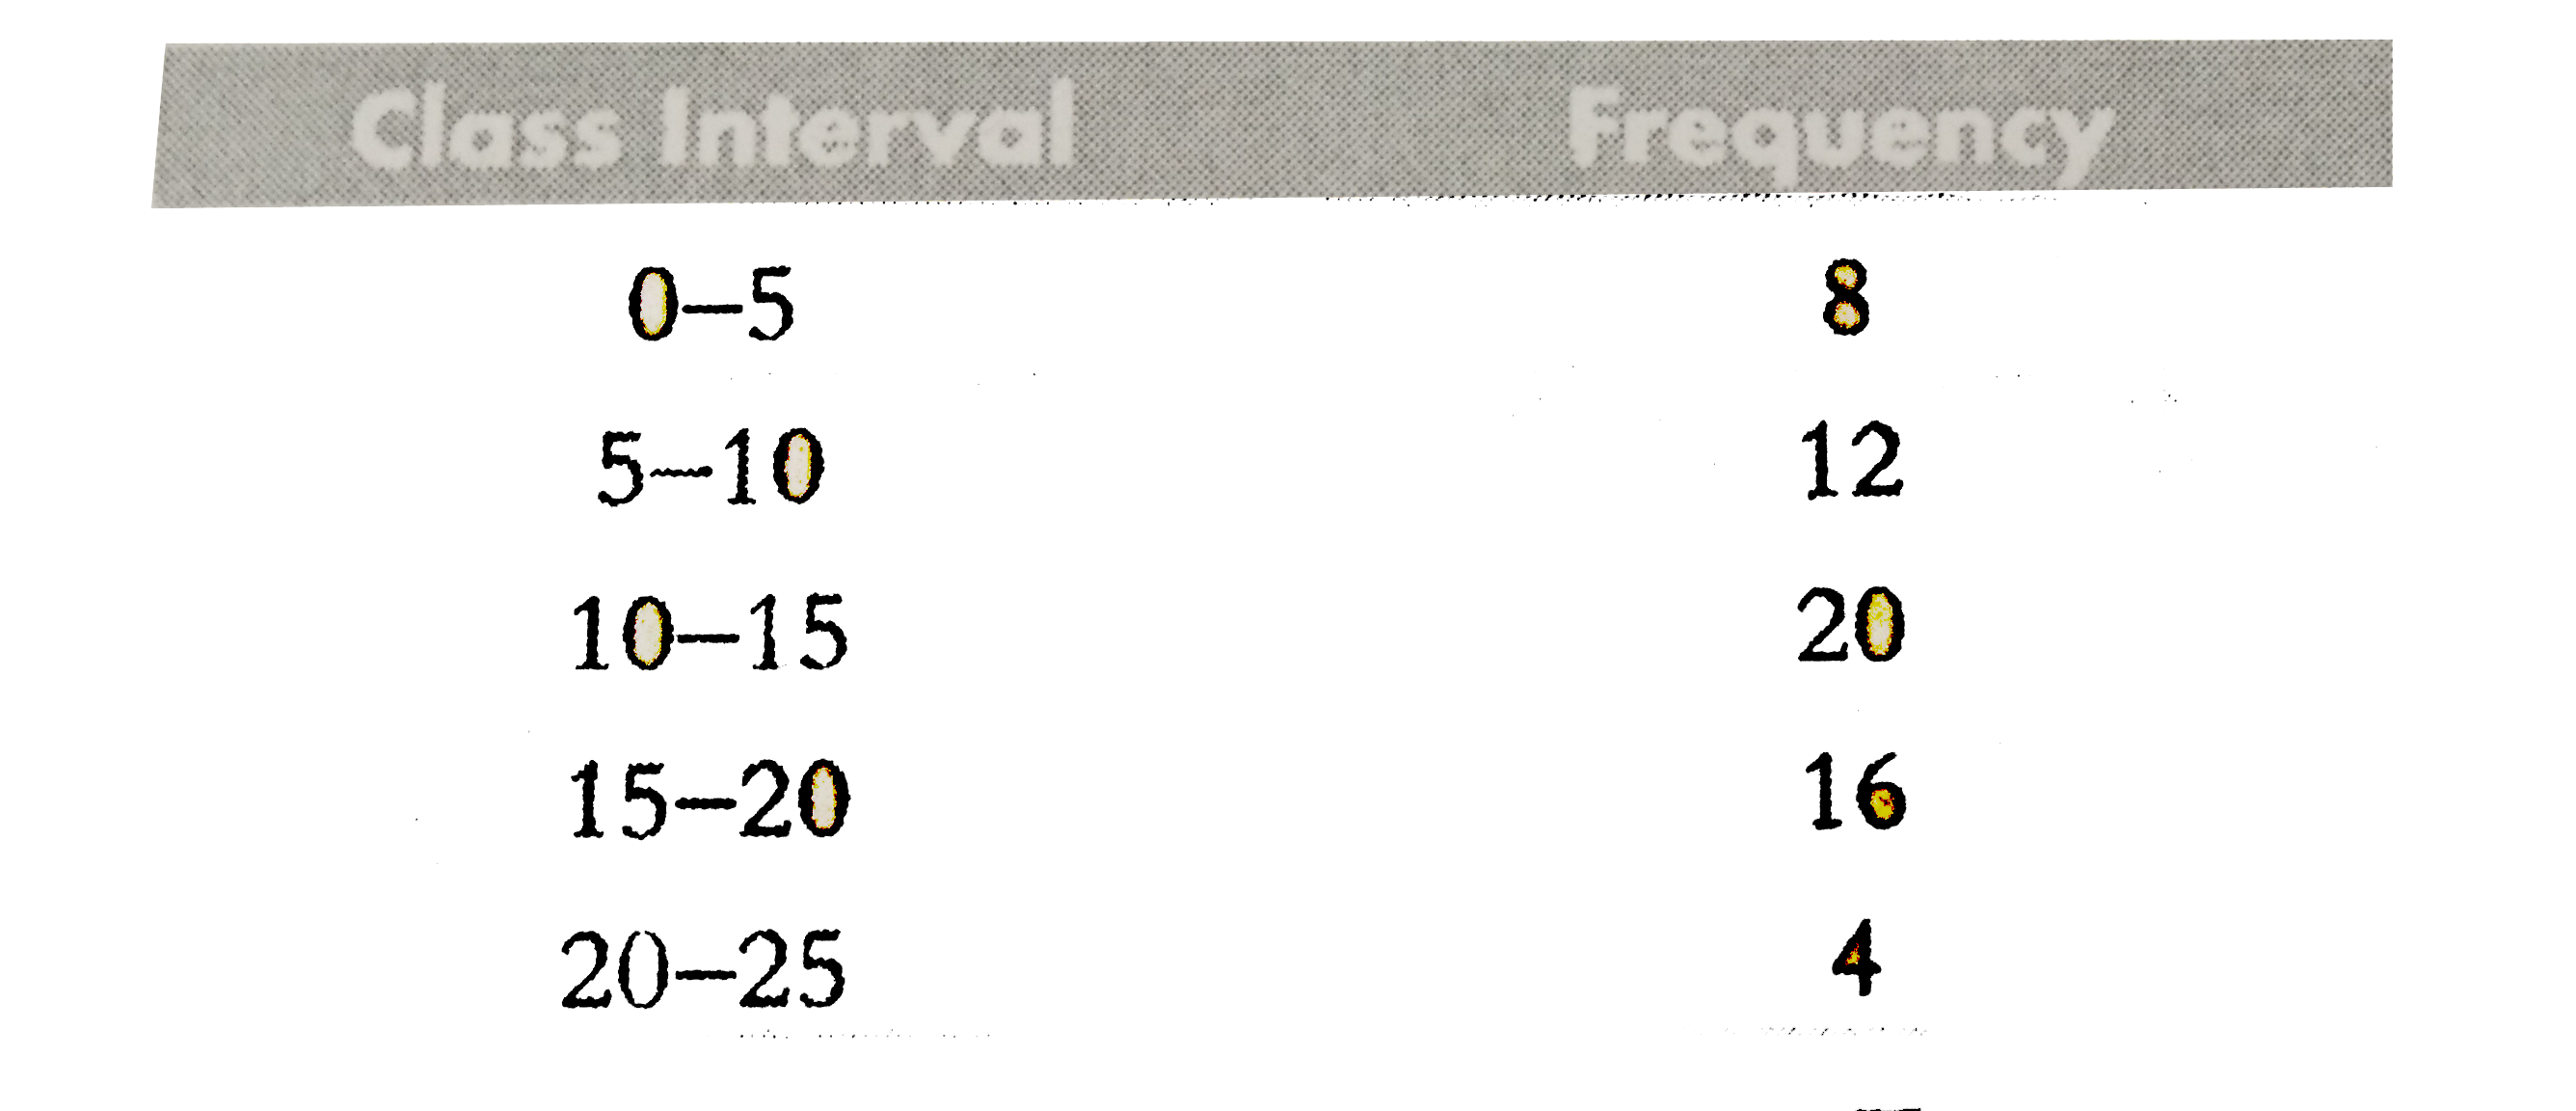
The
following table gives the distribution of IQ’s (intelligency
quotients) of 60 pupils of class V in a school:

Draw a
frequency polygon for the above data.
To draw the frequency polygon of the given data without using histogram, obtain the class-limits of the class intervals.

Topper's Solved these Questions
Similar Questions
Draw a frequency polygon from the following data:

View SolutionDraw a frequency polygon to represent the following data.

View SolutionDraw a histogram and frequency polygon from the following data:

View SolutionDraw the frequency polygon to represent the following data.

View SolutionThe following table shows the distribution of weights of seeds. Draw a frequency polygon.

View SolutionDraw the frequency polygon for the following distribution :

View SolutionDraw histogram and frequency polygon for the following distribution :

View SolutionDraw a frequency polygon for the following frequency distribution.

View SolutionThe daily pocket expenses of 206 students in a school are given below.

Construct a frequency polygon representing the above data.
View SolutionThe daily pocket expenses of 206 students in a school are given below.

Construct a frequency polygon representing the above data.
View Solution
