The following table gives the marks scored by
100 students in an entrance examination.

Step by step video & image solution for The following table gives the marks scored by 100 students in an entrance examination. by Maths experts to help you in doubts & scoring excellent marks in Class 8 exams.
Updated on:21/07/2023Topper's Solved these Questions
- DATA HANDLING-I (CLASSIFICATION AND TABULATION DATA)BOOK - RD SHARMACHAPTER - DATA HANDLING-I (CLASSIFICATION AND TABULATION DATA)EXERCISE - All Questions
27 Videos
- DATA HANDLING-III (PIE CHARTS OR CIRCLE GRAPHS)BOOK - RD SHARMACHAPTER - DATA HANDLING-III (PIE CHARTS OR CIRCLE GRAPHS)EXERCISE - All Questions
32 Videos
Similar Questions
Knowledge Check
Find the mode of the following frequency table, which gives the marks scored by 40 students in a test:
 A5B6C3D4
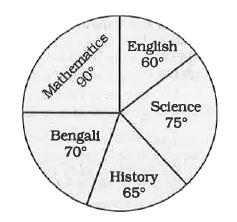
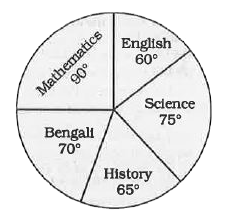
The following pie chart shows the marks obtained by a student in an examination, who scored 720 marks in all. Study the diagram and answer the questions given below.

The marks scored in Science areA200B300C75D150The following pie chart shows the marks obtained by a student in an examination, who scored 720 marks in all. Study the diagram and answer the questions given below.

The following pie chart shows the marks obtained by a student in an examination, who scored 720 marks in all. Study the diagram and answer the questions given below.
The marks scored in Mathematics and English together differ from the total marks scored in Bengali, History and Science byA85B61C120D72
The following information gives the marks scored by the students of a class in an examination. Find the mode of the data. Marks1−2021−4041−6061−8081−100Number of Students318233719
View SolutionThe following table given the marks scored by 50 students in a 100 marks test of Mathematics.
Marks0−2020−4040−6060−80No of 31218107students
A student is selected randomly from the class.
Find the probability that the selected student.
View SolutionThe following table given the marks scored by 50 students in a 100 marks test of Mathematics.
Marks0−2020−4040−6060−80No of 31218107students
A student is selected randomly from the class.
Find the probability that selected student has scored 60 or more than 60 marks.
View SolutionThe following table represent marks obtained by 100 students in a test.

Find mean marks of the students.
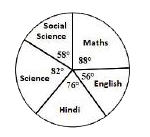
View SolutionThe following pie diagram gives the marks scored by a student in different subjects in an examination. Assuming that the total marks scored by the student in the examination are 540, answer the question below.

The subject in which the student scored 123 marks is:
View Solution


