The following table shows the life expectancy (average age to which people live) in various countries in a particular year. Represent the data by a bar graph.

Step by step video & image solution for The following table shows the life expectancy (average age to which people live) in various countries in a particular year. Represent the data by a bar graph. by Maths experts to help you in doubts & scoring excellent marks in Class 9 exams.
Updated on:21/07/2023Topper's Solved these Questions
- BAR GRAPH, HISTOGRAM AND FREQUENCY POLYGONBOOK - RS AGGARWALCHAPTER - BAR GRAPH, HISTOGRAM AND FREQUENCY POLYGONEXERCISE - EXERCISE 17B
16 Videos
- BAR GRAPH, HISTOGRAM AND FREQUENCY POLYGONBOOK - RS AGGARWALCHAPTER - BAR GRAPH, HISTOGRAM AND FREQUENCY POLYGONEXERCISE - EXAMPLE
11 Videos
- AREAS OF TRIANGLES AND QUADRILATERALSBOOK - RS AGGARWALCHAPTER - AREAS OF TRIANGLES AND QUADRILATERALSEXERCISE - Multiple Choice Questions (Mcq)
16 Videos
- CIRCLES BOOK - RS AGGARWALCHAPTER - CIRCLES EXERCISE - MULTIPLE CHOICE QUESTION(MCQ)
37 Videos
Similar Questions
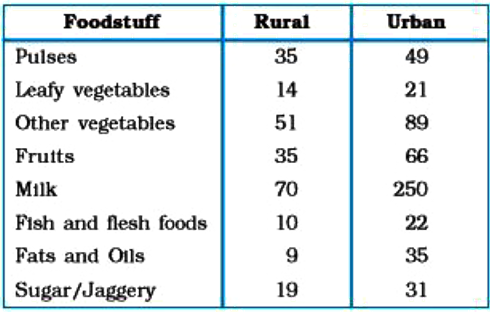
The following table shows the average intake of nutrients in calories by rural and urban groups in a particular year. Using a suitable scale for the given data, draw a double bar graph to compare the data.

View SolutionThe following table shows the number of fruits in a fruit shop. Represent the above data by a bar graph
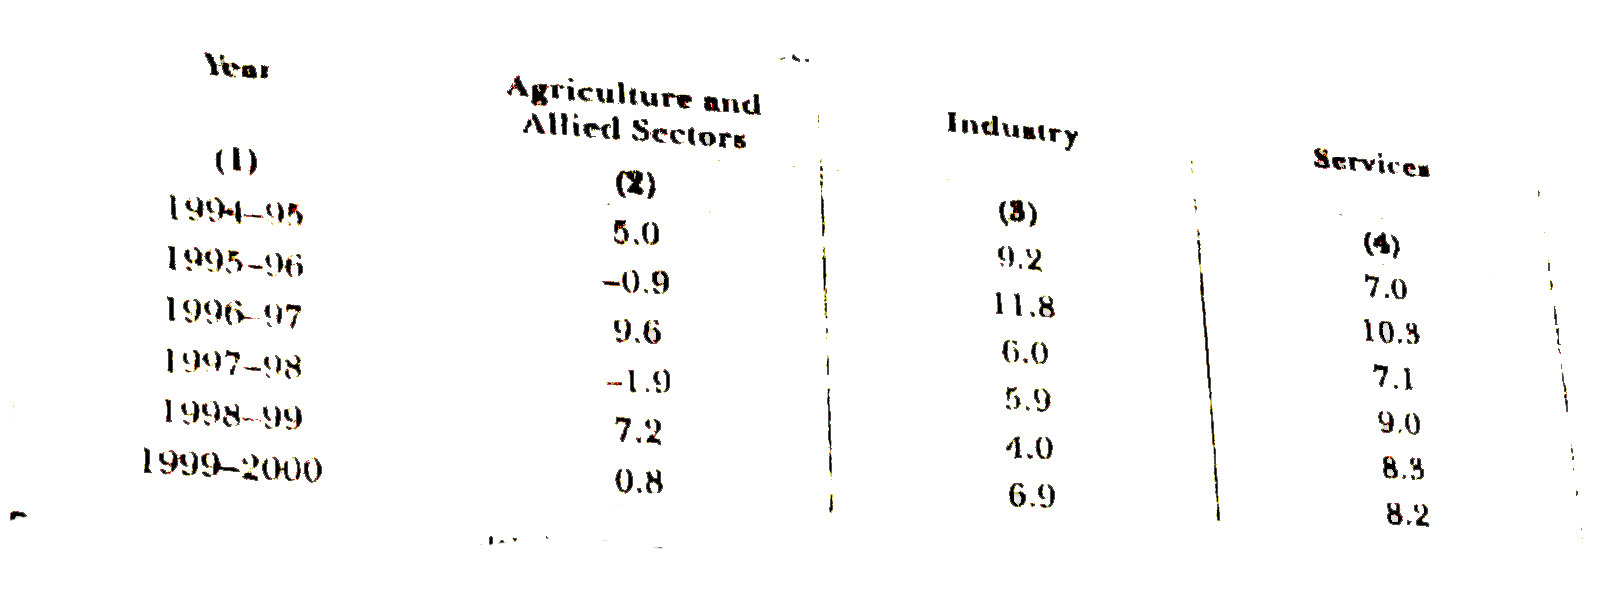
View SolutionThe following table shows the estimated sectoral real growth rates (percentage change over the previous year) in GDP at factor cost.

Represent the data as multiple time series graph.
View SolutionFollowing data gives total marks (out of 600) obtained by six children ofa particular class. Represent the data on a bar graph.
View SolutionThe following data shows the average age of men in varicus countries in a certain year: Country, India, Nepal, China, Pakistan, U.K., U.S.A Average age (in years), 55, 52, 60, 50, 70, 75 Represent the above information by a bar graph.
View SolutionThe following table shows the number of illitrate persons in the age group (10-58 Years) in a town. Represents the given data by means of a histogram.

View SolutionThe following table shows the monthly expenditure of different families on different items :

Represent the data in the form of a sub-divided bar diagram.
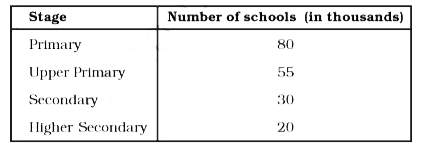
View SolutionThe following table gives the data of number of schools (stage-wise) of a country in the year 2002.

Draw a bar graph to represent the above data:
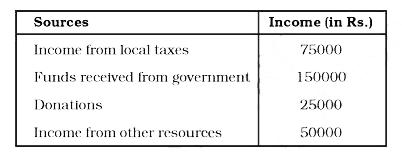
View SolutionThe following table represents income of a Gram Panchayat from different sources in a particular year:

Draw a bar graph to represent the above information
View Solution. The following data shows the year wise strength of a school.Represent the the above data by bar graph:
View Solution
