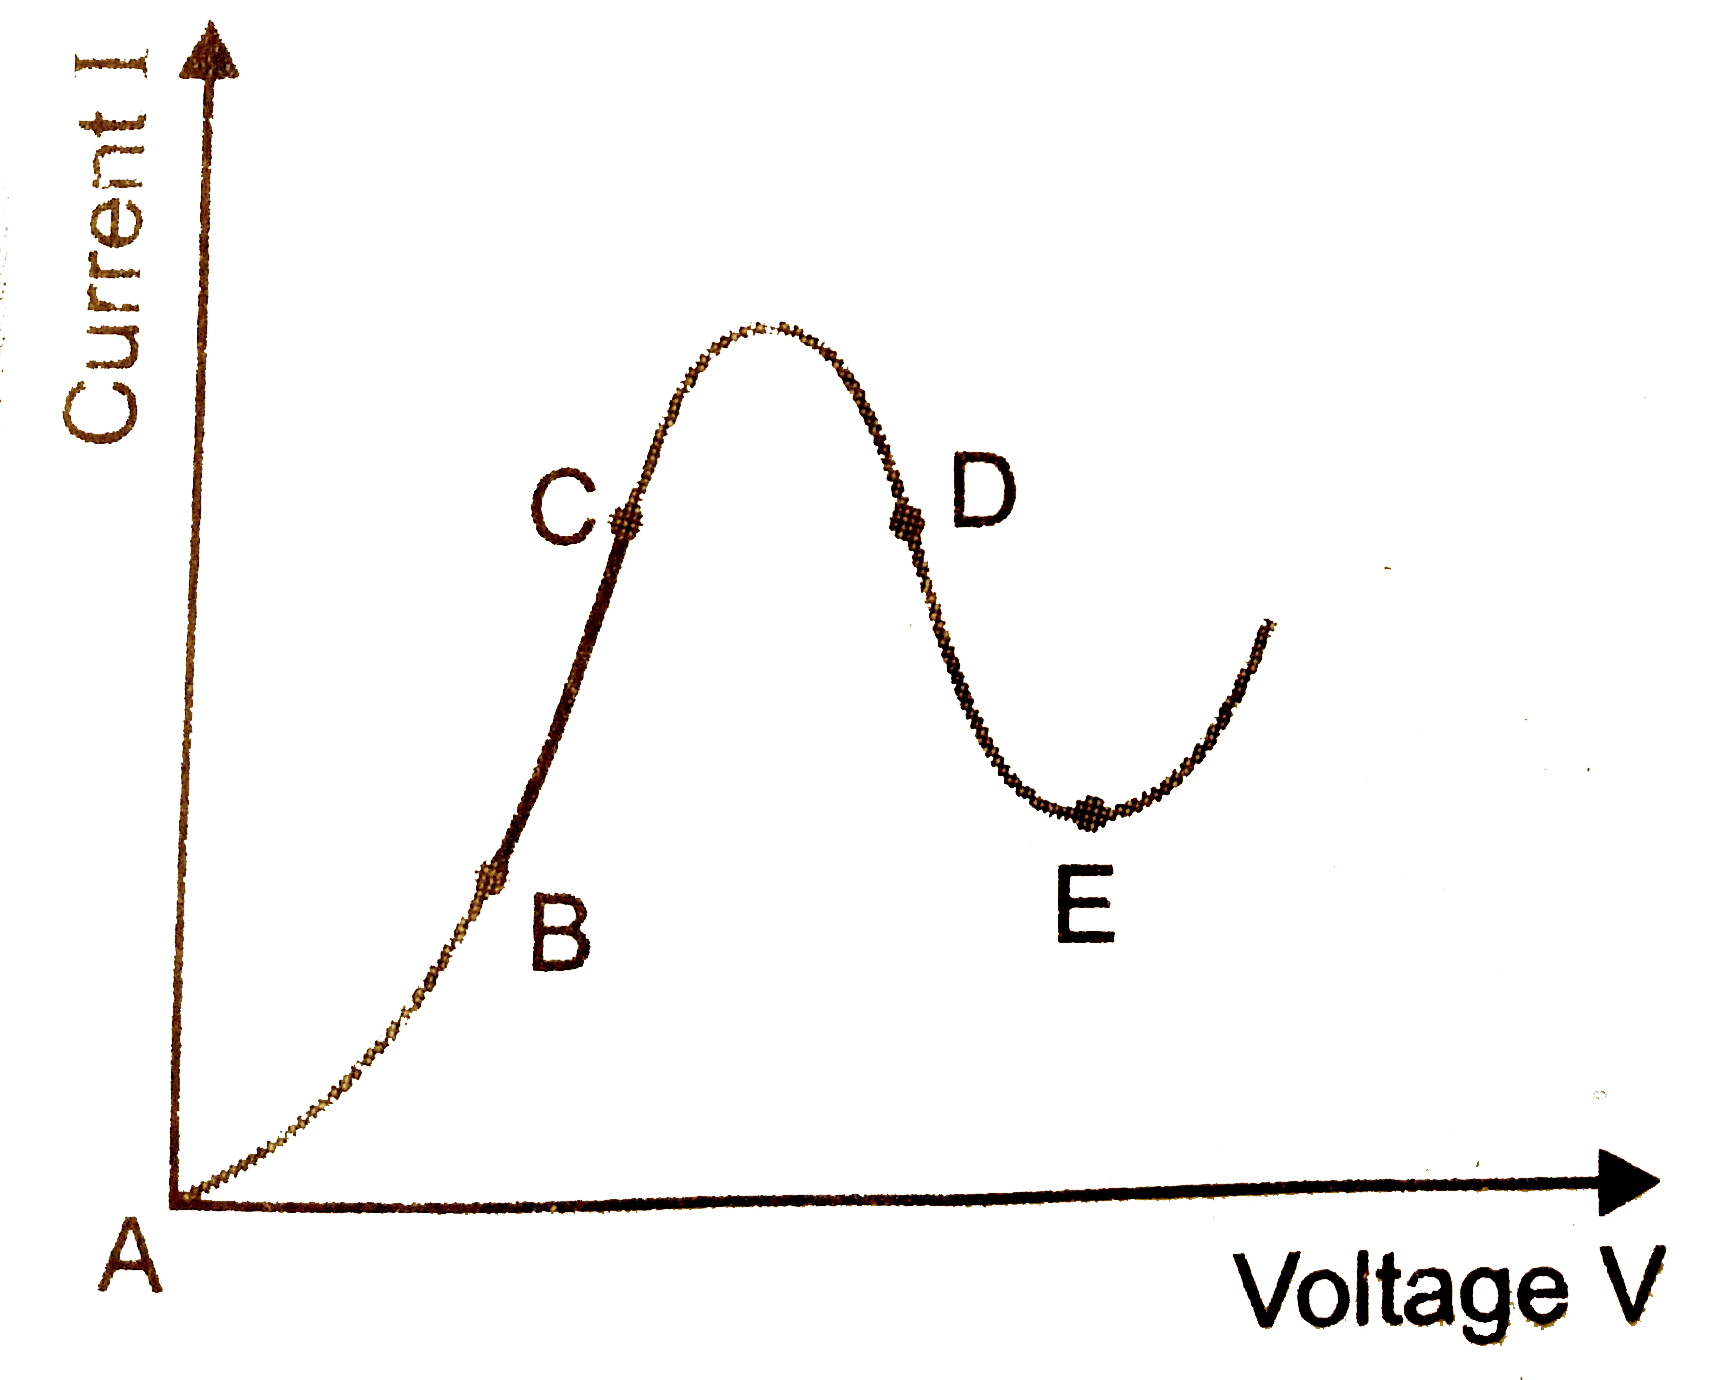
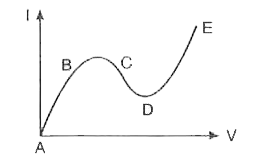
Graph showing the variation of current voltage for a material Ga As is shown figure Identify the region of :i negative resistanceii where Ohms law is obeyed.
In the graph DE shows negative resistance region.In the graph region AB obeys Ohms law
Related Solutions
Graph showing the variation of current versus voltage for a material GaAs is shown in figure. Identify the region of (i) negative resistance (ii) where Ohm's law is obeyed.
View SolutionGraph showing the variation of current versus voltage for a material GaAs is shown in figure. Identify the region of (i) negative resistance (ii) where Ohm's law is obeyed.
View SolutionGraph showing the variation of current versus voltage for a material Ga As (a semiconductor) is shown in the Fig. Identify the region of (i) negative resistance, (ii) where Ohm's law is obeyed.
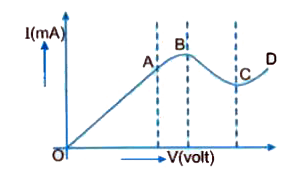
View SolutionShow the variation of current versus voltage graph for GaAs and mark the I Non-liner region (ii) Negative resistance region.
View SolutionPlot a graph showing variation of current versus voltage for the material Ga.
View SolutionPlot a graph showing variation of current versus voltage for the material Ga.
View SolutionThe current-voltage graph of a device is shown in figure. The resistance is negative in region.
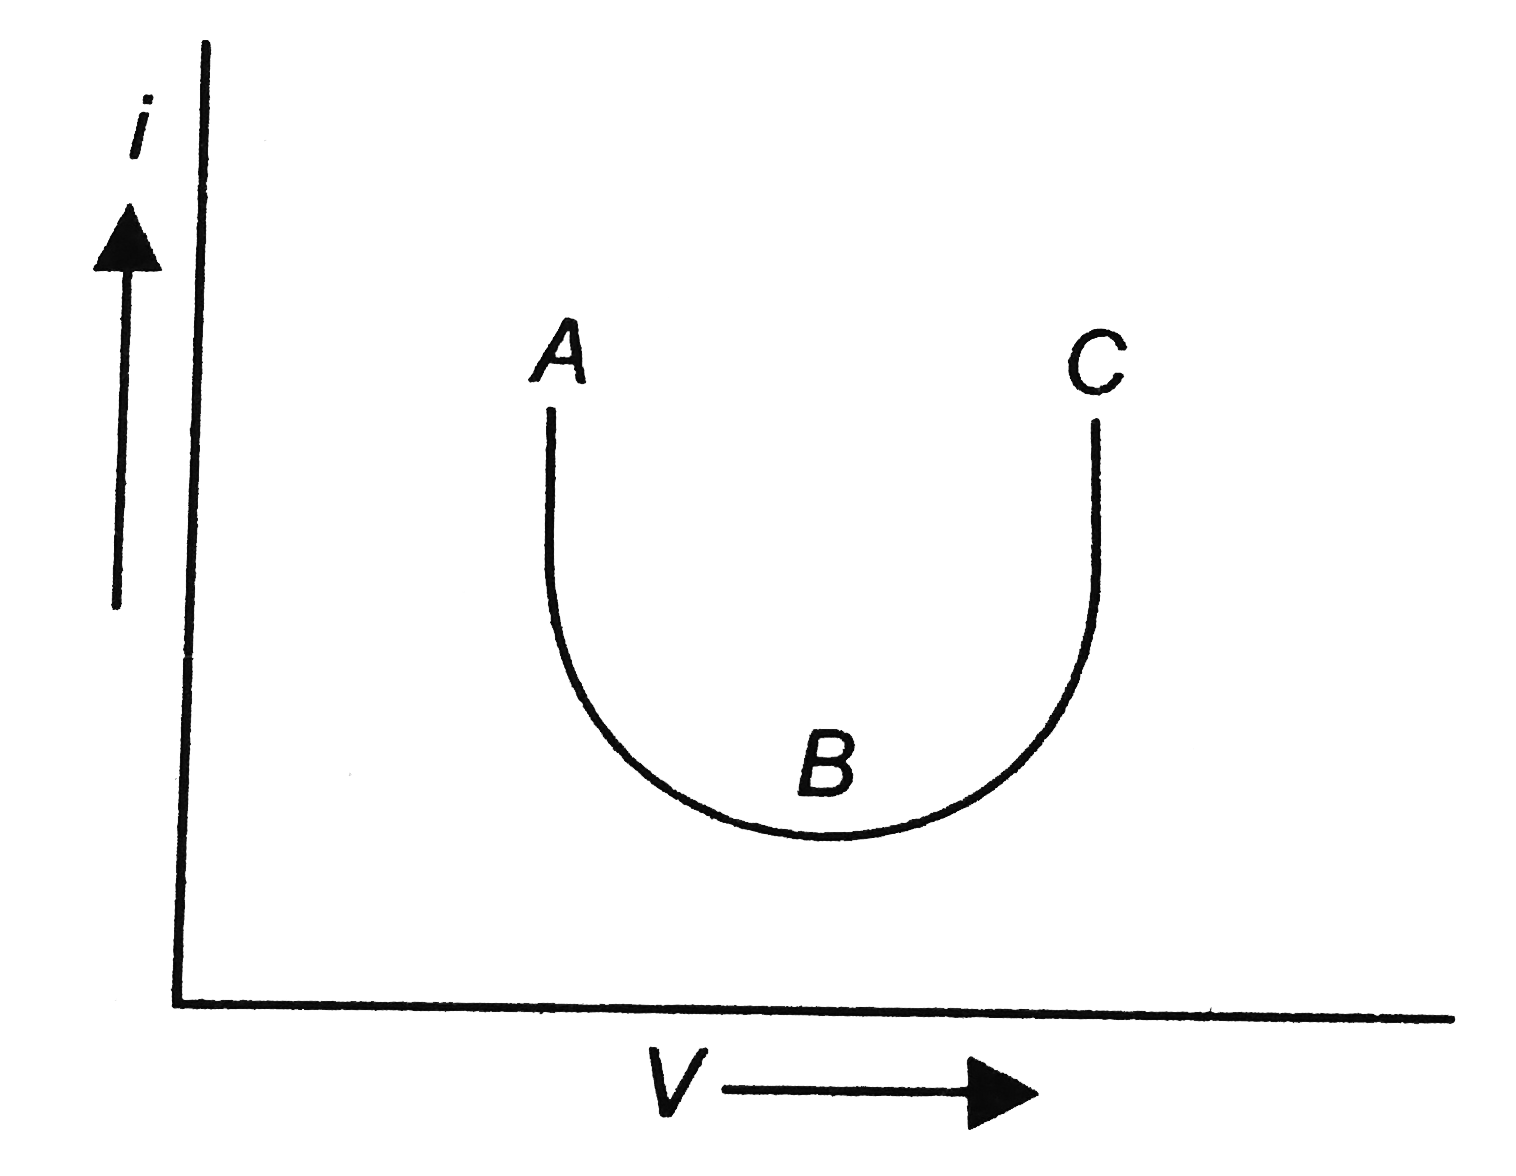
View SolutionThe current-voltage graph of a device is shown in figure. The resistance is negative in region.
View SolutionFrom the graph between current (I) and voltage (V) as shown in the figure, identify the portion correspoindgin to negative resistance

View SolutionPlot a graph showing variation of current versus voltage for the material GaAs
View SolutionThe variation of current (I) and voltage (V) is as shown in figure A . The variation of power P with current I is best shown by which of the following graph
View SolutionThe variation of current and voltage is as shown in figure . The variation of power with current is best shown by which of the following graph
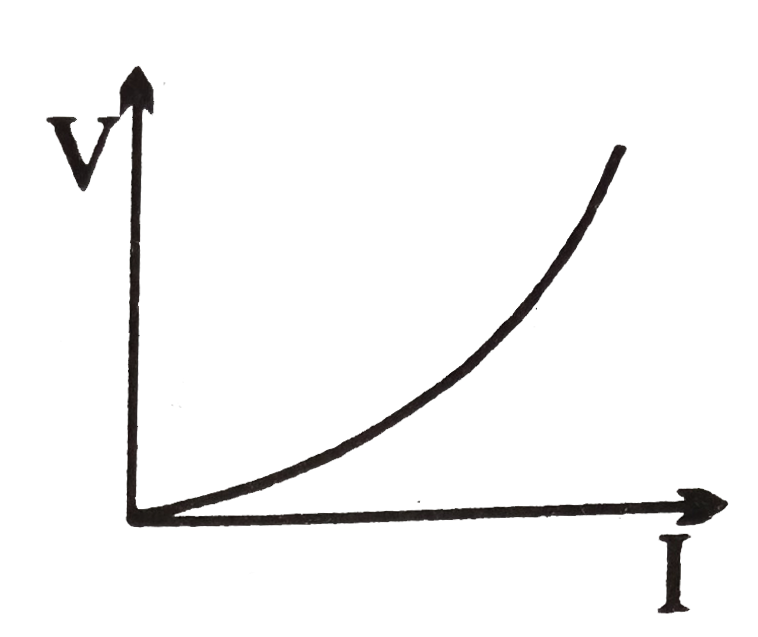
View SolutionDefine Ohm's law? Give the graph for showing the variation of current with voltage for a conductor.
View Solution(a) Draw graph showing the variation of current versus voltage in an electroyte when an external resistance is also connceted.
(b) (i) The graph between resistance (R ) and temperature (T) for Hg is shown in the figure (a). Explain the behaviour of Hg near 4k.
(ii) In which region of the graph shown in the figure (b) is the resistance negative and why?

View SolutionThe graph shown in the figure represents a plot of current versus voltage for a given semi-conductor. Identify the region, if any, over which the semicondutor has a negative resistance.
View SolutionThe variation of current (I) and voltage (V) is as shown in figure. The variation of power P with currnet I is best shown by which of the following graph

View SolutionFrom the graph between current I and voltage V shown below, identify the portion corresponding to negative resistanc
View Solutionचित्र II.1 में दिखाए गये धारा और वोल्टता के बीच ग्राफ में ऋणात्मक प्रतिरोध वाला भाग पहचानें
View Solutionग्राफ उस क्षेत्र में तार की प्रवृत्ति को प्रदर्शित करता है जिसके लिए पदार्थ हूक के नियम का पालन करता है , तब P तथा Q प्रदर्शित करते है

View Solution