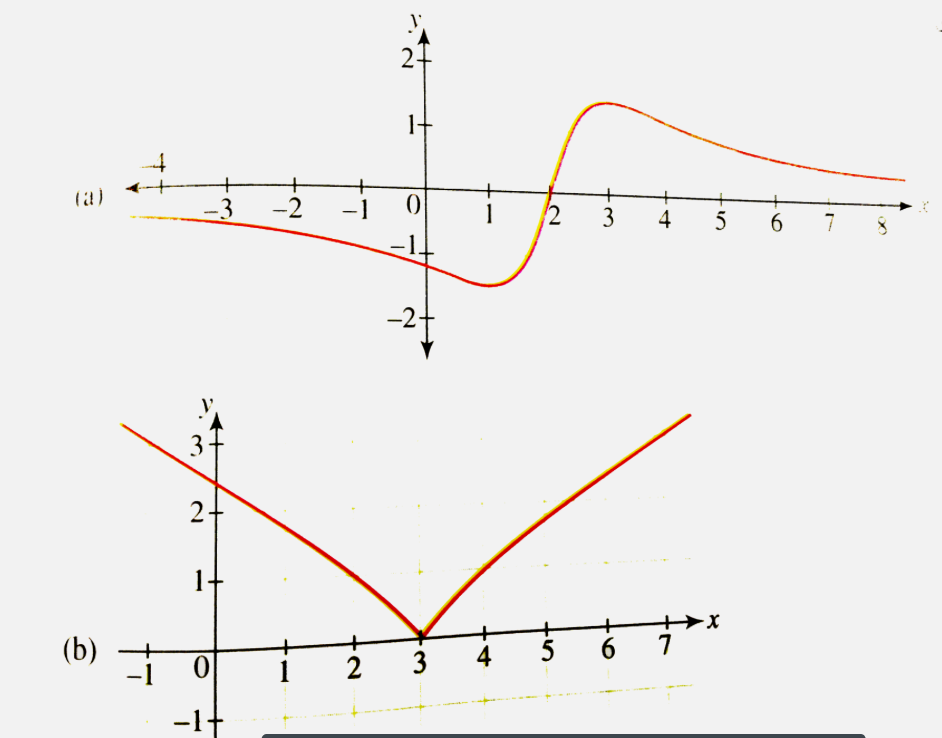
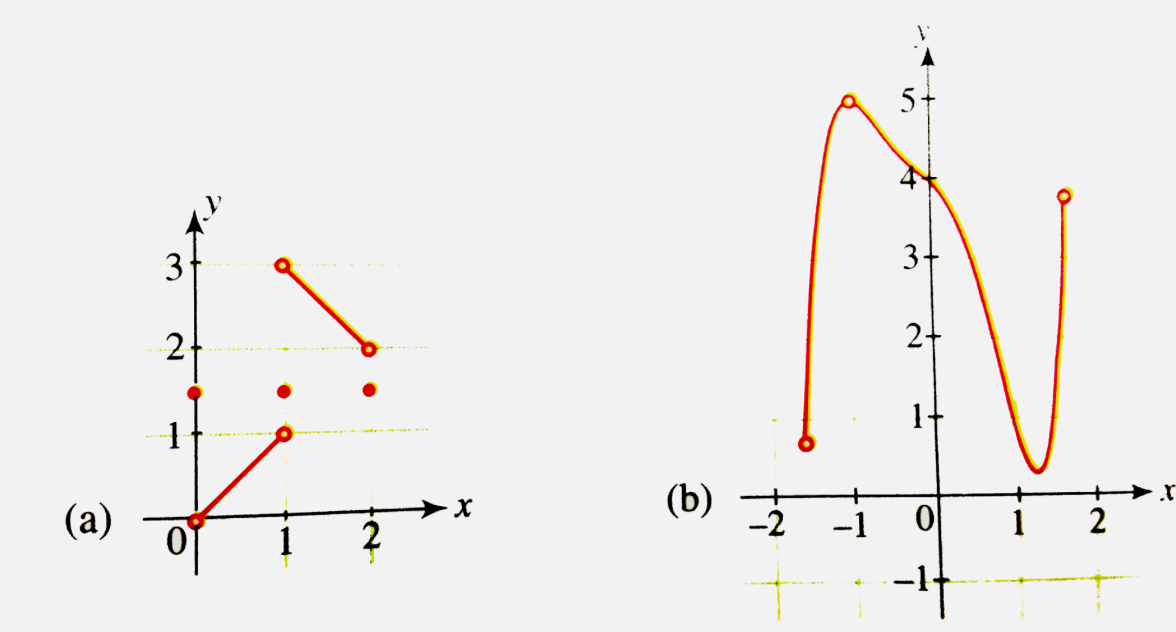
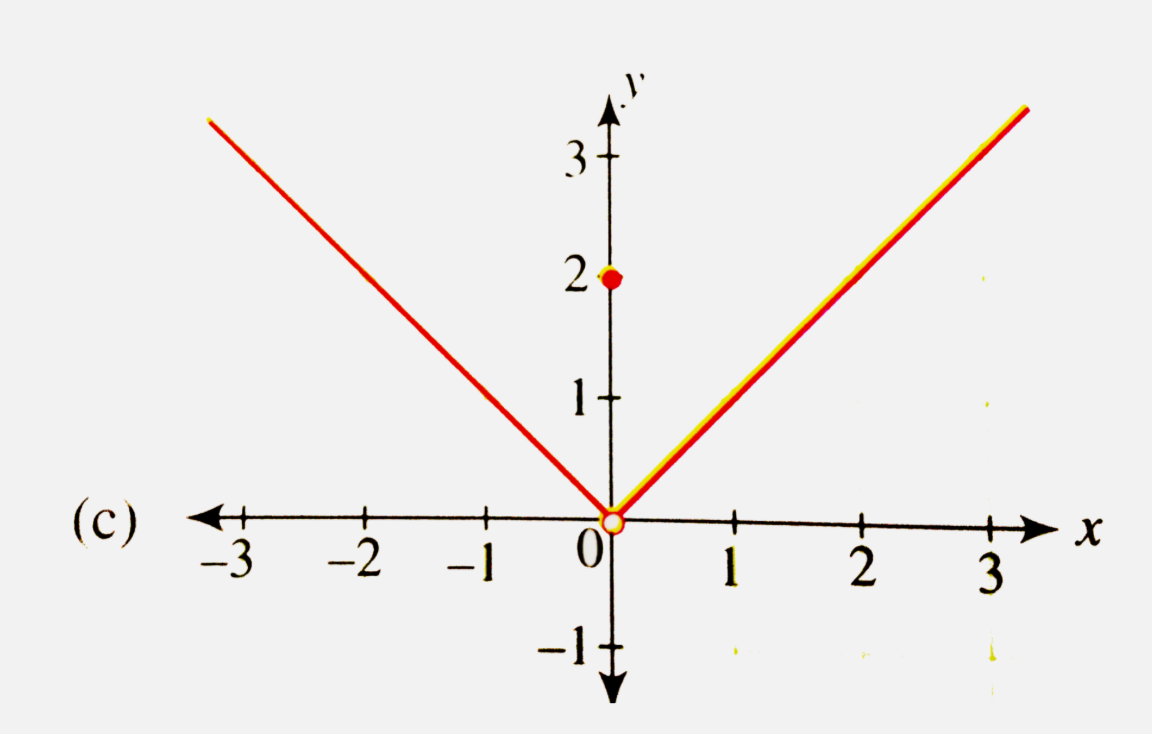
Graph of functions are given in the following figure. Check the functions for absolute extremum.
Text Solution
(a) Function has no absolute minima nor absolute maxima.
(b) Function has absolute minima but no absolute maxima.
(c) Function has local maxima at x = 0 as f(0−h)f(0+h)<f(0)(=2).
|
Topper's Solved these Questions
- GETTING STARTED WITH GRAPHSBOOK - CENGAGECHAPTER - GETTING STARTED WITH GRAPHSEXERCISE - Exercise
18 Videos
- FUNCTIONSBOOK - CENGAGECHAPTER - FUNCTIONSEXERCISE - Question Bank
30 Videos
- GRAPH OF INVERSE TRIGONOMETRIC FUNCTIONSBOOK - CENGAGECHAPTER - GRAPH OF INVERSE TRIGONOMETRIC FUNCTIONSEXERCISE - Exercise
18 Videos
Similar Questions
Knowledge Check
The function represented by the following graph is
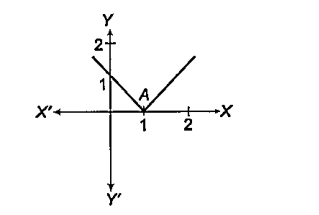 Acontinuous but not differentiable at x=1Bdifferentiable but not continuous at x=1Ccontinuous and differentiable at x=1Dneither continuous nor differentiable at x=1
Which of the following graphs is NOT a function ?
A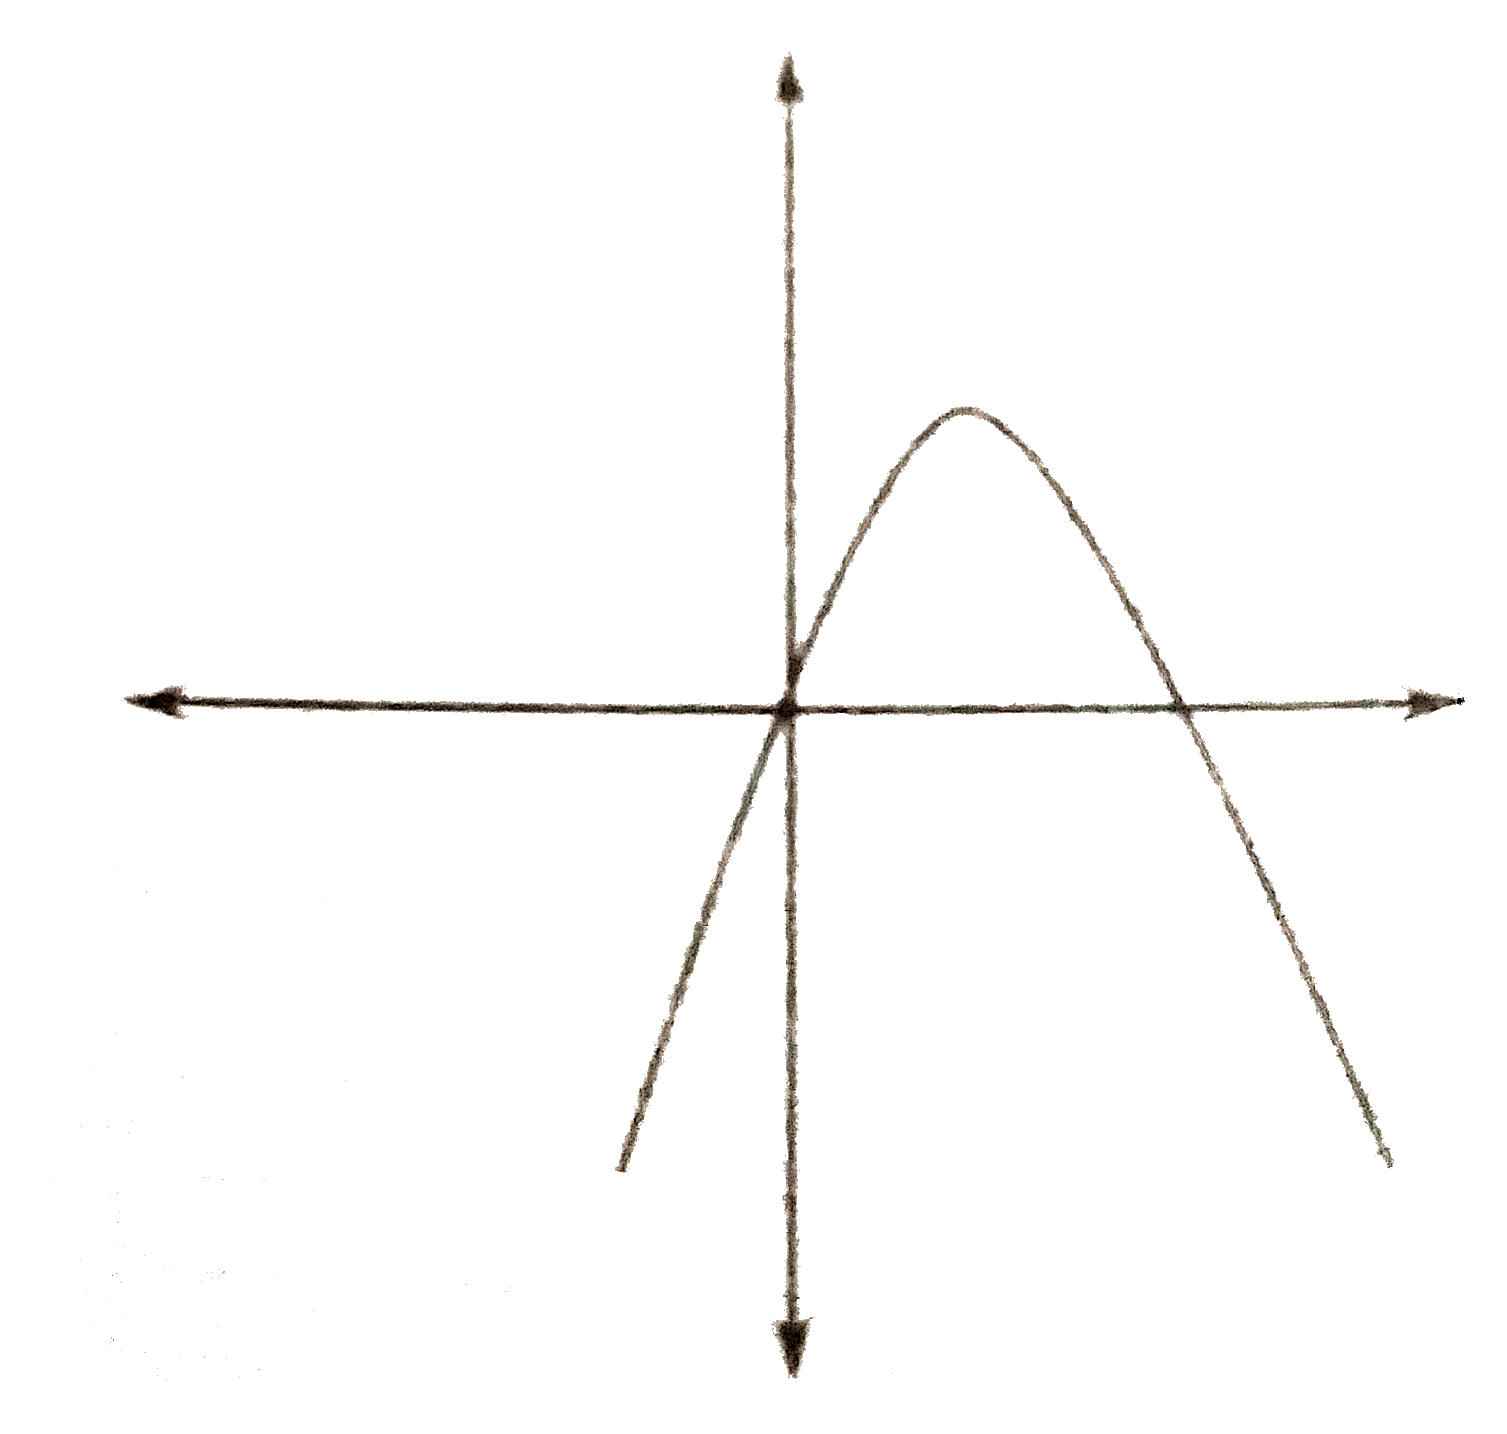 B
B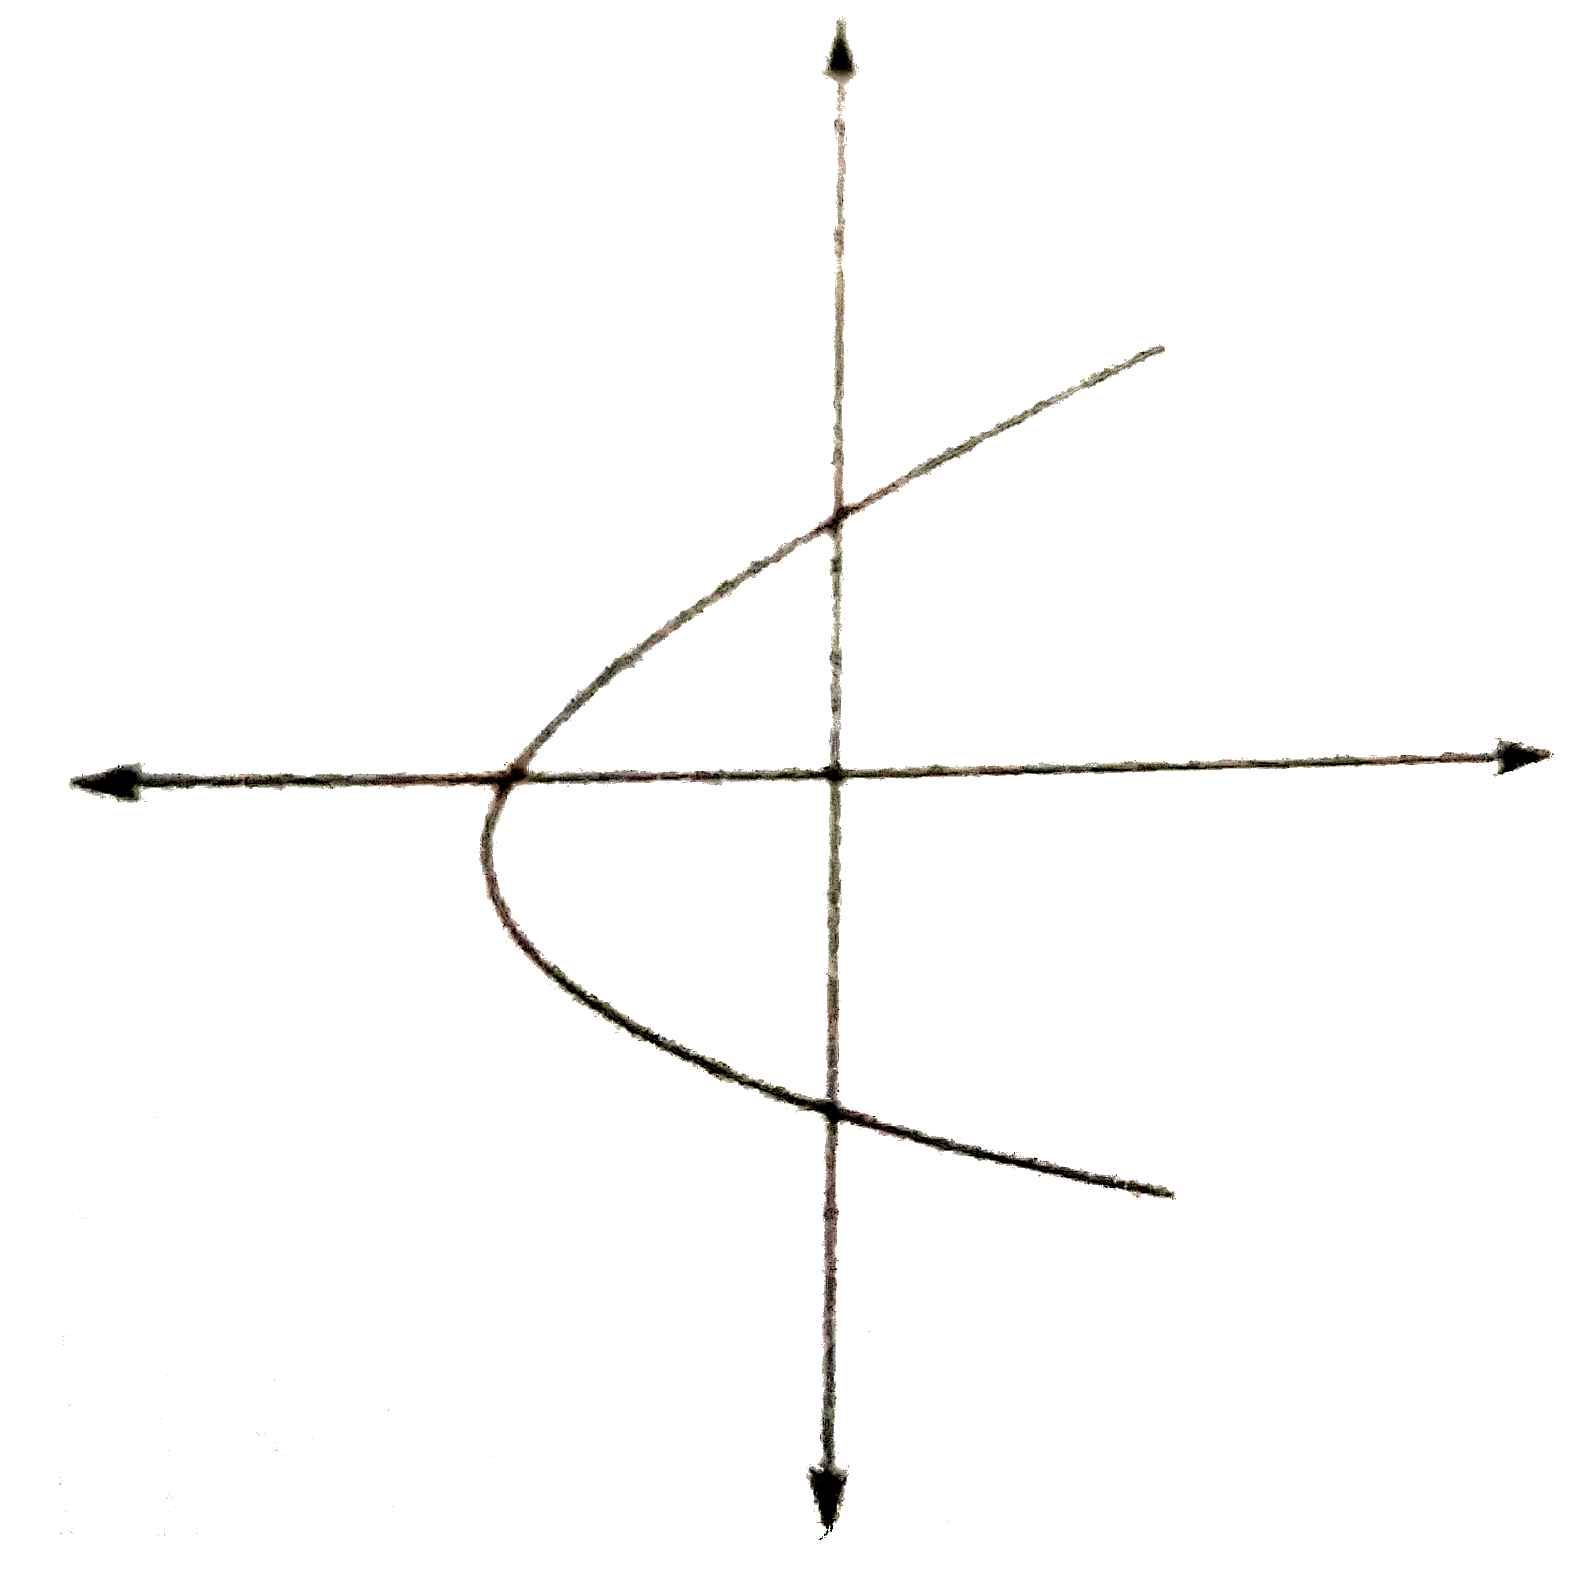 C
C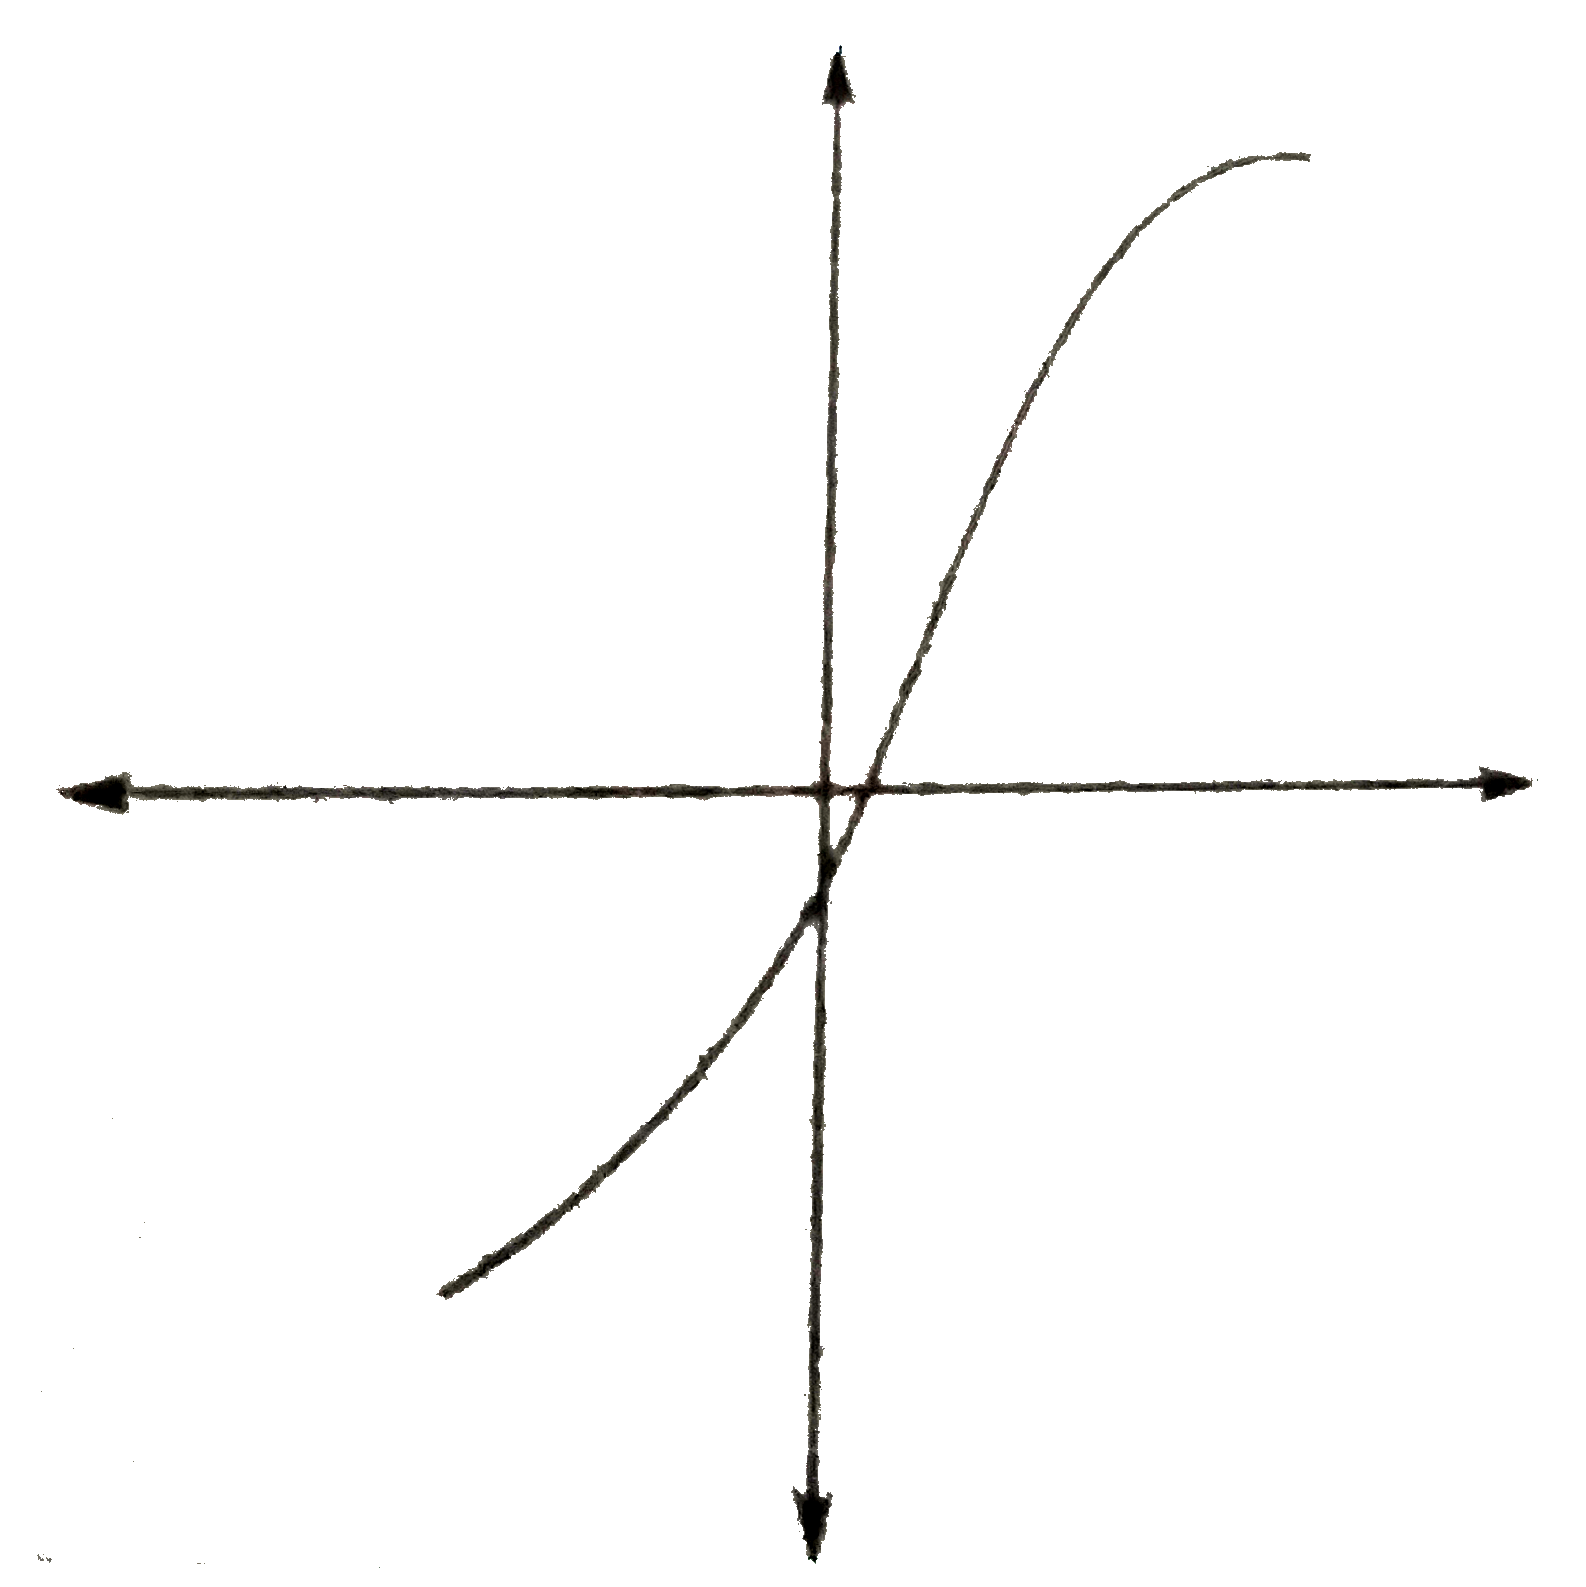 D
D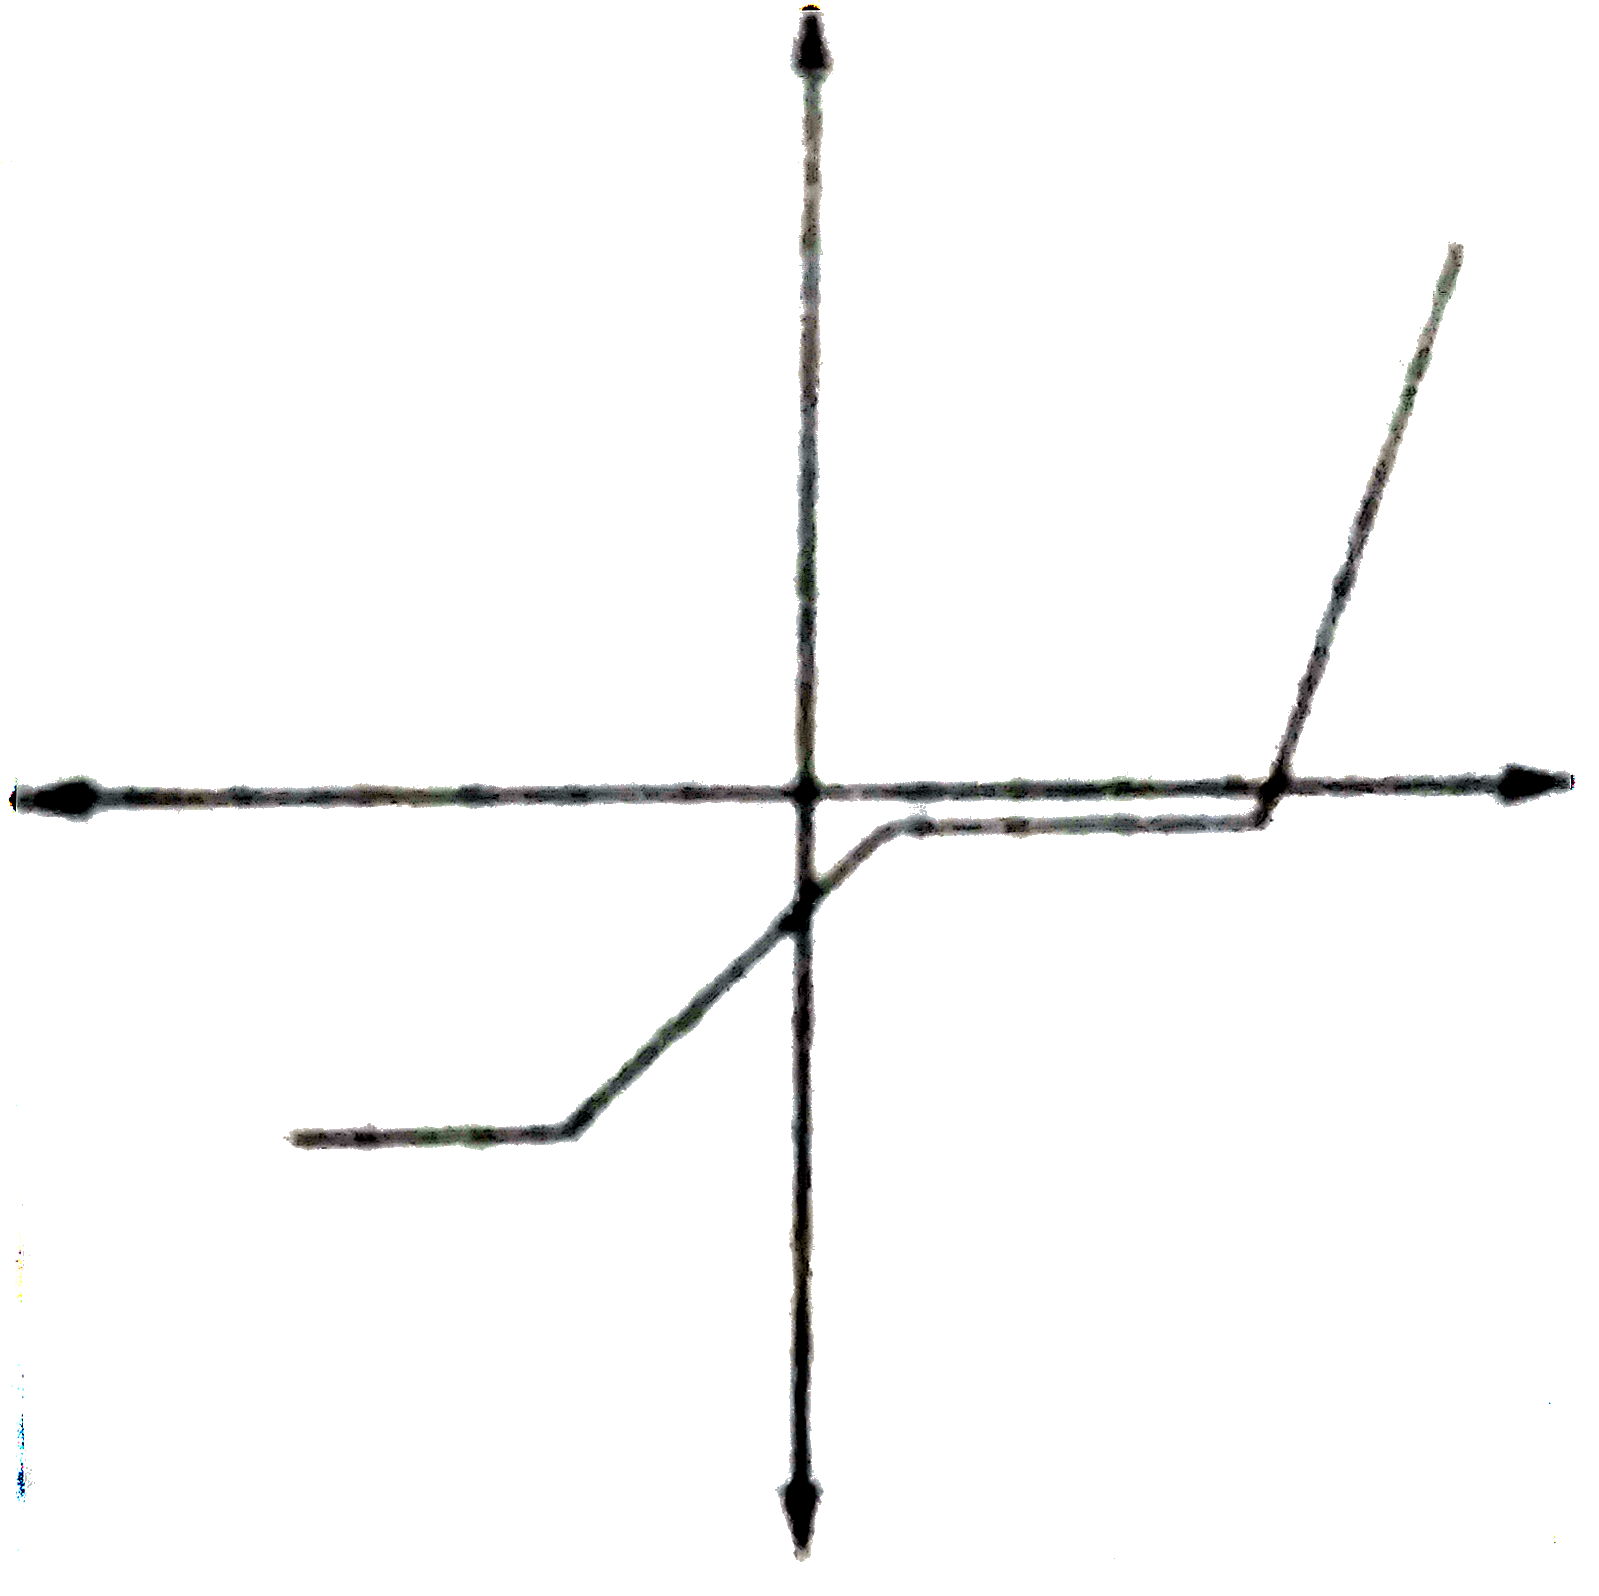
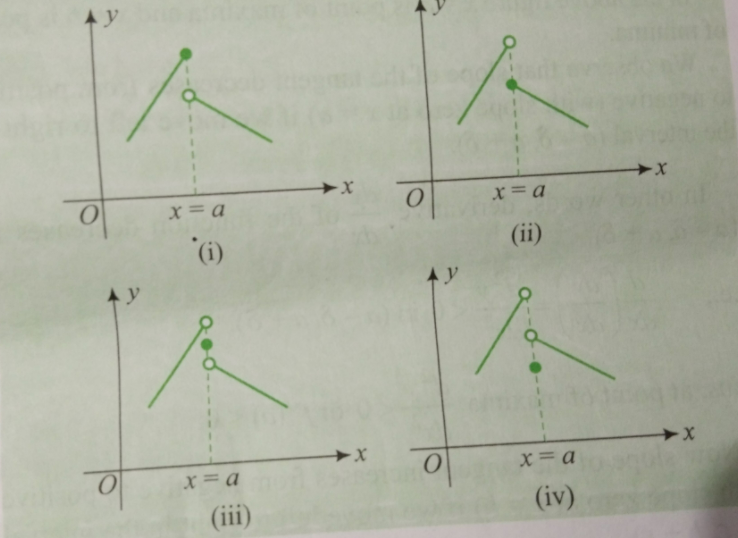
Consider the following graphs of the functions. Check each for the extrema at x=a
View Solutionthe graph of a function f is given. Answer the following questions
View SolutionWhich of the following graph is a function?
View SolutionWhich of the following graphs are graphs of a function?
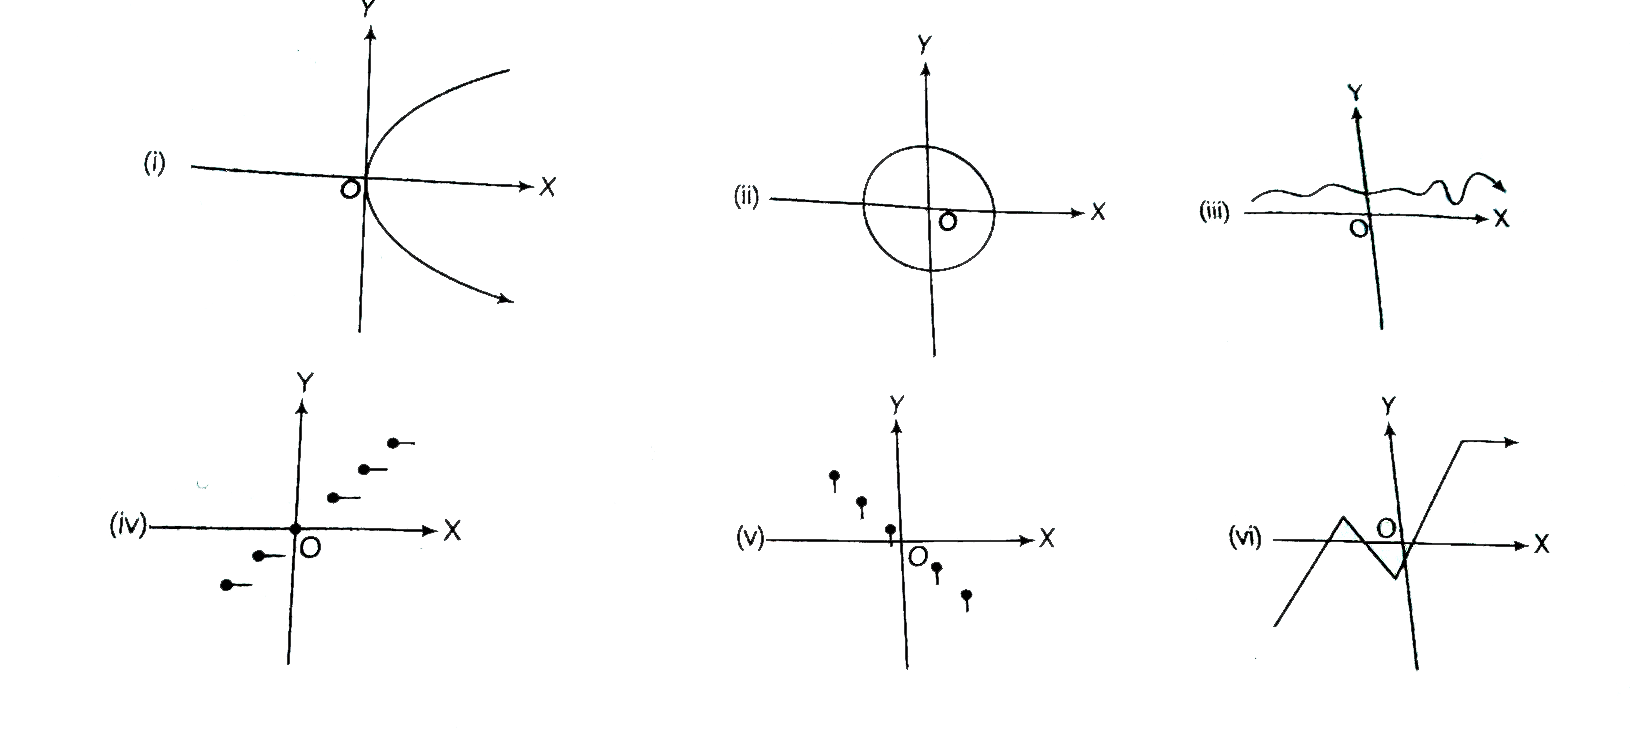
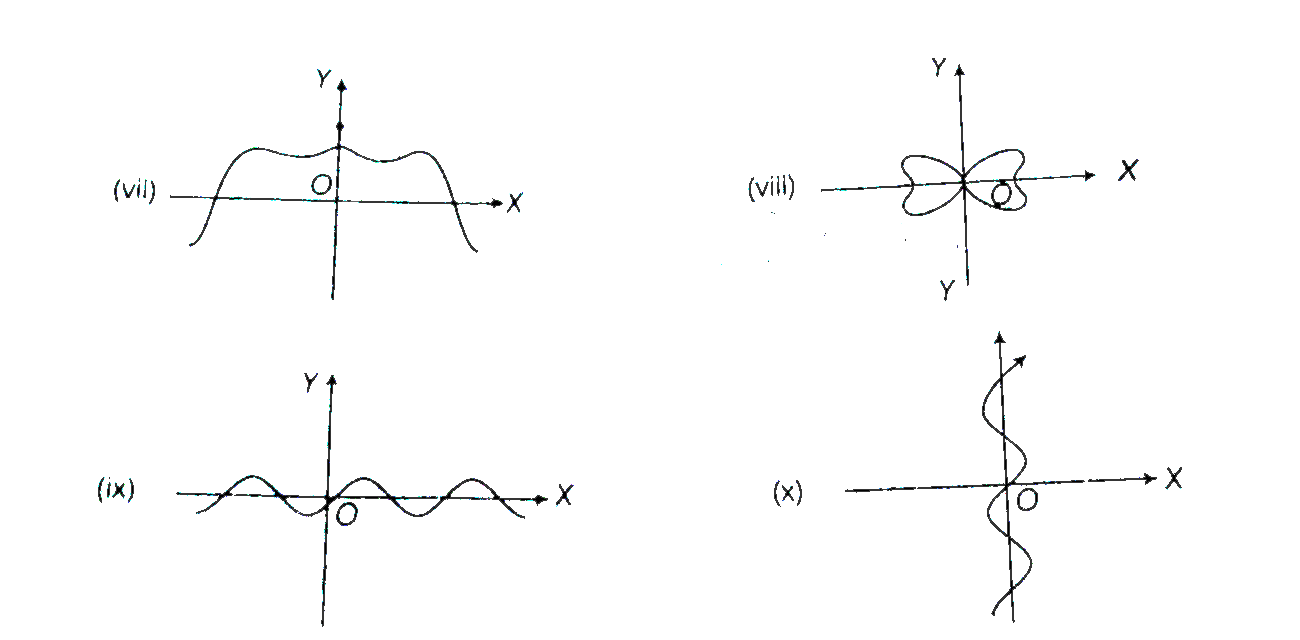
View SolutionWhich of the following graphs are graphs of a function?


View SolutionWhich one of the following graphs represent a function? (FIGURE)
View Solution

