The table given below shows the population of four towns over two years
Q (i)The table given below shows the population of four towns over two years
(ii) In which town was the population growth maximum
(iii) In which town was the population growth least
Hint Take 1 unit = 1 lakh people

The correct Answer is:(i) a
(ii) d
Step by step video, text & image solution for The table given below shows the population of four towns over two yearsQ (i)The table given below shows the population of four towns over two years(ii) In which town was the population growth maximum (iii) In which town was the population growth leastHint Take 1 unit = 1 lakh people by Maths experts to help you in doubts & scoring excellent marks in Class 7 exams.
Topper's Solved these Questions
- BOOK - RS AGGARWALCHAPTER - BAR GRAPHSEXERCISE - EXERCISE 2222videos
BAR GRAPHS
- BOOK - RS AGGARWALCHAPTER - ALGEBRAIC EXPRESSION EXERCISE - EXERCISE 6D31videos
ALGEBRAIC EXPRESSION
- BOOK - RS AGGARWALCHAPTER - COLLECTION AND ORGANISATION OF DATA (MEAN, MEDIAN AND MODE)EXERCISE - EXERCISE 21C5videos
COLLECTION AND ORGANISATION OF DATA (MEAN, MEDIAN AND MODE)
Similar Questions
The table given below shows the population of four towns over two years
Q (i)The table given below shows the population of four towns over two years
(ii) In which town was the population growth maximum
(iii) In which town was the population growth least
Hint Take 1 unit = 1 lakh people
 View Solution
The table below compares the population (in hundreds) of 4 towns over two years:

Study the table and answer the following questions:
(a) Draw a double bar graph using appropriate scale to depict the above information.
(b) In which town was the population growth maximum?
(c) In which town was the population growth least?View Solution
Knowledge Check
- Question 1 - Select One
The present population of a town is 26010. It increases annually at the rate of 2%. What was the population of town two years ago ?
A25000B25100C25200D25500 - Question 2 - Select One
The present population of a town is 26010. It increases annually at the rate of 2%. What was the population of town 2 years ago ?
A25000B25100C25200D25500 - Question 3 - Select One
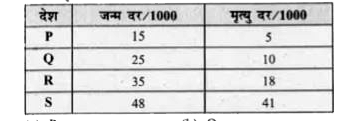
चार देशों की जन्म दर एवं मृत्यु दर नीचे दी गई है | किसकी समष्टि वृद्धि दर सबसे कम होगी ?
 AMBNCODP
The population of a town is increasing at the rate of 5% per annum. What will be the population of the town on this basis after two years, if the present population is 16000?
View SolutionIf the population of a town increased every year by 2.1% of the population at the beginning of that year,in how many years will the total increase of population be 20%
View SolutionThe annual increase in the population of a town is 10%. If the present population of the town is 180000, then what will be its population after two years ?
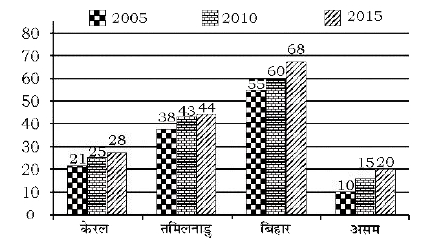
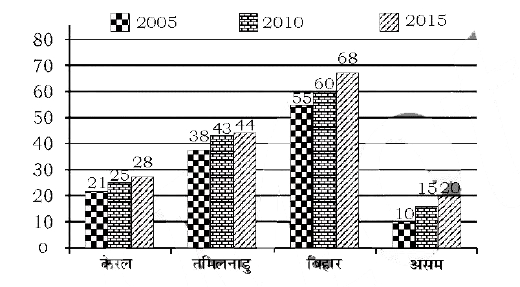
View SolutionThe given bar chard shows population of 4 different states in 3 years

IN the given bar chart which state has had the maximum population growth in 2015 compared to 2005?View SolutionThe given bar chart shows population of 4 different states in 3 years

In the given bar chart, what is the population growth in total in states kerala and tamil nadu for the period between 2005 and 2015?View Solution

