Sonal and Anmol then made another sequence of the designs. Three of the designs are shown below.
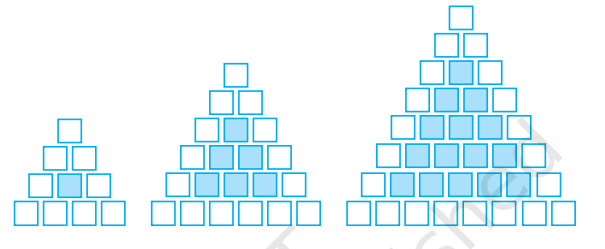
(a) Complete the table.

(b) Draw a graph of rows and number of white tiles. Draw another graph of the number of rows and the number of purple tiles. Put the number of rows on the horizontal axis.
(c) Which graph is linear?
Step by step video & image solution for Sonal and Anmol then made another sequence of the designs. Three of the designs are shown below. (a) Complete the table. (b) Draw a graph of rows and number of white tiles. Draw another graph of the number of rows and the number of purple tiles. Put the number of rows on the horizontal axis. (c) Which graph is linear? by Maths experts to help you in doubts & scoring excellent marks in Class 8 exams.
Updated on:21/07/2023Topper's Solved these Questions
- INTRODUCTION TO GRAPHS Book:NCERT EXEMPLARChapter:INTRODUCTION TO GRAPHS Exercise:THINK AND DISCUSS
Explore 4 Videos
- EXPONENTS AND POWERSBook:NCERT EXEMPLARChapter:EXPONENTS AND POWERSExercise:EXERCISE
Explore 195 Videos
- LINEAR EQUATIONS IN ONE VARIABLEBook:NCERT EXEMPLARChapter:LINEAR EQUATIONS IN ONE VARIABLEExercise:THINK AND DISCUSS
Explore 3 Videos
Similar Questions
Sonal and Anmol made a sequence of tile designs from square white tiles surrounding one square purple tile. The purple tiles come in many sizes. Three of the designs are shown below.
(a) Copy and complete the table
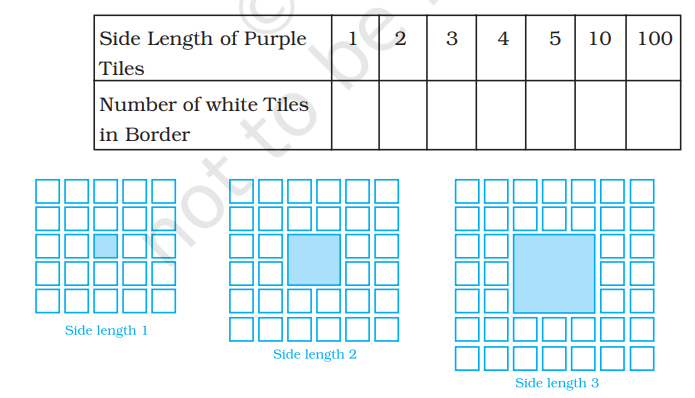
(b) Draw a graph using the first five pairs of numbers in your table.
(c) Do the points lie on a line?
View SolutionFrom the data given below, draw a linear graph showing the relationship between the cost of trousers and the number of trousers.

View Solution
Knowledge Check
In each of the following questions two row numbers are given. The resultant number in each row is to be worked out separately based on the following rules and the question below the rows is to be answered. The operations of numbers progress from left to right.
Rules.
(i) If an even number is followed by another even number they are to be added.
(ii) If an even number is followed by a prime number, they are to be multiplied.
(iii) If an odd number is followed by an even number, the even number is to be subtracted from the odd number.
(iv) If an odd number is followed by another odd number, first number is to be added to the square of the second number.
(v) If an even number is followed by a composite odd number, the even number is to be divided by the odd E number.
I.12716II.792815
What is the difference between the resultant of the second row and the first row ?A276B176C100D156In each of the following questions two row numbers are given. The resultant number in each row is to be worked out separately based on the following rules and the question below the rows is to be answered. The operations of numbers progress from left to right.
Rules.
(i) If an even number is followed by another even number they are to be added.
(ii) If an even number is followed by a prime number, they are to be multiplied.
(iii) If an odd number is followed by an even number, the even number is to be subtracted from the odd number.
(iv) If an odd number is followed by another odd number, first number is to be added to the square of the second number.
(v) If an even number is followed by a composite odd number, the even number is to be divided by the odd E number.
I.361339II.77307
What will the outcome if the resultant of the second row is divided by the resultant of the first row ?A12B16C8D6
Observe the toothpick pattern given below:

(a) Imagine that this pattern continues. Complete the table to show the number of toothpicks in the first six terms.

(b) Make a graph by taking the pattern numbers on the horizontal axis and the number of toothpicks on the vertical axis. Make the horizontal axis from 0 to 10 and the vertical axis from 0 to 30.
(c) Use your graph to predict the number of toothpicks in patterns 7 and 8. Check your answers by actually drawing them.
(d) Would it make sense to join the points on this graph? Explain.
View SolutionUse the tables below to draw line graphs.
The number of days a hill side city received snow in different years.

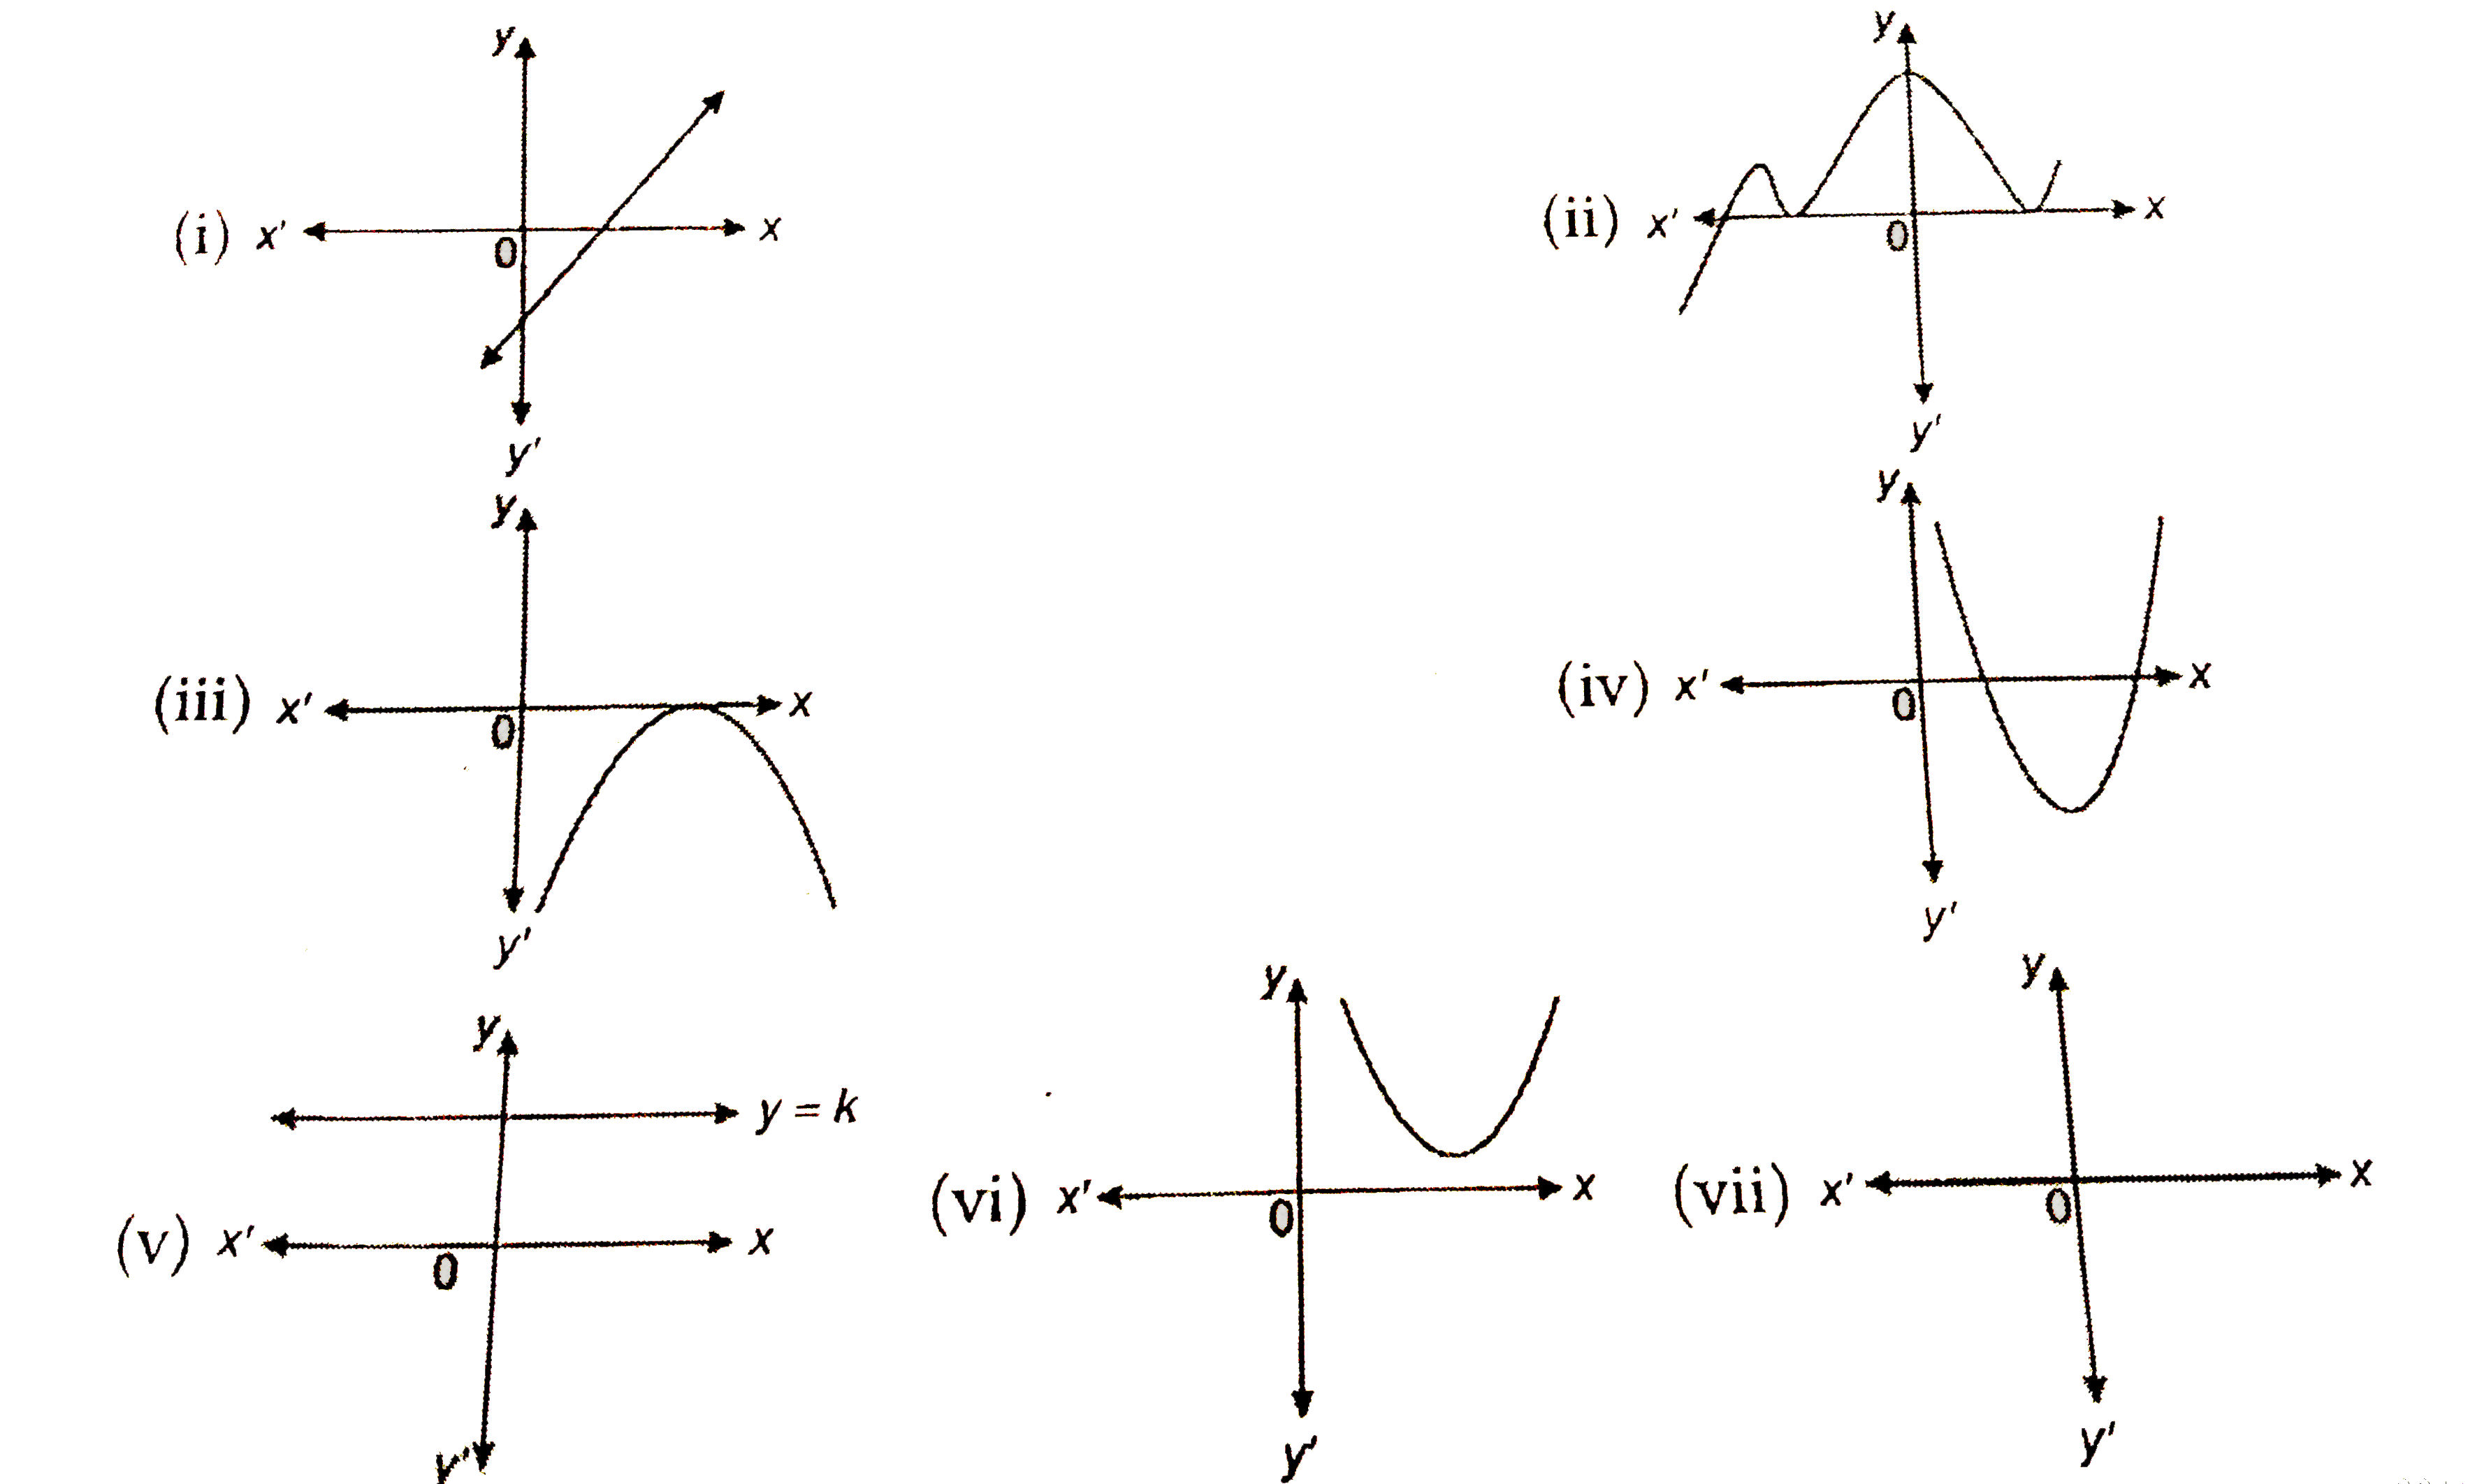
View SolutionWhich of the graphs given below corresponds to linear polynomial or a quadratic polynomial ? Also, find the number of zeroes of the polynomial in each case.
View SolutionThe numbers 2 3 4 5 6 7 8 are to be placed one per square in the diagram as shown below such that the sum of the four numbers in the horizontal row as well as vertical row is 21 then the number of ways in which this can be done is ?
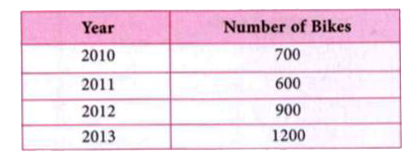
View SolutionDraw a bar graph using the data given in the following table, which shows the number of bikes manufactured in a factory during the years 2010 to 2013.
View SolutionDirection: The bar graph shown below indicate the number of books owned and the number of books issued by the 5 different libraries A, B, C, D, and E. Based on the given bar graph answer the question given below:
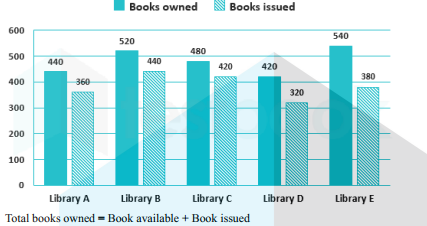
Find the average number of books owned in all 5 library.
View Solution