The points on the graph below represent the height and weight of the donkey, dog, crocodile, and ostrich shown in the drawing.
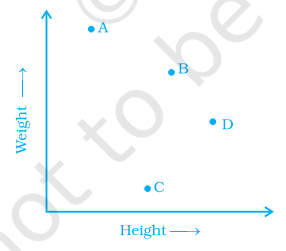
(a) What are the two variables represented in the graph?
(b) Which point represents each animals? Explain.
Step by step video & image solution for The points on the graph below represent the height and weight of the donkey, dog, crocodile, and ostrich shown in the drawing. (a) What are the two variables represented in the graph? (b) Which point represents each animals? Explain. by Maths experts to help you in doubts & scoring excellent marks in Class 8 exams.
Updated on:21/07/2023Topper's Solved these Questions
- INTRODUCTION TO GRAPHS BOOK - NCERT EXEMPLARCHAPTER - INTRODUCTION TO GRAPHS EXERCISE - THINK AND DISCUSS
4 Videos
- EXPONENTS AND POWERSBOOK - NCERT EXEMPLARCHAPTER - EXPONENTS AND POWERSEXERCISE - EXERCISE
195 Videos
- LINEAR EQUATIONS IN ONE VARIABLEBOOK - NCERT EXEMPLARCHAPTER - LINEAR EQUATIONS IN ONE VARIABLEEXERCISE - THINK AND DISCUSS
3 Videos
Similar Questions
Knowledge Check
Which of the graphs shown below represent the motion with uniform speed?
A B
B C
C D
D
What does point A and B represent in the following diagram?
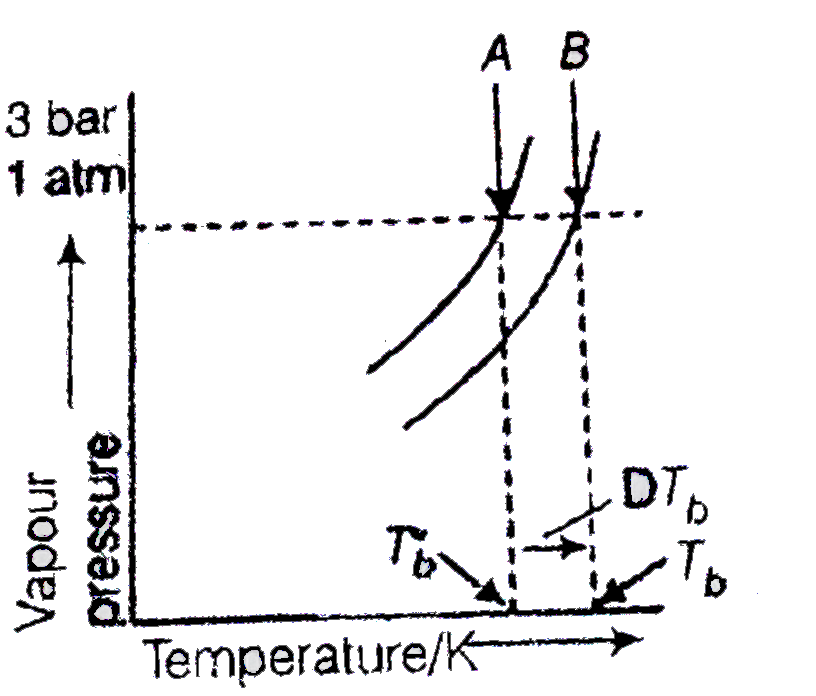 APoint APoint BBoiling point of solventBoiling point of solutionBBoiling point of solutionBoiling point of solventCBoiling point of soluteBoiling point of solventDBoiling point of solventBoiling point of solute
Which of the shown graphs may represent the reactance of a series L-C combination?
A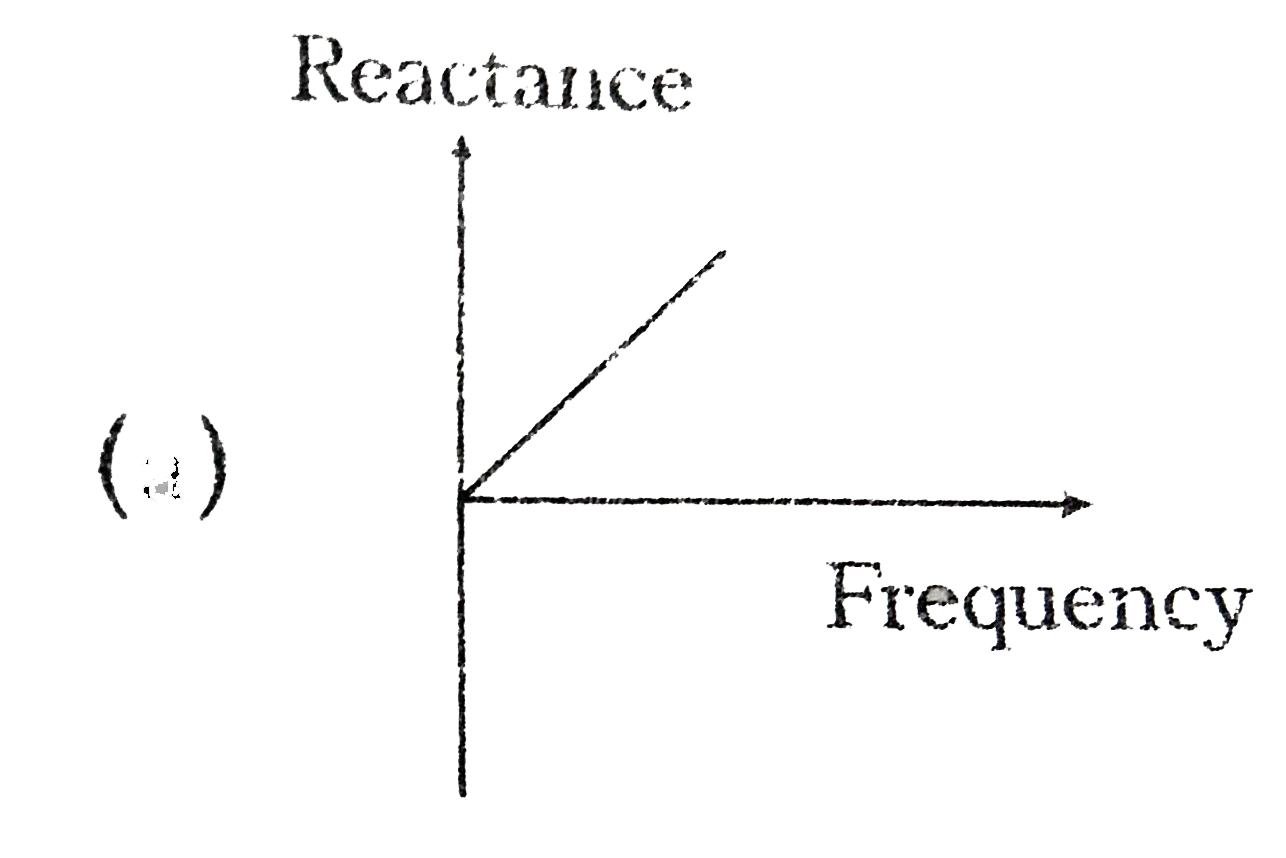 B
B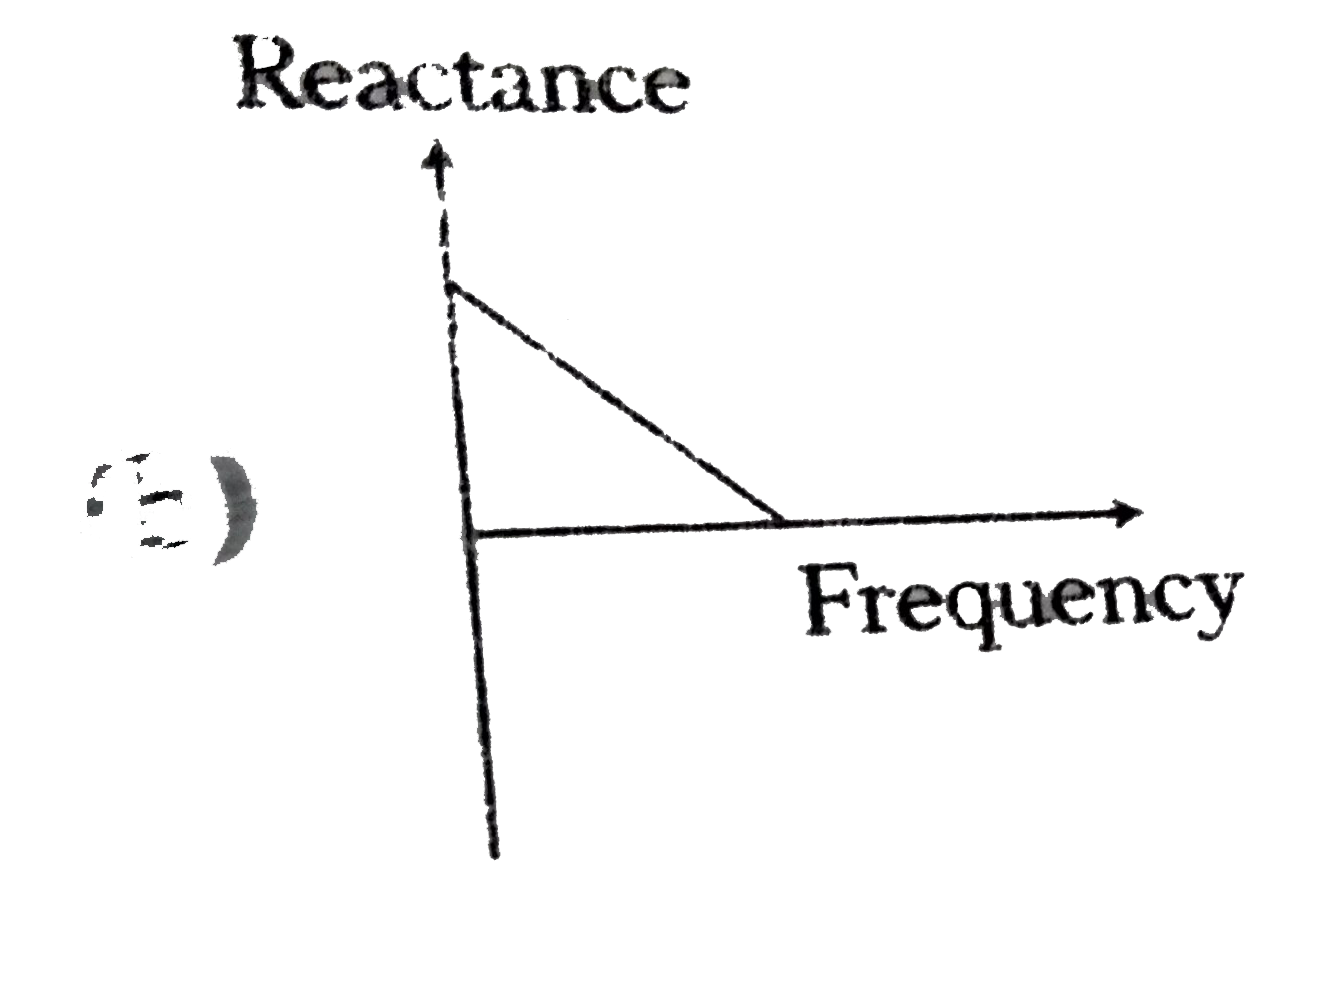 C
C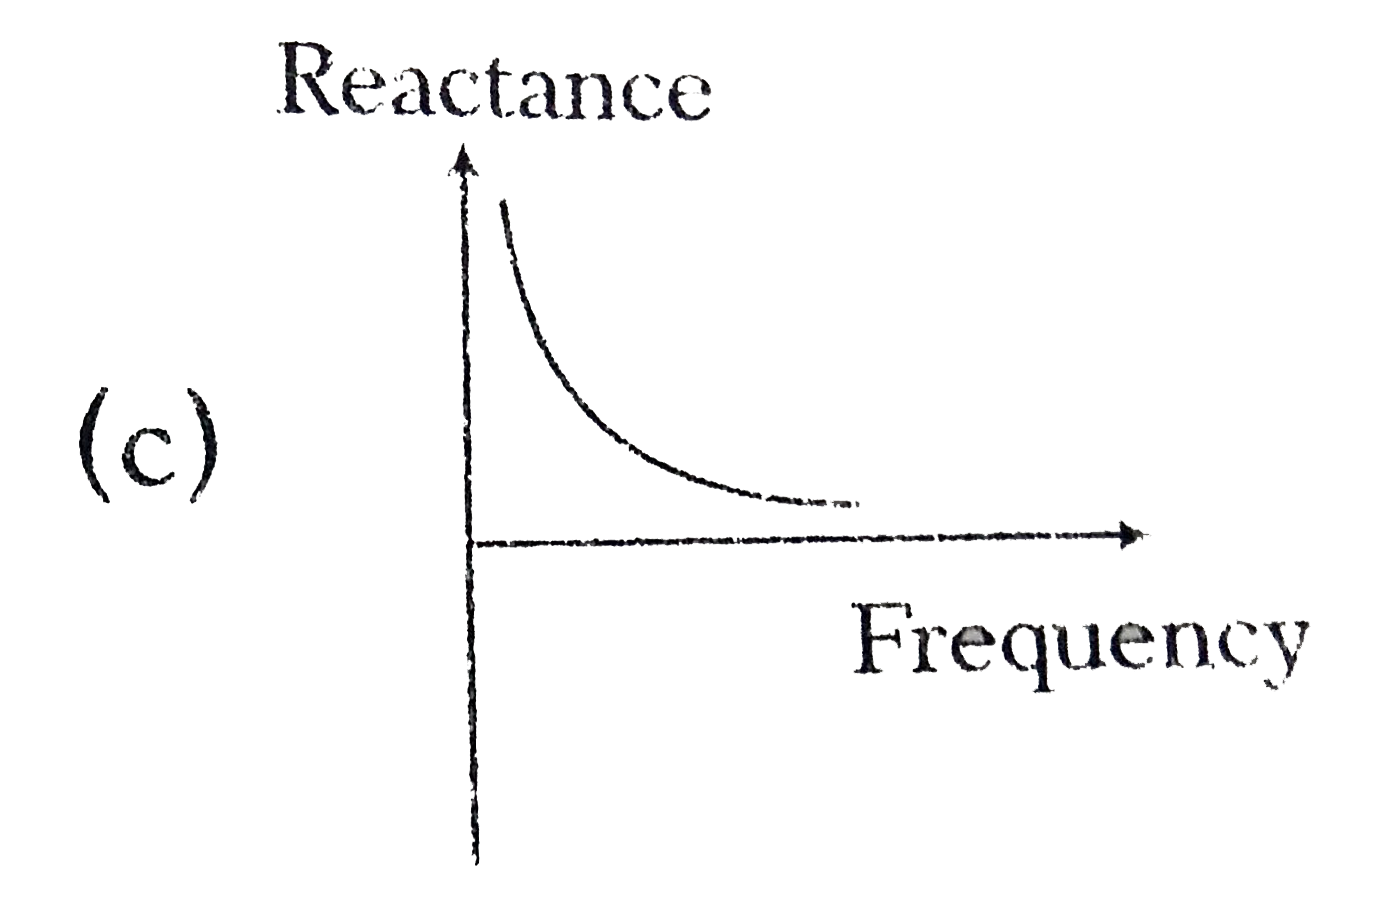 D
D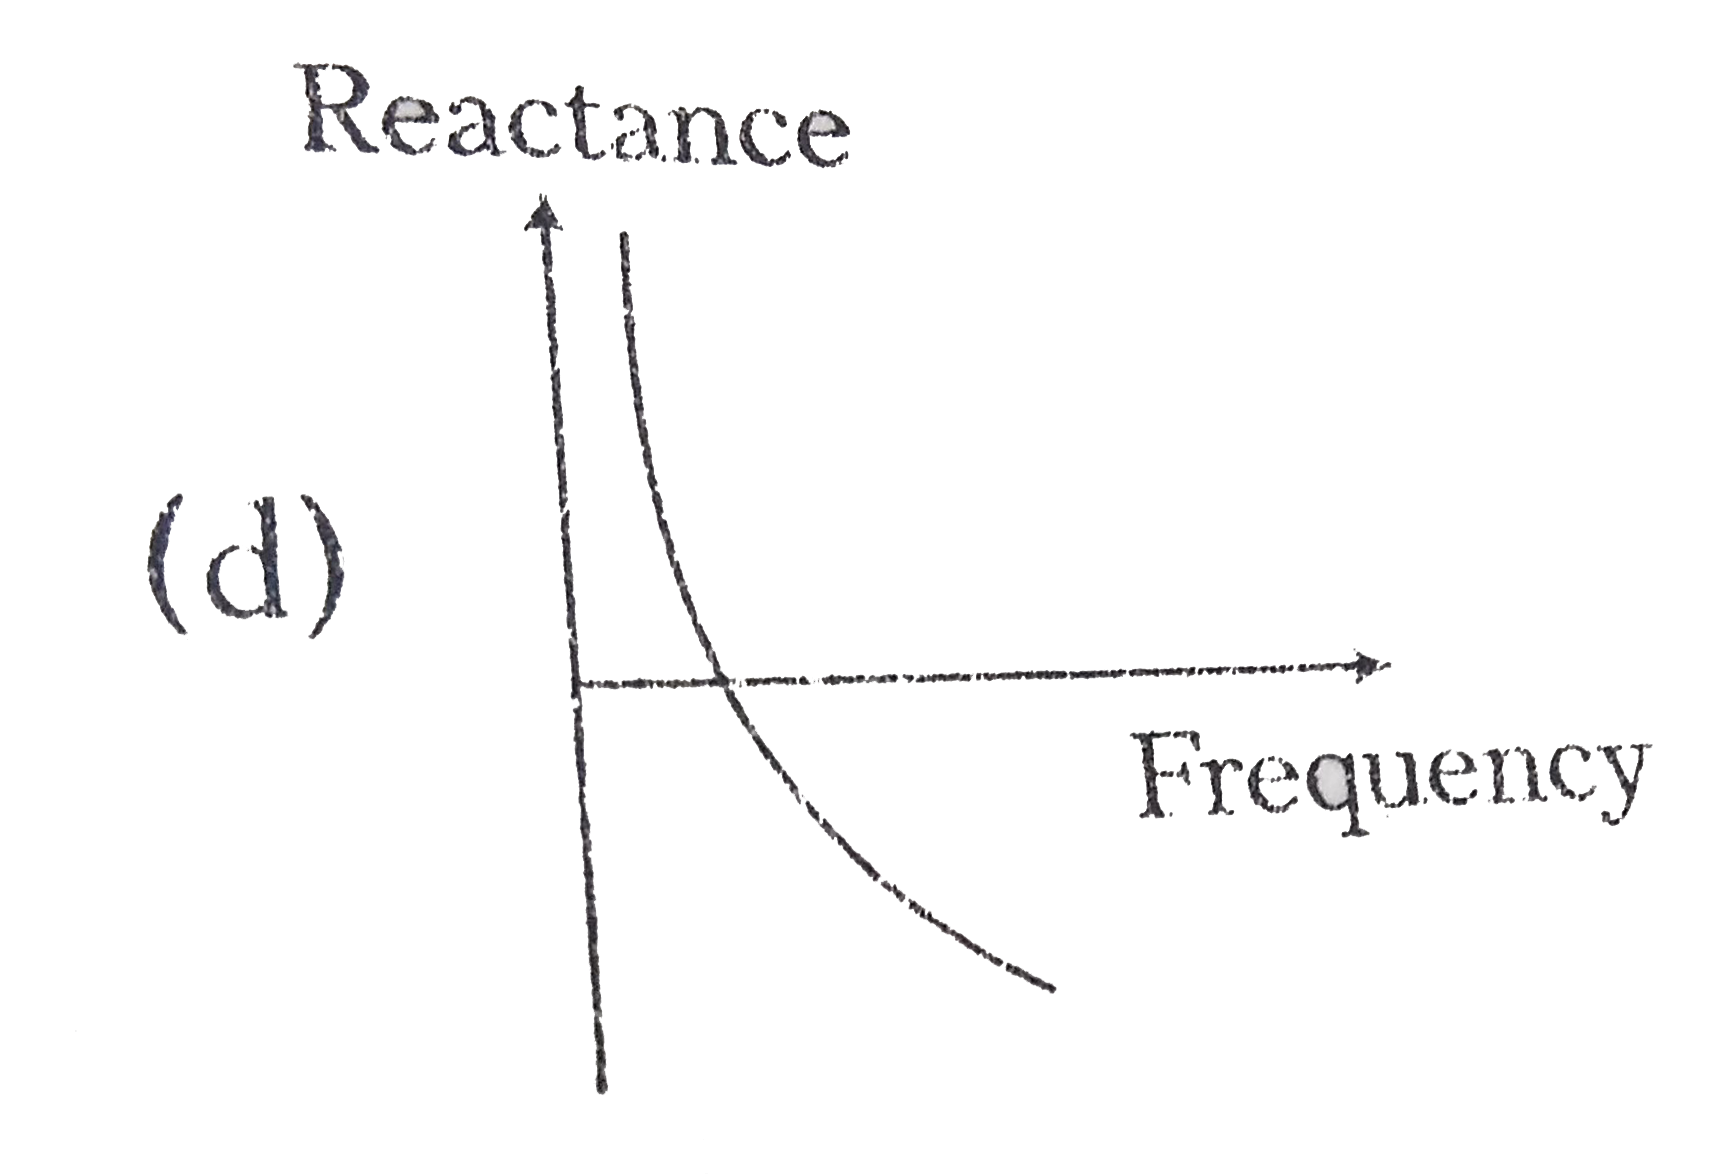
Points (3, 4) and (4, 3) represent the same point on the graph.
View SolutionWhat type of wave is represented:
(a) by density-distance graph?
(b) by displacement-distance graph?
View SolutionWhat type of motion is represented by each one of the following graphs ?

View SolutionThe graph given below represents the interconversion of ice to water vapour. Identify the point in the curve which indicates the boiling point of water.
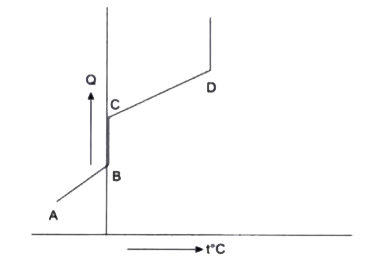
View SolutionFigure below shows the velocity-time graph of a one dimensional motion. Which of the following characteristic of the particle is represented by the shaded area?
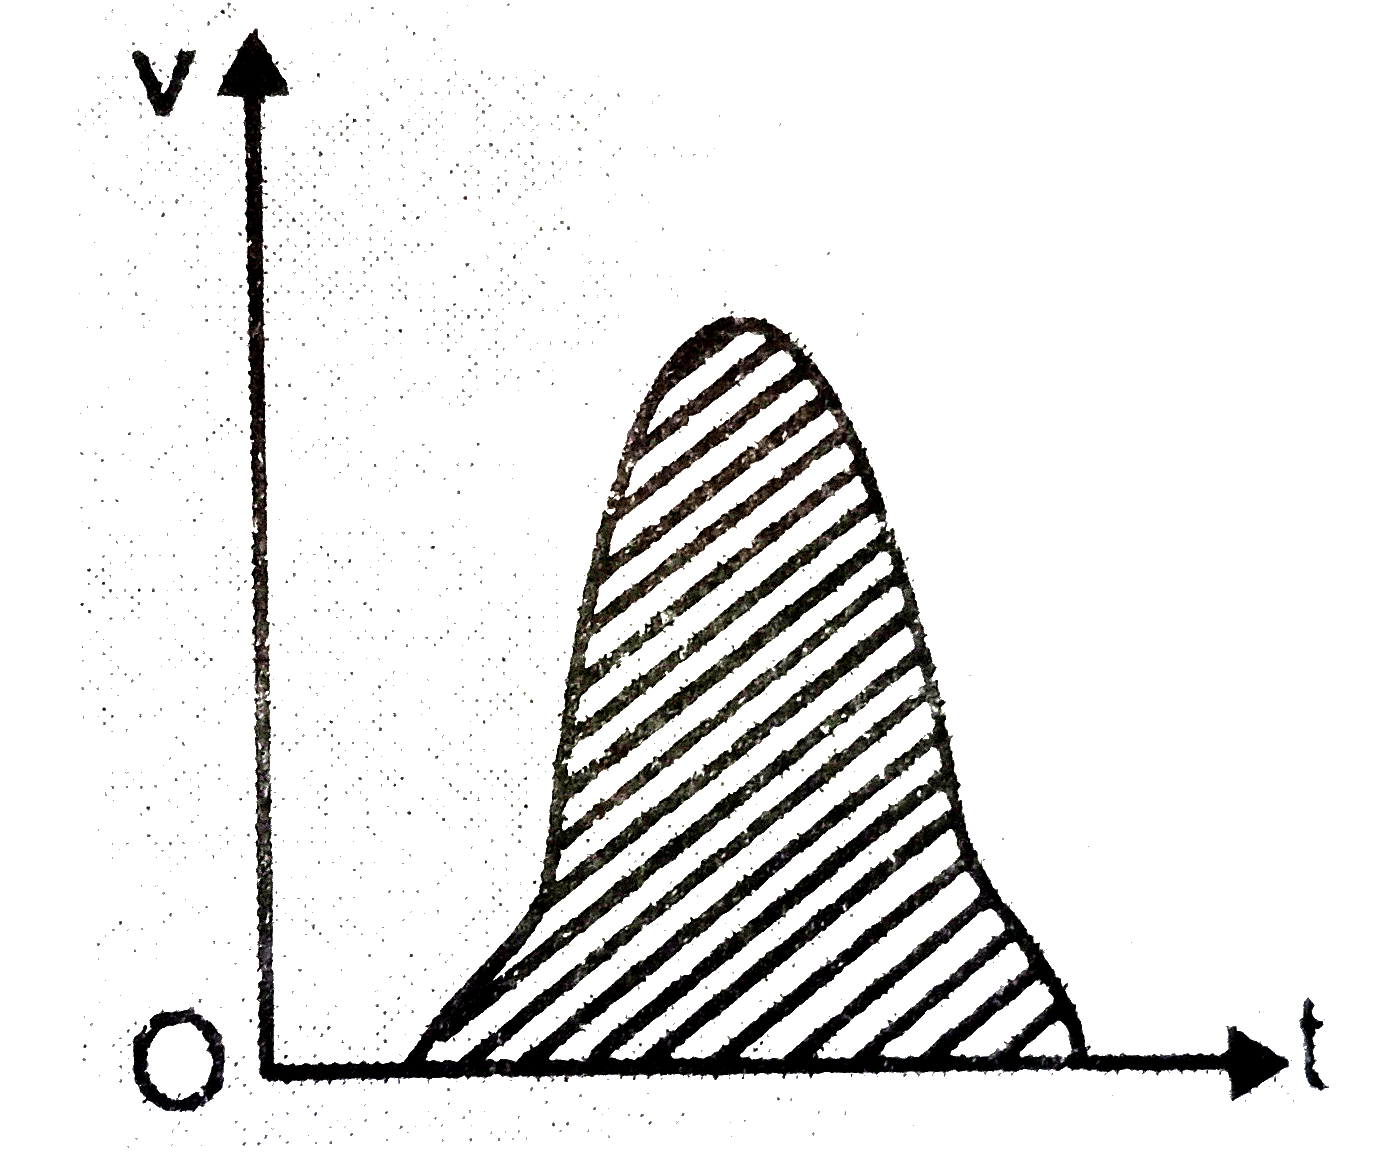
View Solution
