At time t=O, some radioactive gas is injected into a sealed vessel. At time T. some more mass of the sam gas is injected into the same vessel. Which one of the following graphs best represetns the variation of the logarithm of the acitivity A of the gas with time t?


The correct Answer is:B
Step by step video & image solution for At time t=O, some radioactive gas is injected into a sealed vessel. At time T. some more mass of the sam gas is injected into the same vessel. Which one of the following graphs best represetns the variation of the logarithm of the acitivity A of the gas with time t? by Physics experts to help you in doubts & scoring excellent marks in Class 12 exams.
Topper's Solved these Questions
- BOOK - AAKASH SERIESCHAPTER - NUCLEAR PHYSICSEXERCISE - ADDITIONAL PRACTICE LEVEL-II (LECTURE SHEET (ADVANCED)) More than one correct answer Type Questions )4videos
NUCLEAR PHYSICS
- BOOK - AAKASH SERIESCHAPTER - NUCLEAR PHYSICSEXERCISE - ADDITIONAL PRACTICE LEVEL-II (LECTURE SHEET (ADVANCED)) Linked Comprehension Type Questions Passage-I :)2videos
NUCLEAR PHYSICS
- BOOK - AAKASH SERIESCHAPTER - NUCLEAR PHYSICSEXERCISE - ADDITIONAL PRACTICE EXERCISE (LEVEL-I (MAIN)) (Straight Objective Type Questions)10videos
NUCLEAR PHYSICS
- BOOK - AAKASH SERIESCHAPTER - MOVING CHARGES AND MAGNETISMEXERCISE - EXERCISE-III49videos
MOVING CHARGES AND MAGNETISM
- BOOK - AAKASH SERIESCHAPTER - NUCLEIEXERCISE - Practice Exercise40videos
NUCLEI
Similar Questions
At time t=0, some radioactive gas is injected into a sealed vessel. At time T, some more of the same gas is injected into the same vessel. Which one of the following graphs best represents the variation of the logarithm of the activity A of the gas with time t?
View SolutionThe graph shown the variation with times t of the velocity v of an object . Which one of the following graphs best represents the variation of acceleration a of the object with time t?
 View Solution
Which of the following x-t graphs represents the distance-time variation of a body released from the top of a buiding?
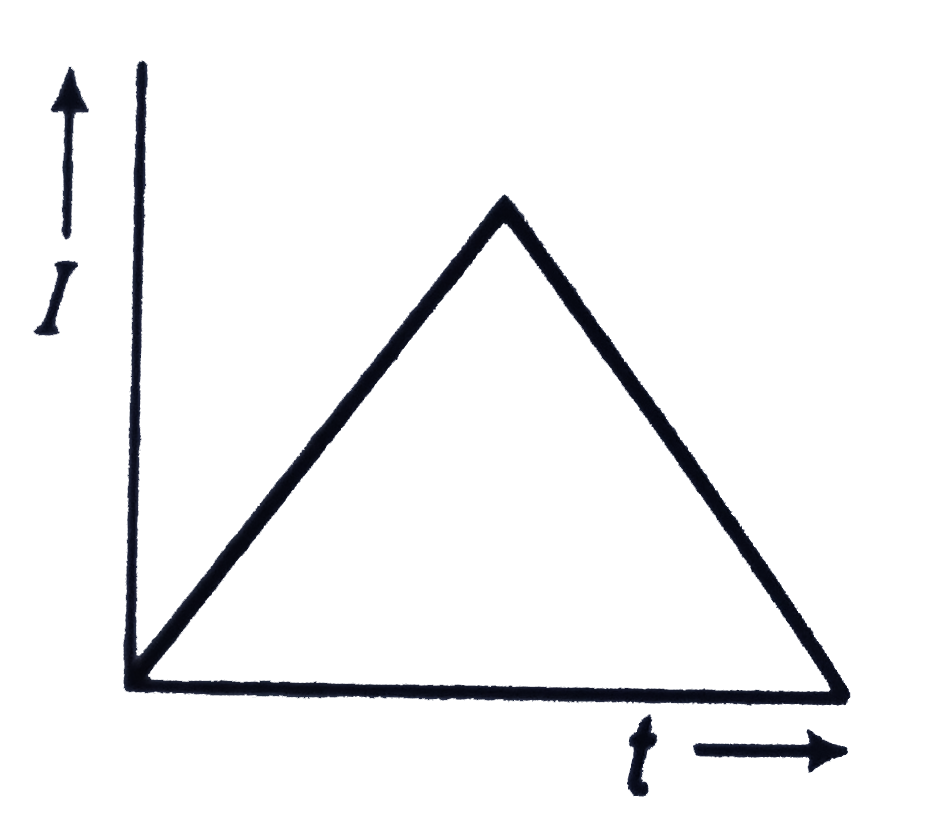
View SolutionAn alternating current I in an inductance coil varies with time t according to the graph as shown: Which one of the following graph gives the variation of voltage with time?
 View Solution
An alternating current I in an inductance coil varies with time t according to the graph as shown: Which one of the following graph gives the variation of voltage with time?
 View Solution
A body is projected vertically upward from ground. If we neglect the effect of air, then which one of the following is the best representation of variation of speed (v) with time (t)?
View SolutionTen moles of an ideal gas are filled in a closed vessel. The vessel has cylinder and piston type arrangement and pressure of the gas remains constant at 0.821 atm. Which of the following graph represents correct variation of log V vs log T?
(V = Volume in litre and T = temperature in Kelvin)View SolutionIf heat energy is given to an ideal gas at constant pressure, then select the graph which best represents the variation of VT with temperature (T).
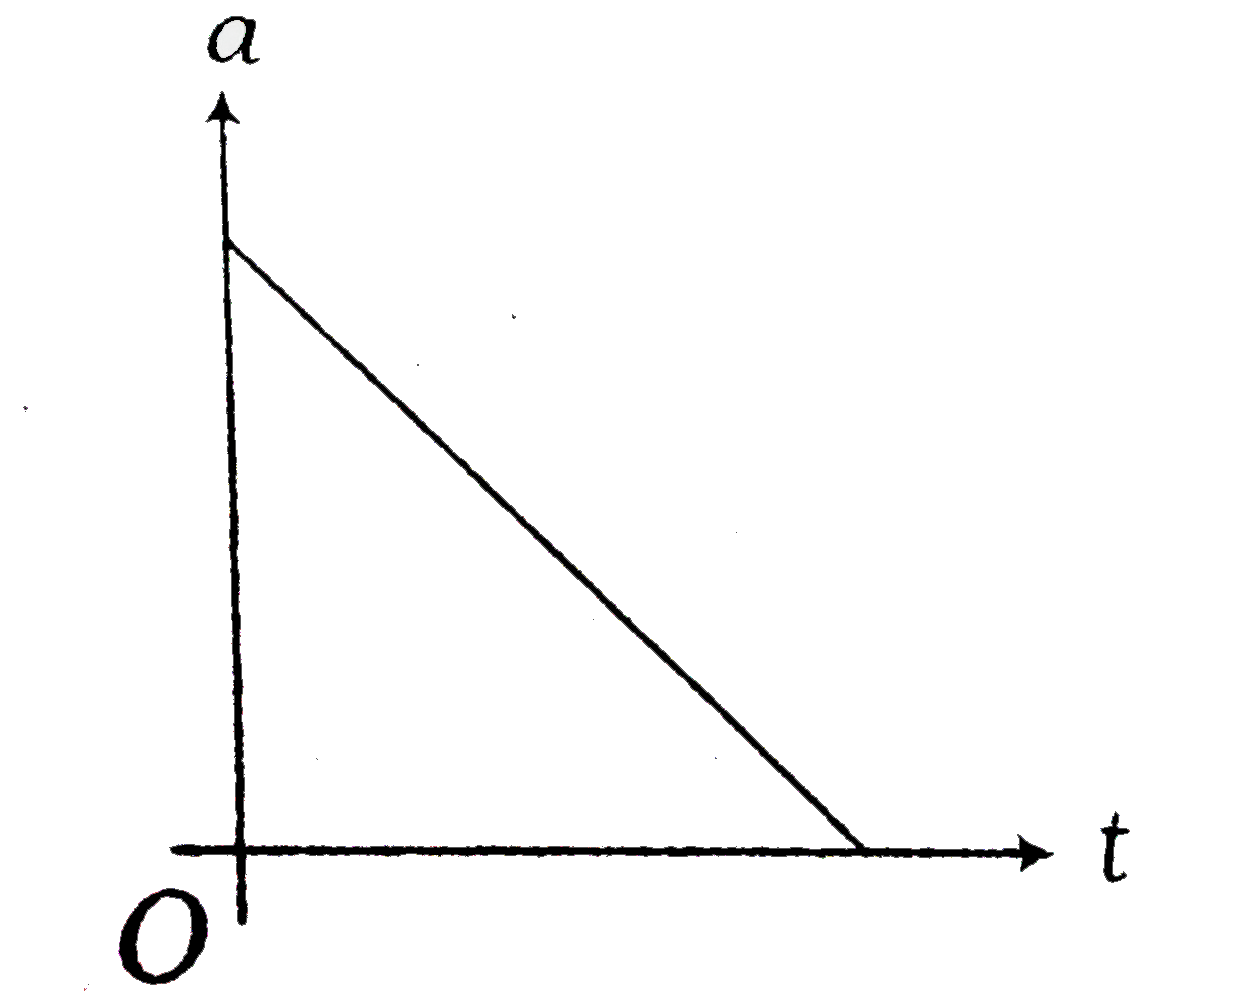
View SolutionThe acceleration (a)-time(t) graph for a particle moving along a straight from rest is shown in figure. Which of the following graph is the best representation of its velocity (v) with time (t) ?
 View Solution
The acceleration (a)-time(t) graph for a particle moving along a straight from rest is shown in figur. Which of the following graph is the best representation of its velocity (v) with time (t) ?
 View Solution

