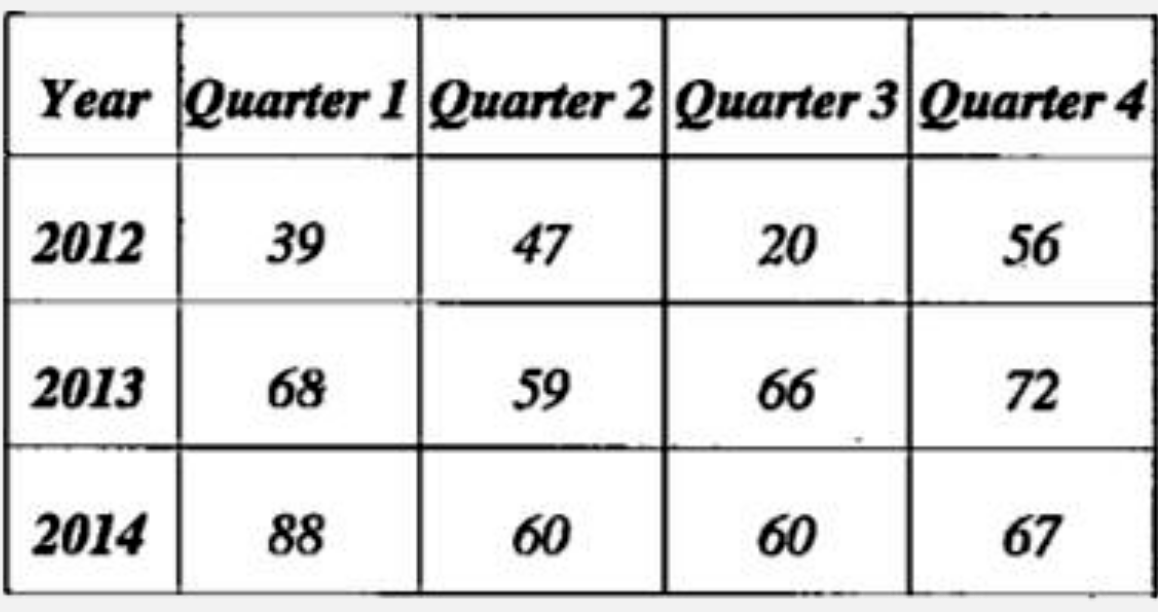
Plot these figures on a graph.
Calculate the 4-quarterly moving averages and plot on the same graph.
The correct Answer is:10.7 for Sept. ' 53, 10.6 for Dec. ' 53, 10.5 for Mar. ' 54, 10.5 for June ' 54, 10.6 for Sept. ' 54, 10.7 for Dec. ' 54, 10.7 for Mar. ' 55, 10.62 for June ' 55
Topper's Solved these Questions
- MOVING AVERAGEBOOK - ICSECHAPTER - MOVING AVERAGEEXERCISE - CHAPTER TEST
5 Videos
- MOVING AVERAGEBOOK - ICSECHAPTER - MOVING AVERAGEEXERCISE - CHAPTER TEST
5 Videos
- MODEL TEST PAPERS 01BOOK - ICSECHAPTER - MODEL TEST PAPERS 01EXERCISE - Section C
8 Videos
- PARABOLABOOK - ICSECHAPTER - PARABOLAEXERCISE - CHAPTER TEST
8 Videos
Similar Questions
The following table gives the number of failures of commercial industries in a country during the year 1975 to 1990

Draw a graph illustrating these figures. Calculate the 4 yearly moving averages and plot them on the same graph.
View SolutionThe following table gives the numbers of failures of commercial industries in a country during the years 2000 to 2015.

Draw a graph illustrating these figure.
Calculate the 4 yearly moving averages and plot them on the same graph.
View SolutionDaily absence from a school during three weeks is recorded as follows :

Draw a graph , illustrating the above data . Calculate the 5 - days moving average and plot them on the same graph .
View SolutionThe table below gives details of the electricity generated in kilowatt hours in each quarter for the years 2012 to 2014

Calculate the four-quarterly moving averages and display these and the original figures on the same graph .
View SolutionUsing the following data. Find out the trend using Quarterly moving average and plot them on graph

View SolutionThe quarterly profits of a small scale industry (in thousands of rupees) is as follows:

Calculate four quarterly moving averages. Display these and the original figures graphically on the same graphs sheet.
View SolutionPlot the following points on a graph paper:
(3,2)
View SolutionPlot the following points on a graph paper:
(2,2)
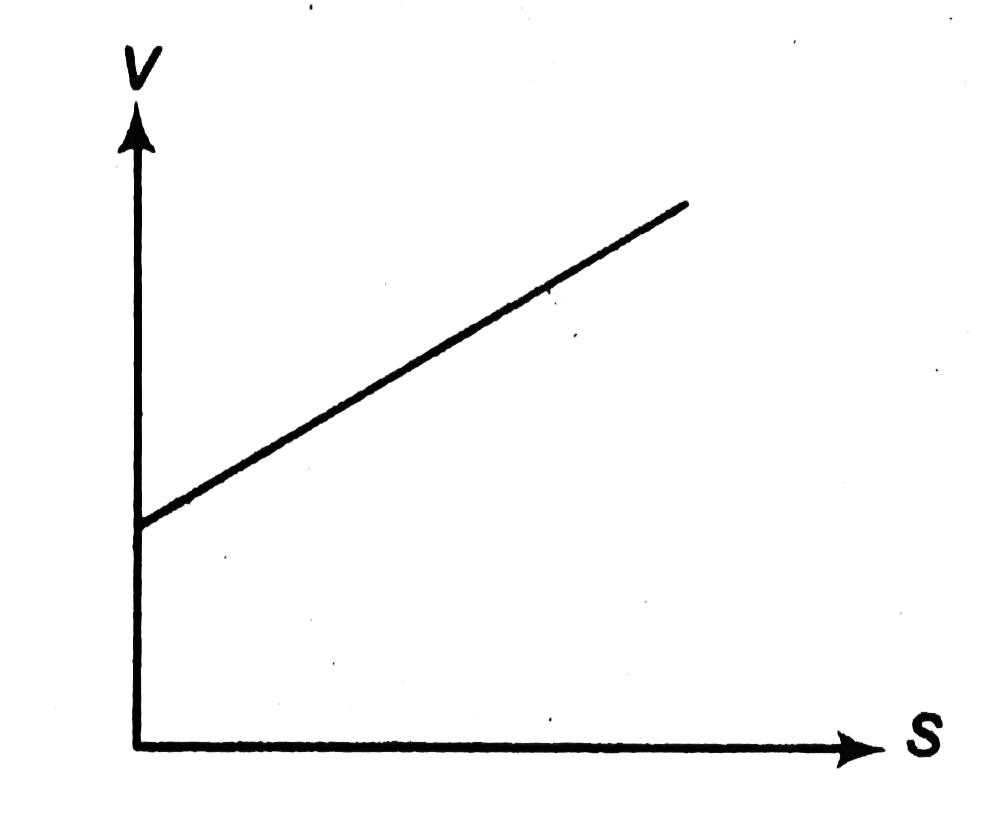
View SolutionCorresponding to given v-s graph of a particle moving in a straight line, plot a-s graph.

View SolutionCorresponding to given v-s graph of a particle moving in a straight line, plot a-s graph.

View Solution
