Calculate 5-yearly moving averages for the following data of the commercial and industrial failures in a country from 1982 to 1997.
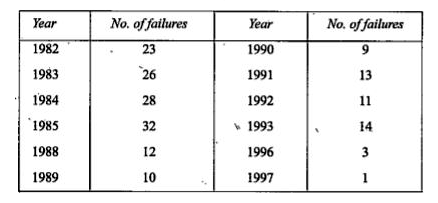
Display the actual and trend values on the same graph using the same axes for both.
The correct Answer is:Following are the 5-yearly moving averages:
Topper's Solved these Questions
- MOVING AVERAGEBOOK - ICSECHAPTER - MOVING AVERAGEEXERCISE - CHAPTER TEST
5 Videos
- MOVING AVERAGEBOOK - ICSECHAPTER - MOVING AVERAGEEXERCISE - CHAPTER TEST
5 Videos
- MODEL TEST PAPERS 01BOOK - ICSECHAPTER - MODEL TEST PAPERS 01EXERCISE - Section C
8 Videos
- PARABOLABOOK - ICSECHAPTER - PARABOLAEXERCISE - CHAPTER TEST
8 Videos
Similar Questions
Construct 3 yearly moving averages from the following data and show on a graph against the original data:
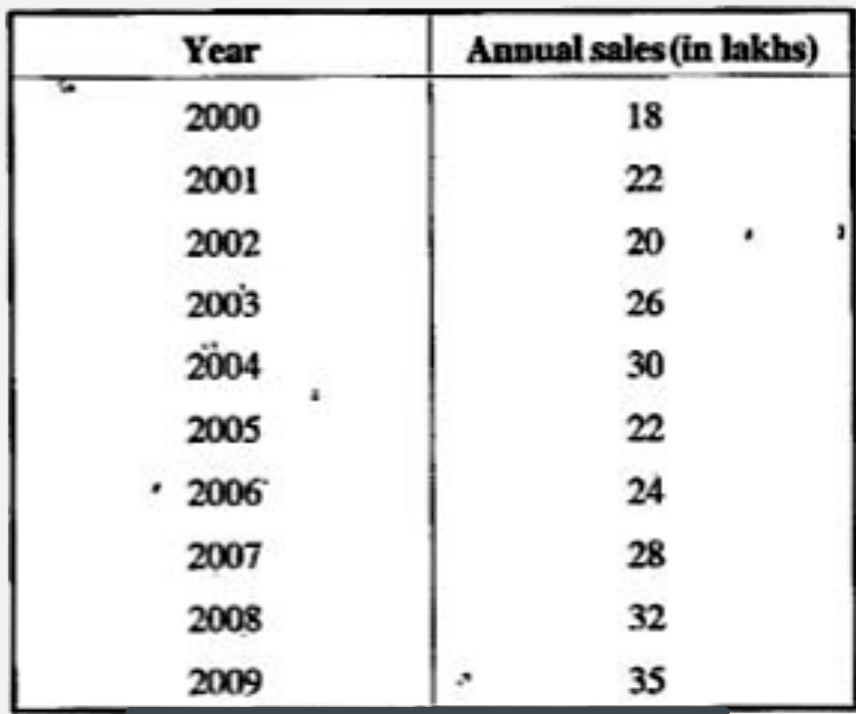
View SolutionCalculate 4- yearly moving averages of the following time series of steel production :

Plot these and the original figures in the same graph.
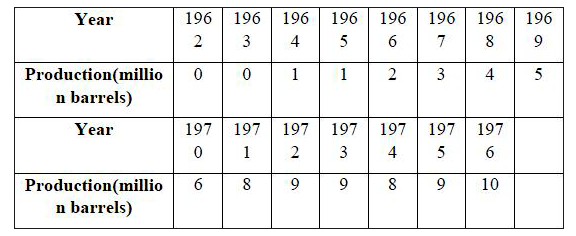
View SolutionThe following table shows the production of gasoline in U.S.A. for the years 1962 to 1976. Obtain trend values for the above data using 5-yearly moving averages.
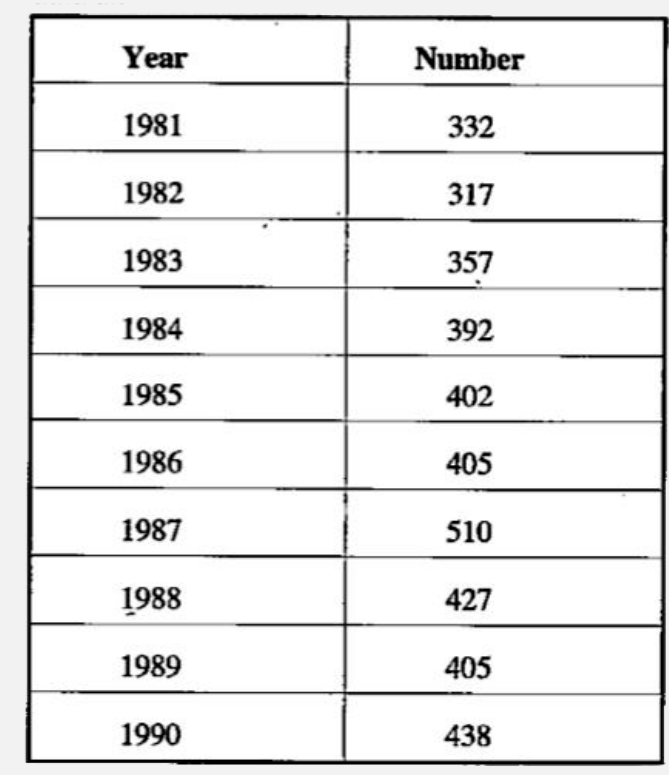
View SolutionCalculate the 5 yearly moving averages of the number of students in a College from the following data and plot them on a graph paper :
View SolutionThe number of road accidents in the city due to rash driving over a period of 3 years, is given in the following table :
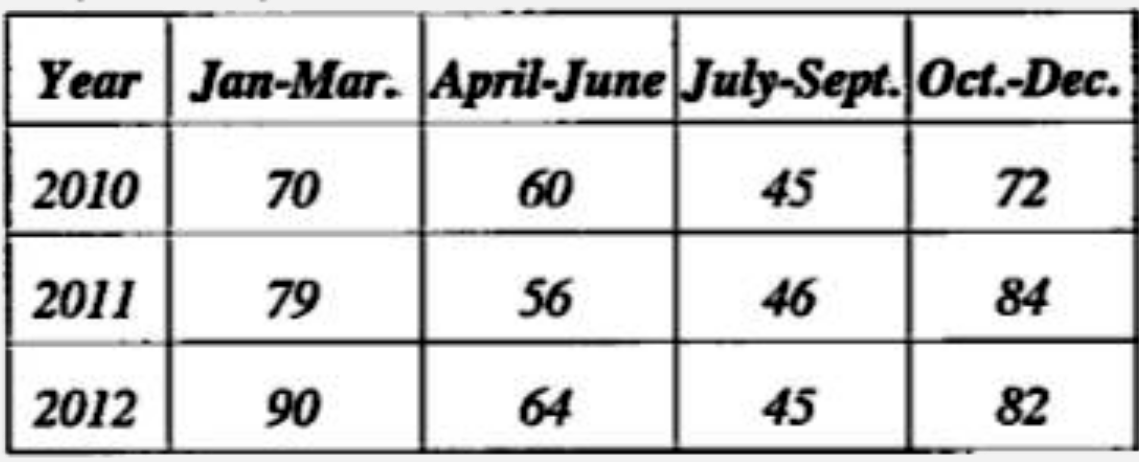
Calculate four quarterly moving averages and illustrate them and original figures on one graph using the same axes for both.
View SolutionThe following table gives the number of failures of commercial industries in a country during the year 1975 to 1990

Draw a graph illustrating these figures. Calculate the 4 yearly moving averages and plot them on the same graph.
View SolutionThe following table gives the numbers of failures of commercial industries in a country during the years 2000 to 2015.

Draw a graph illustrating these figure.
Calculate the 4 yearly moving averages and plot them on the same graph.
View SolutionUsing the following data. Find out the trend using Quarterly moving average and plot them on graph

View SolutionIn a typhoid epidemic ,the number of cases diagnosed were as follows. Calculate 6 days moving average and display them and the original figures on the same graph.

View SolutionThe quarterly profits of a small scale industry (in thousands of rupees) is as follows:
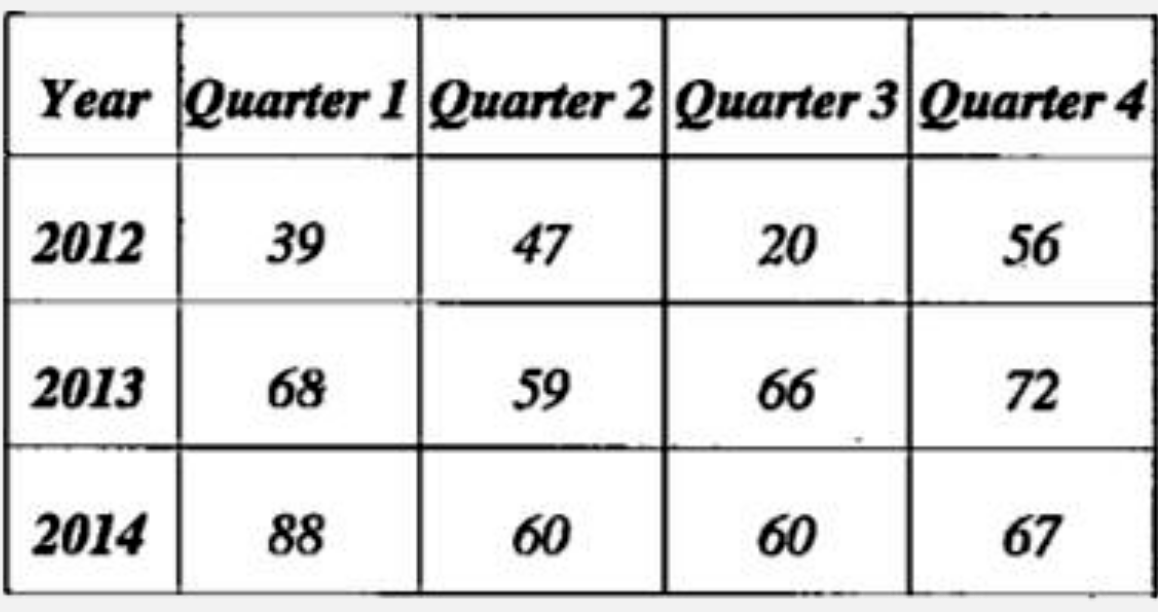
Calculate four quarterly moving averages. Display these and the original figures graphically on the same graphs sheet.
View Solution
