The annual incomes of a firm were recorded every quarter for 4 years. The results are shown in this table.

(iii) Comment on how the firm's incomes have changed over the 4-years.
The correct Answer is:The data have been smoothed out. It shows a steady increase in takings.
Topper's Solved these Questions
- MOVING AVERAGEBOOK - ICSECHAPTER - MOVING AVERAGEEXERCISE - CHAPTER TEST
5 Videos
- MOVING AVERAGEBOOK - ICSECHAPTER - MOVING AVERAGEEXERCISE - CHAPTER TEST
5 Videos
- MODEL TEST PAPERS 01BOOK - ICSECHAPTER - MODEL TEST PAPERS 01EXERCISE - Section C
8 Videos
- PARABOLABOOK - ICSECHAPTER - PARABOLAEXERCISE - CHAPTER TEST
8 Videos
Similar Questions
The table shows income and expenditure of a person for 3 years
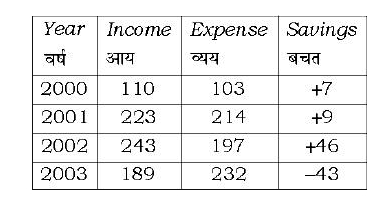
In the given table, if a person invested his savings every year at 8% simple interest, how much interest will he earn at the end of 2003
View SolutionKumar, Gupta and Kavita were partners in a firm sharing-profits and losses equally. The firm was engaged in the storage and distribution of canned juice and its godowns were located at three different places in the city. Each godown was being managed individually by Kumar, Gupta and Kavita. Because of increase in business activities at the godown managed by Gupta, he had to devote more time. Gupta demanded that his share in the profits of the firm be increased, to which Kumar and Kavita agreed. The profit-sharing ratio was to be 1: 2: 1 . For this purpose, goodwill of the firm was valued at two year's purchase of the average profits of last five years. The profits of the last five years were as follows:

You are required to :
(a) Calculate the goodwill of the firm .
(b) Pass necessary Jourbal entry for the treatment of goodwill on change in profits-sharing ratio of Kumar , Gupta and kavita.
View Solution
Knowledge Check
The bar graph given below represents the revenue of a firm for 8 years. All the revenue figures have been shown in terms of Rs. crores.
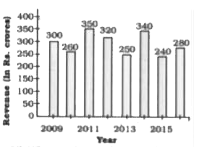
In how many years, the revenue of the firm is less than the average revenue for these 8 years ?A3B4C5D6The bar graph given below represents the revenue of a firm for 8 years. All the revenue figures have been shown in terms of Rs. crores.
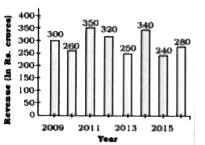
By what percentage has the revenue of the firm decreased in 2010 with respect to the last year ?A15.38B14.44C11.11D13.33The bar graph given below represents the revenue of a firm for 8 years. All the revenue figures have been shown in terms of Rs. crores.
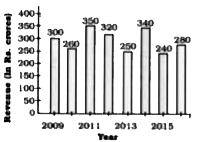
What is the total value of revenue of the firm (in Rs. crores) in years 2010, 2011 and 2012?A910B930C950D1020
During the last four years a doctor has shown annual growth of his income as given below:
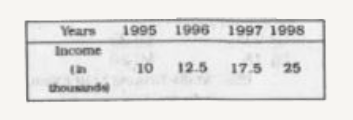
What would be his income growth in 1999?
View SolutionThe annual incomes of two persons are in the ratio 9:7 and their expenses are in the ratio 4:3. If each of them saves Rs. 2,000 per year, what is the difference in their annual incomes?
View SolutionThe bar graph given below represents the revenue of a firm for 8 years. All the revenue figures have been shown in terms of Rs. crores.
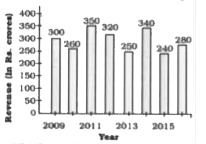
In which year the firm has shown maximum percentage with respect to the previous year ?
View SolutionThe annual income of A and B are in the ratio 4:3 and the ratio of their expenditures is 3:2. If each of them saves Rs 600 in the year, the annual income of A is:
View SolutionStudy the following graph which shows income and expenditure of a company over the years 2005 - 2009 and answer the questions.
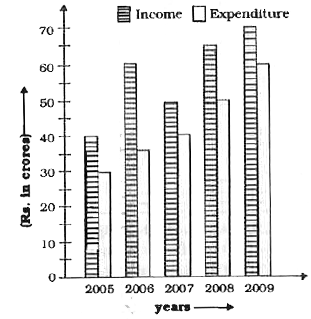
In how many years was the income of the company less than the average income of the given years ?
View Solution
