Find the 4-quarterly moving averages in the following table which gives the quarterly index numbers of coal production (for the years 1936 - 1938). Also plot on the same graph the quarterly index numbers as well as the 4-quarterly moving average. Comment on the nature of the general trend.

The correct Answer is:86.4,86.525,89.175,90.425,91.575,92.525,90,88.125,87.025.
Topper's Solved these Questions
- MOVING AVERAGEBOOK - ICSECHAPTER - MOVING AVERAGEEXERCISE - CHAPTER TEST
5 Videos
- MOVING AVERAGEBOOK - ICSECHAPTER - MOVING AVERAGEEXERCISE - CHAPTER TEST
5 Videos
- MODEL TEST PAPERS 01BOOK - ICSECHAPTER - MODEL TEST PAPERS 01EXERCISE - Section C
8 Videos
- PARABOLABOOK - ICSECHAPTER - PARABOLAEXERCISE - CHAPTER TEST
8 Videos
Similar Questions
The following table gives the number of failures of commercial industries in a country during the year 1975 to 1990

Draw a graph illustrating these figures. Calculate the 4 yearly moving averages and plot them on the same graph.
View SolutionThe following table gives the numbers of failures of commercial industries in a country during the years 2000 to 2015.

Draw a graph illustrating these figure.
Calculate the 4 yearly moving averages and plot them on the same graph.
View SolutionCalculate 4- yearly moving averages of the following time series of steel production :

Plot these and the original figures in the same graph.
View SolutionUsing the following data. Find out the trend using Quarterly moving average and plot them on graph

View SolutionThe following is a record of the rquarterly electrickty bill for 3 years for a household (to the nearest Rupees):

Plot these and four quarterly moving averages.
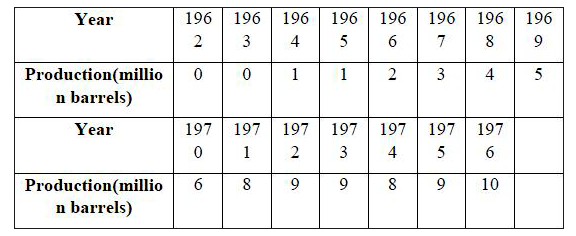
View SolutionThe following table shows the production of gasoline in U.S.A. for the years 1962 to 1976. Obtain trend values for the above data using 5-yearly moving averages.

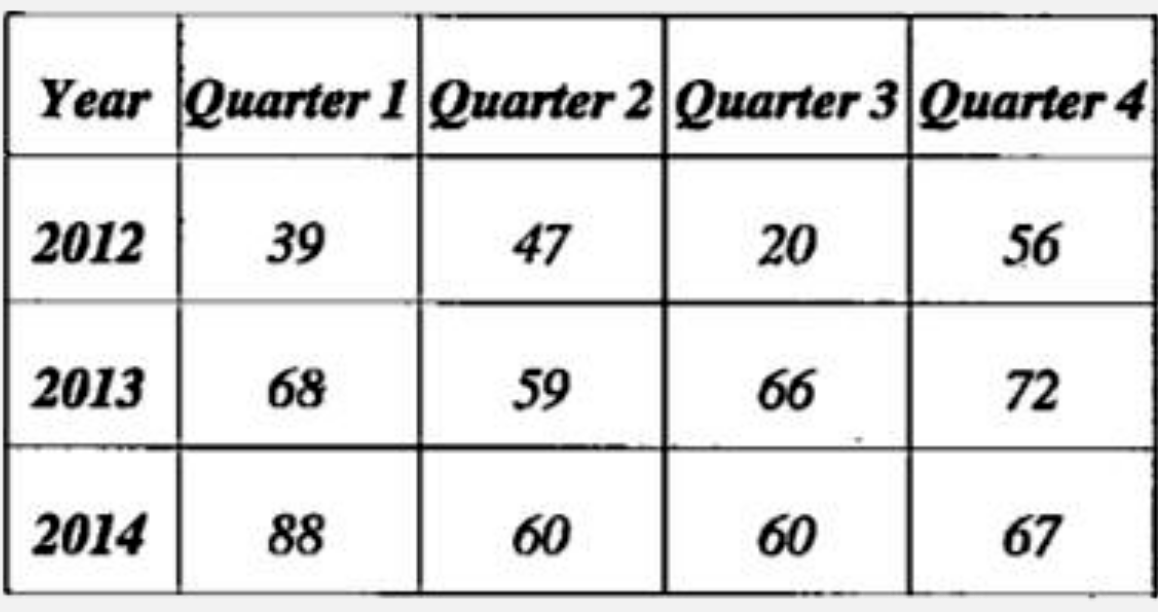
View SolutionThe table below gives details of the electricity generated in kilowatt hours in each quarter for the years 2012 to 2014

Calculate the four-quarterly moving averages and display these and the original figures on the same graph .
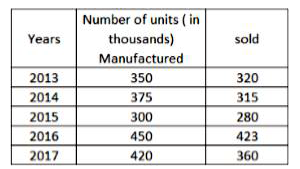
View SolutionStudy the following table, which shows the number of units of a product manufactured and sold by a company in five years, and answer questions.

In which year the number of units of the product sold is 19000 more than the average number of units manufactured per year?
View SolutionThe quarterly profits of a small scale industry (in thousands of rupees) is as follows:

Calculate four quarterly moving averages. Display these and the original figures graphically on the same graphs sheet.
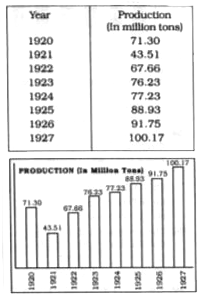
View SolutionThe following table shows the worldwide production of steel in 1920-1927. Study the table and answer the questions.

The number of years during which the company has its production less than the average production during 1920-1927 is approximately
View Solution
