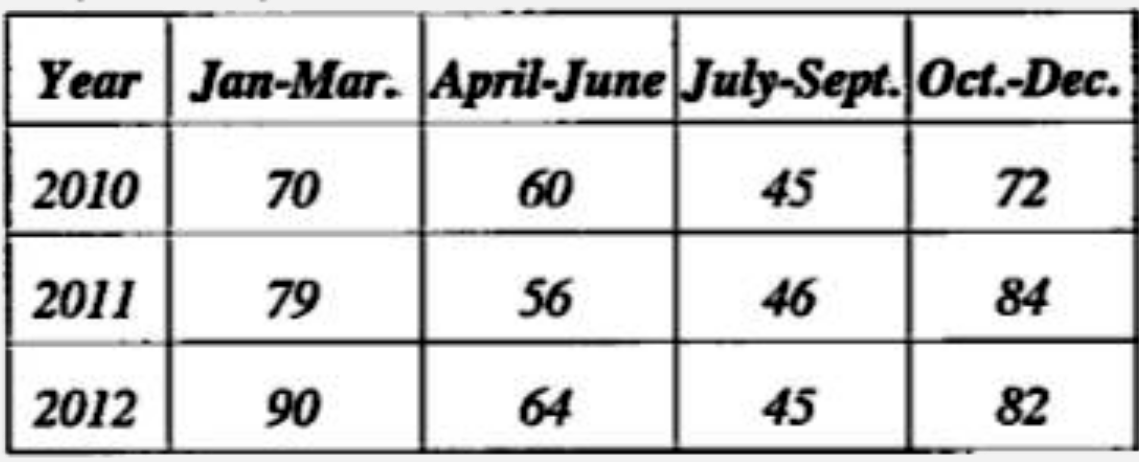
The table below given details of the electricity generated in million kilowatt hours for public supply in each quarter of the years 1952 to 1955.

Draw a graph illustrating these figures.
Calculating a set of moving averages using the most suitable number of observations, give reasons of your choice. On the same diagram as before draw a graph showing the moving averages.
The correct Answer is:We shall find 4-quarterly moving averages as it will elimanate the 12-monthly cycle and leave the general trend of the data.
1952 Quarter 3 →8.15,4→8.35; ' 53 Quarter 1 →8.45,2→8.65,3→r9.00,4→9.20; ' 54 Quarters 1→9.35,2→9.55,3→9.70,4→9.90; ' 55 Quarter 1→10.15,2→10.40.
Topper's Solved these Questions
- MOVING AVERAGEBOOK - ICSECHAPTER - MOVING AVERAGEEXERCISE - CHAPTER TEST
5 Videos
- MOVING AVERAGEBOOK - ICSECHAPTER - MOVING AVERAGEEXERCISE - CHAPTER TEST
5 Videos
- MODEL TEST PAPERS 01BOOK - ICSECHAPTER - MODEL TEST PAPERS 01EXERCISE - Section C
8 Videos
- PARABOLABOOK - ICSECHAPTER - PARABOLAEXERCISE - CHAPTER TEST
8 Videos
Similar Questions
The table below gives details of the electricity generated in kilowatt hours in each quarter for the years 2012 to 2014

Calculate the four-quarterly moving averages and display these and the original figures on the same graph .
View SolutionThe following table gives the number of failures of commercial industries in a country during the year 1975 to 1990

Draw a graph illustrating these figures. Calculate the 4 yearly moving averages and plot them on the same graph.
View SolutionThe following table gives the numbers of failures of commercial industries in a country during the years 2000 to 2015.

Draw a graph illustrating these figure.
Calculate the 4 yearly moving averages and plot them on the same graph.
View SolutionThe table given below shows the number of visitors (in hundreds) to a certain exhibition over a period of two weeks:

Calculate 6-day moving averages and illustrate these and original information on the same graph using the some scales.
View SolutionThe table given below shows the number of visitors ( in hundreds ) to a certain exhibition over a period of two weeks :

Calculate the 7 day moving averages and illustrate these and the original information on the same table.
View SolutionThe number of road accidents in the city due to rash driving over a period of 3 years, is given in the following table :

Calculate four quarterly moving averages and illustrate them and original figures on one graph using the same axes for both.
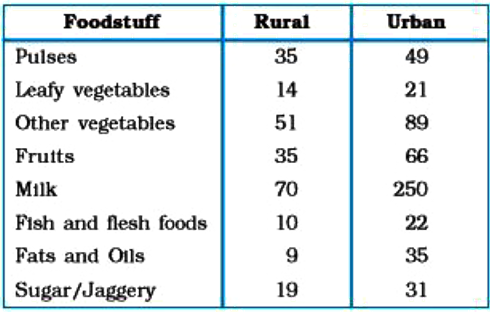
View SolutionThe following table shows the average intake of nutrients in calories by rural and urban groups in a particular year. Using a suitable scale for the given data, draw a double bar graph to compare the data.

View SolutionObserve the toothpick pattern given below:

(a) Imagine that this pattern continues. Complete the table to show the number of toothpicks in the first six terms.

(b) Make a graph by taking the pattern numbers on the horizontal axis and the number of toothpicks on the vertical axis. Make the horizontal axis from 0 to 10 and the vertical axis from 0 to 30.
(c) Use your graph to predict the number of toothpicks in patterns 7 and 8. Check your answers by actually drawing them.
(d) Would it make sense to join the points on this graph? Explain.
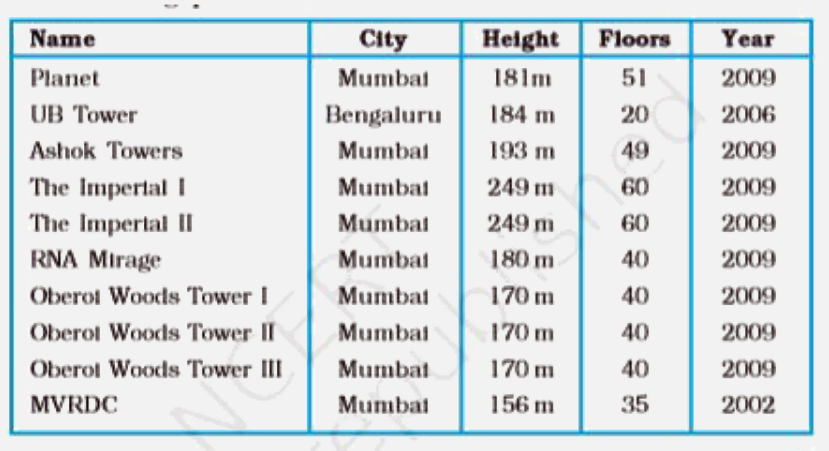
View SolutionBelow is a list of 10 tallest buildings in India.
This list ranks buildings in India that stand at least 150m (492 ft.) tall, based on standard height measurement. This includes spires and architectural details but does not include antenna marks. Following data is given as per the available information till 2009. Since new buildings are always under construction, go on-line to check new taller buildings.
Use the information given in the table about sky scrapers to answer the following questions:

(a) Find the height of each storey of the three tallest buildings and write them in the following table:

(b) The average height of one storey for the buildings given in (a) is
(c) Which city in this list has the largest percentage of skyscrappers? What is the percentage?
(d) What is the range of data?
(e) Find the median of the data.
(f) Draw a bar graph for given data.
View SolutionRead the passage given below and answer the questions that follow:
In praise of taswir
Abu'l Fazl held the art of painting in high esteem:
Drawing the likeness of anything is called taswir. His Majesty from his earliest youth, has shown a great predilection for this art, and gives it every encouragement, as he looks upon it as a means both of study and amusement. A very large number of painters have been set to work. Each week, several supervisors and clerks of the imperial workshop submit before the emperor the work done by each artist, and His Majesty gives a reward and increases the Majesty gives a reward and increasesthe monthly salaries of the artists according to the excellence displayed. Most excellent painters are now to be found, and masterpieces, worthy of a Bihzad, may be placed at the side of the wonderful works of the European painters who have attained worldwide fame. The minuteness in detail, the general finish and the boldness of execution now observed in pitchers are incomparable, even inanimate objects look as if they have life. More than a hundred painters have become famous masters of the art. This is especially true of the Hindu Artists. Their pitures surpass our conception of things. Few, indeed, in the whole world are found equal to them.
(i) What is a taswir?
View Solution
