The following table shows the daily sales of milk at a local corner shop for a month.

Make a table showing the moving average using a 7-day span, and draw a graph to show the trend of milk sales over the month.
The correct Answer is:Moving average : 9.3,9.1,9.0,9.1,8.7,8.6,9.1,9.0,9.4,9.7,9.7,9.9,10.1,9.7,9.9,9.4,9.9,10.0,10.0,9.9,10.1,10.6.
Topper's Solved these Questions
- MOVING AVERAGEBOOK - ICSECHAPTER - MOVING AVERAGEEXERCISE - CHAPTER TEST
5 Videos
- MOVING AVERAGEBOOK - ICSECHAPTER - MOVING AVERAGEEXERCISE - CHAPTER TEST
5 Videos
- MODEL TEST PAPERS 01BOOK - ICSECHAPTER - MODEL TEST PAPERS 01EXERCISE - Section C
8 Videos
- PARABOLABOOK - ICSECHAPTER - PARABOLAEXERCISE - CHAPTER TEST
8 Videos
Similar Questions
Knowledge Check
The following table shows the daily earnings of 45 skilled workers: How many workers earn less than ₹ 1,100 in a day?
निम्नलिखित तालिका 45 कुशल श्रमिकों की दैनिक आय को दर्शाती है |
कितने श्रमिक एक दिन में 1,100 रुपये से कम कमाते हैं ?A29B10C39D43
The following table shows the birth months of 48 babies in a hospital:

Find the probability of months in which 6 babies were born
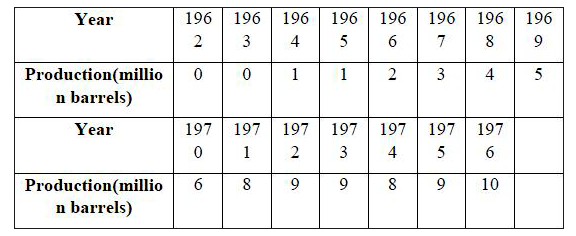
View SolutionThe following table shows the production of gasoline in U.S.A. for the years 1962 to 1976. Obtain trend values for the above data using 5-yearly moving averages.
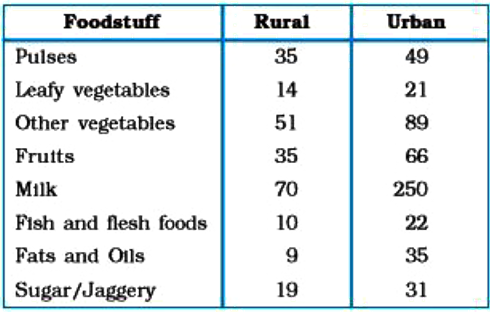
View SolutionThe following table shows the average intake of nutrients in calories by rural and urban groups in a particular year. Using a suitable scale for the given data, draw a double bar graph to compare the data.
View SolutionThe given bar graph shows the sale of different brands of shirts in a shop in one month.
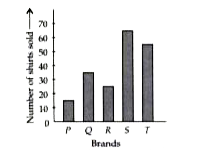
(i) How many total shirts are sold in the month ?
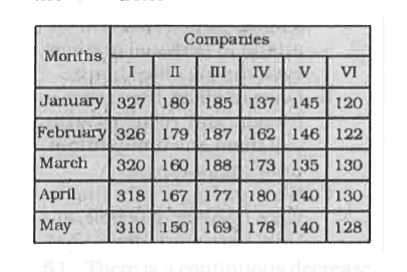
View SolutionThe following table shows the production of fertilizers (in lakh tonne) by six companies for 5 months (January to May). Study the table and answer the questions.
There is a continuous decrease in production over the months in:
View SolutionThe table below shows the sales of milk in six different states as a percentage of total sales. In each state only two milkmen A and B sell the milk. The table below shows the sales of salesman A as percentage of total sale of milk in each state. The total sales of milk is 200000 litres.
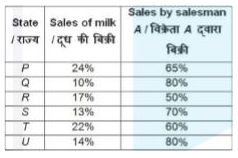
What are the average sales of milk (in litres) by the salesmen A in all the given states?
View SolutionThe table below shows the sales of milk in six different states as a percentage of total sales. In each state only two milkmen A and B sell the milk. The table below shows the sales of salesman A as percentage of total sale of milk in each state. The total sales of milk is 200000 litres.
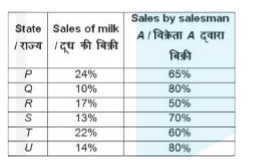
What will be the central angle (in degrees) formed by the average sale of milk in state Q, T and S together?
View Solution

