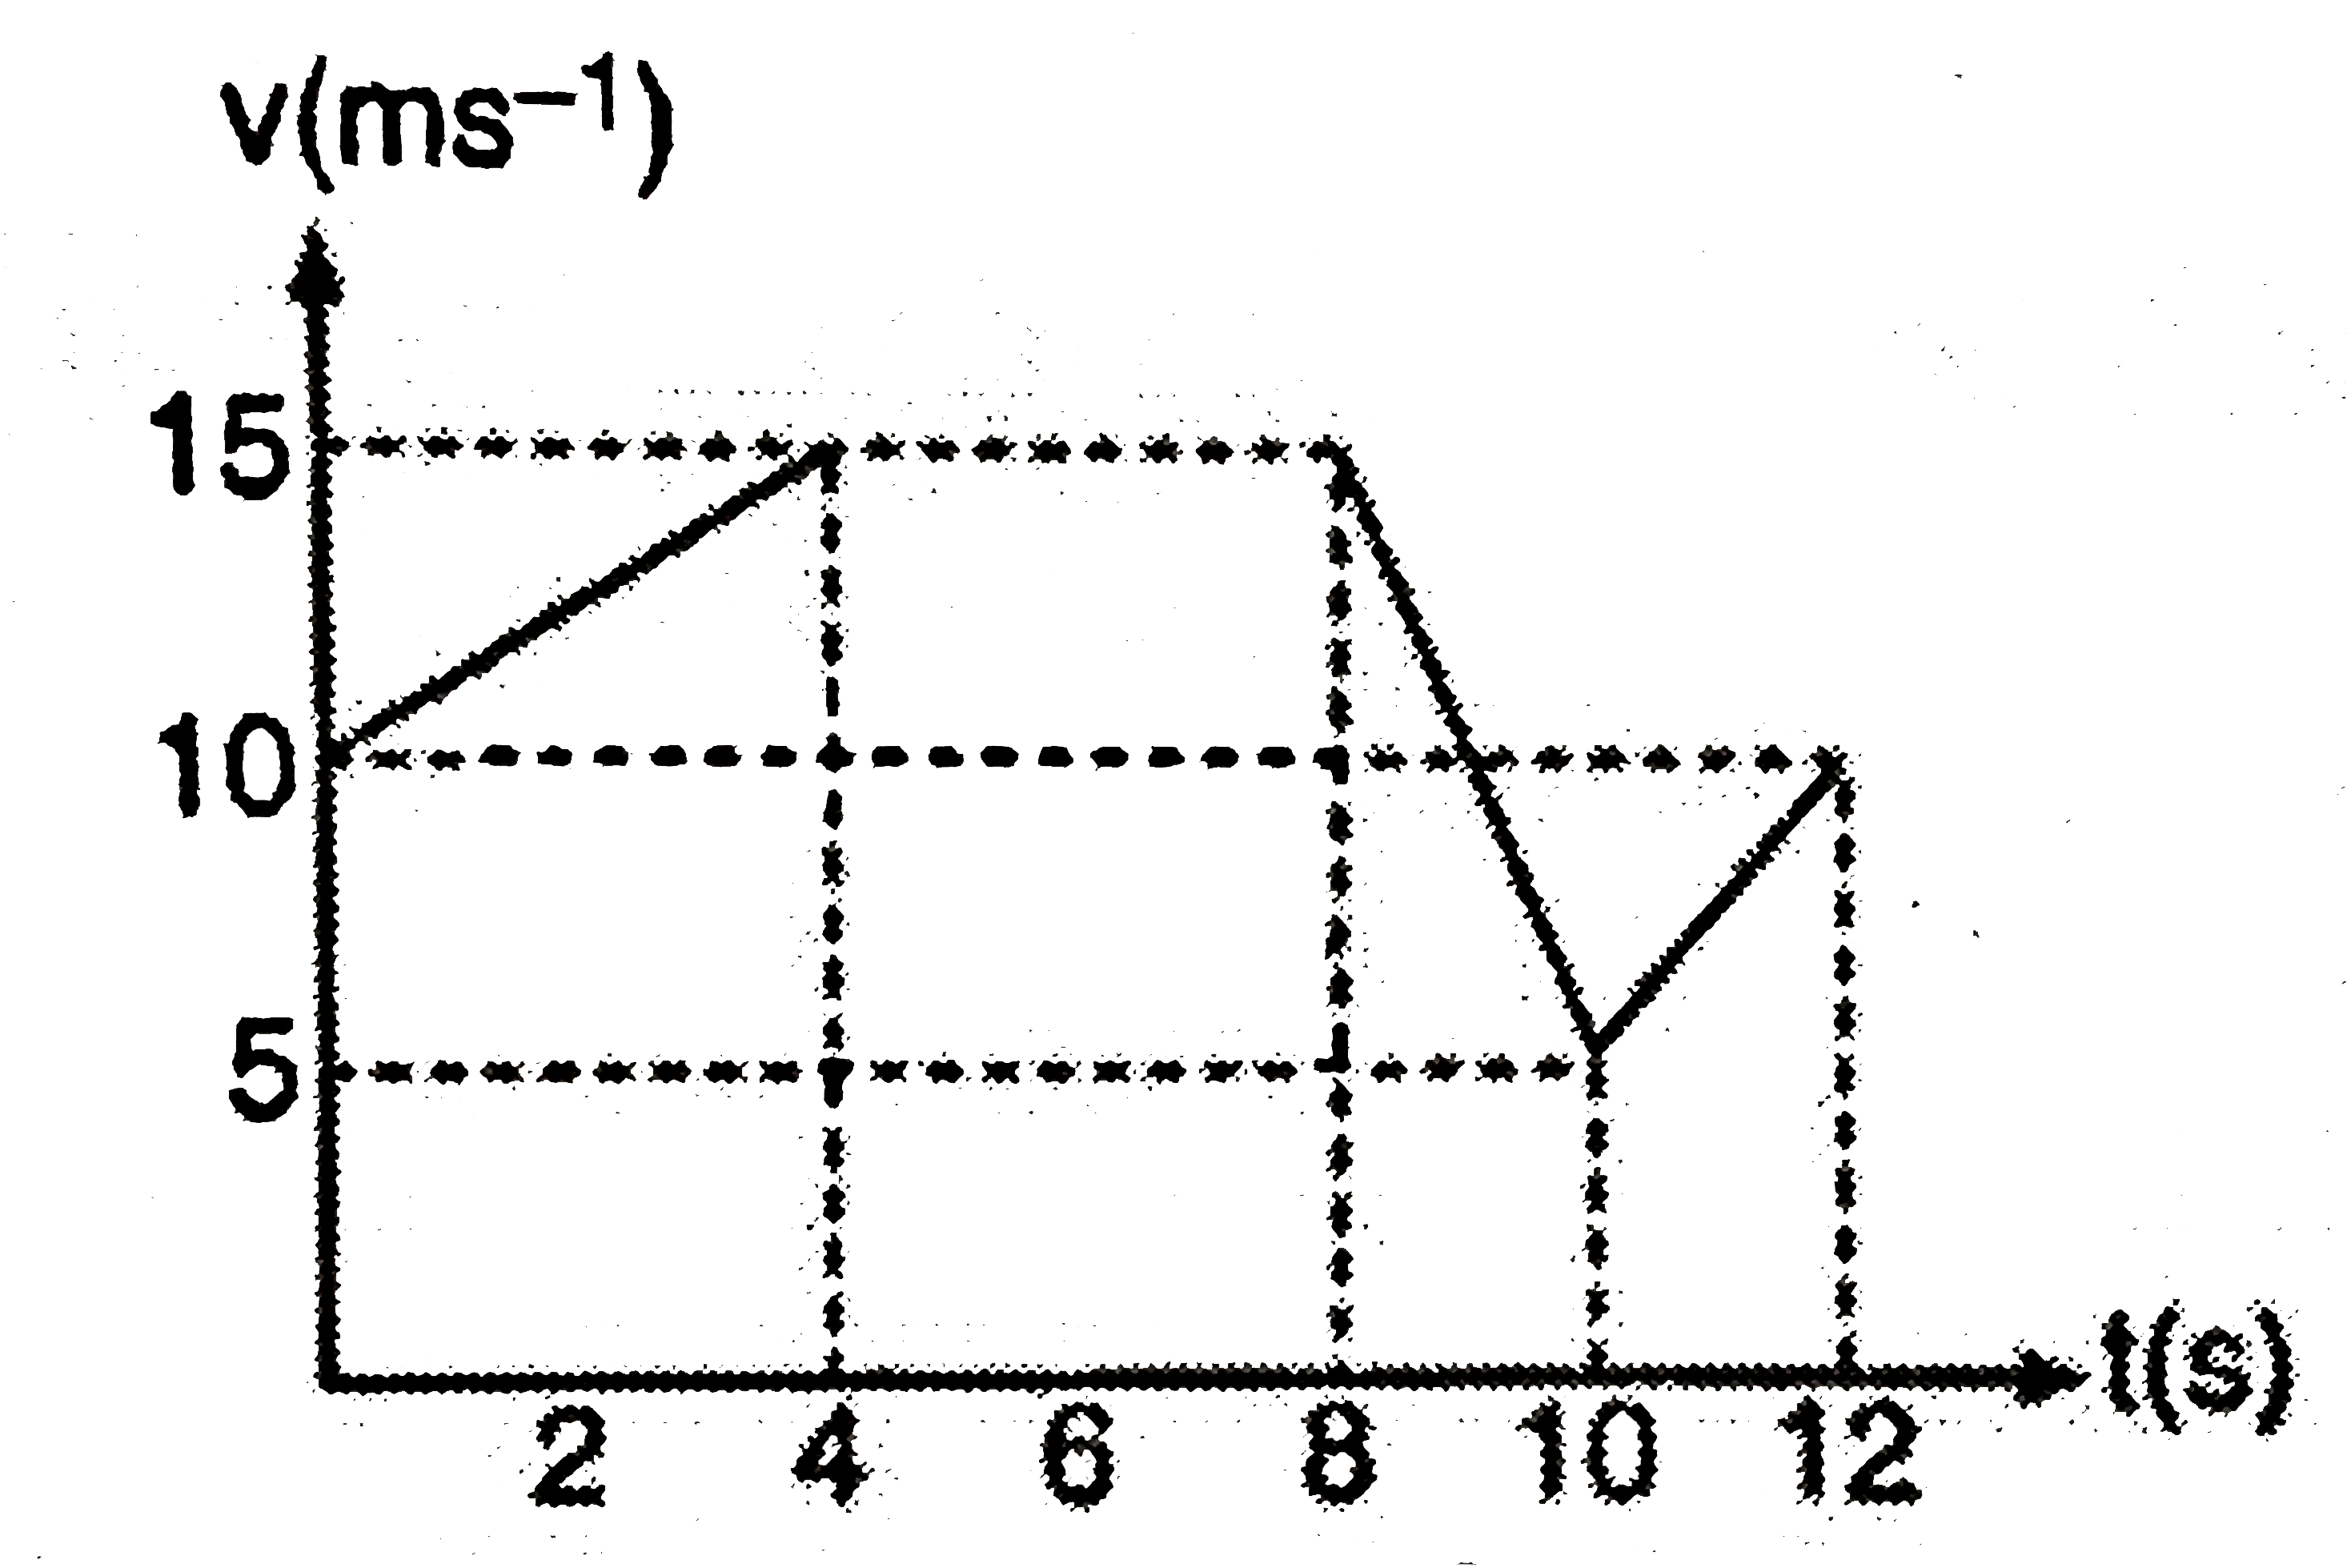
The figure represents the momentum time (p−t) curve for a particle moving along an axis under the influence of the force.Identify the regions on the graph where the magnitude of the force is maximum and minimum respectively? If (t3−t2)t1
c and b
a and b
b and c
c and a
The correct Answer is:A
To solve the problem, we need to analyze the momentum-time (p-t) curve and determine the regions where the force acting on the particle is at its maximum and minimum. The relationship between force and momentum is given by Newton's second law, which states that force is equal to the rate of change of momentum with respect to time.
1. Understanding the p-t Curve:
- The momentum-time curve shows how the momentum of the particle changes over time. The slope of this curve at any point gives the force acting on the particle at that moment.
2. Identifying the Slope:
- According to Newton's second law, the force F can be expressed as:
F=dpdt
- This means that the force is equal to the slope of the momentum-time curve.
3. Finding Maximum and Minimum Force:
- To find where the force is maximum, we need to look for the region on the curve where the slope is the steepest (i.e., the greatest positive value).
- Conversely, to find where the force is minimum, we look for the region where the slope is the least steep (i.e., the smallest positive value or the most negative value).
4. Analyzing Regions:
- Let's denote three regions on the curve as A, B, and C.
- By visually inspecting the p-t curve:
- If region C has the steepest slope, then the force is maximum in this region.
- If region B has the least slope, then the force is minimum in this region.
5. Conclusion:
- Therefore, the magnitude of the force is maximum in region C and minimum in region B.
6. Final Expression:
- The answer to the question is:
- Maximum force: Region C
- Minimum force: Region B
- The momentum-time curve shows how the momentum of the particle changes over time. The slope of this curve at any point gives the force acting on the particle at that moment.
- According to Newton's second law, the force F can be expressed as:
F=dpdt
- This means that the force is equal to the slope of the momentum-time curve.
- To find where the force is maximum, we need to look for the region on the curve where the slope is the steepest (i.e., the greatest positive value).
- Conversely, to find where the force is minimum, we look for the region where the slope is the least steep (i.e., the smallest positive value or the most negative value).
- Let's denote three regions on the curve as A, B, and C.
- By visually inspecting the p-t curve:
- If region C has the steepest slope, then the force is maximum in this region.
- If region B has the least slope, then the force is minimum in this region.
- Therefore, the magnitude of the force is maximum in region C and minimum in region B.
- The answer to the question is:
- Maximum force: Region C
- Minimum force: Region B
Topper's Solved these Questions
Similar Questions
Knowledge Check
- Question 1 - Select One
The figure shows a velocity-time graph of a particle moving along a straight line
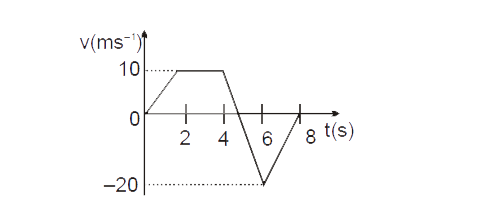
Identify the region in which the rate of change of velocity ∣∣∣Δ¯vΔt∣∣∣ of the particle is maximumA0 to 2sB2 to 4sC4 to 6sD6 t 8 s - Question 2 - Select One
A particle is moving along X-axis under a force such that its position -time graph is as shown in figure.
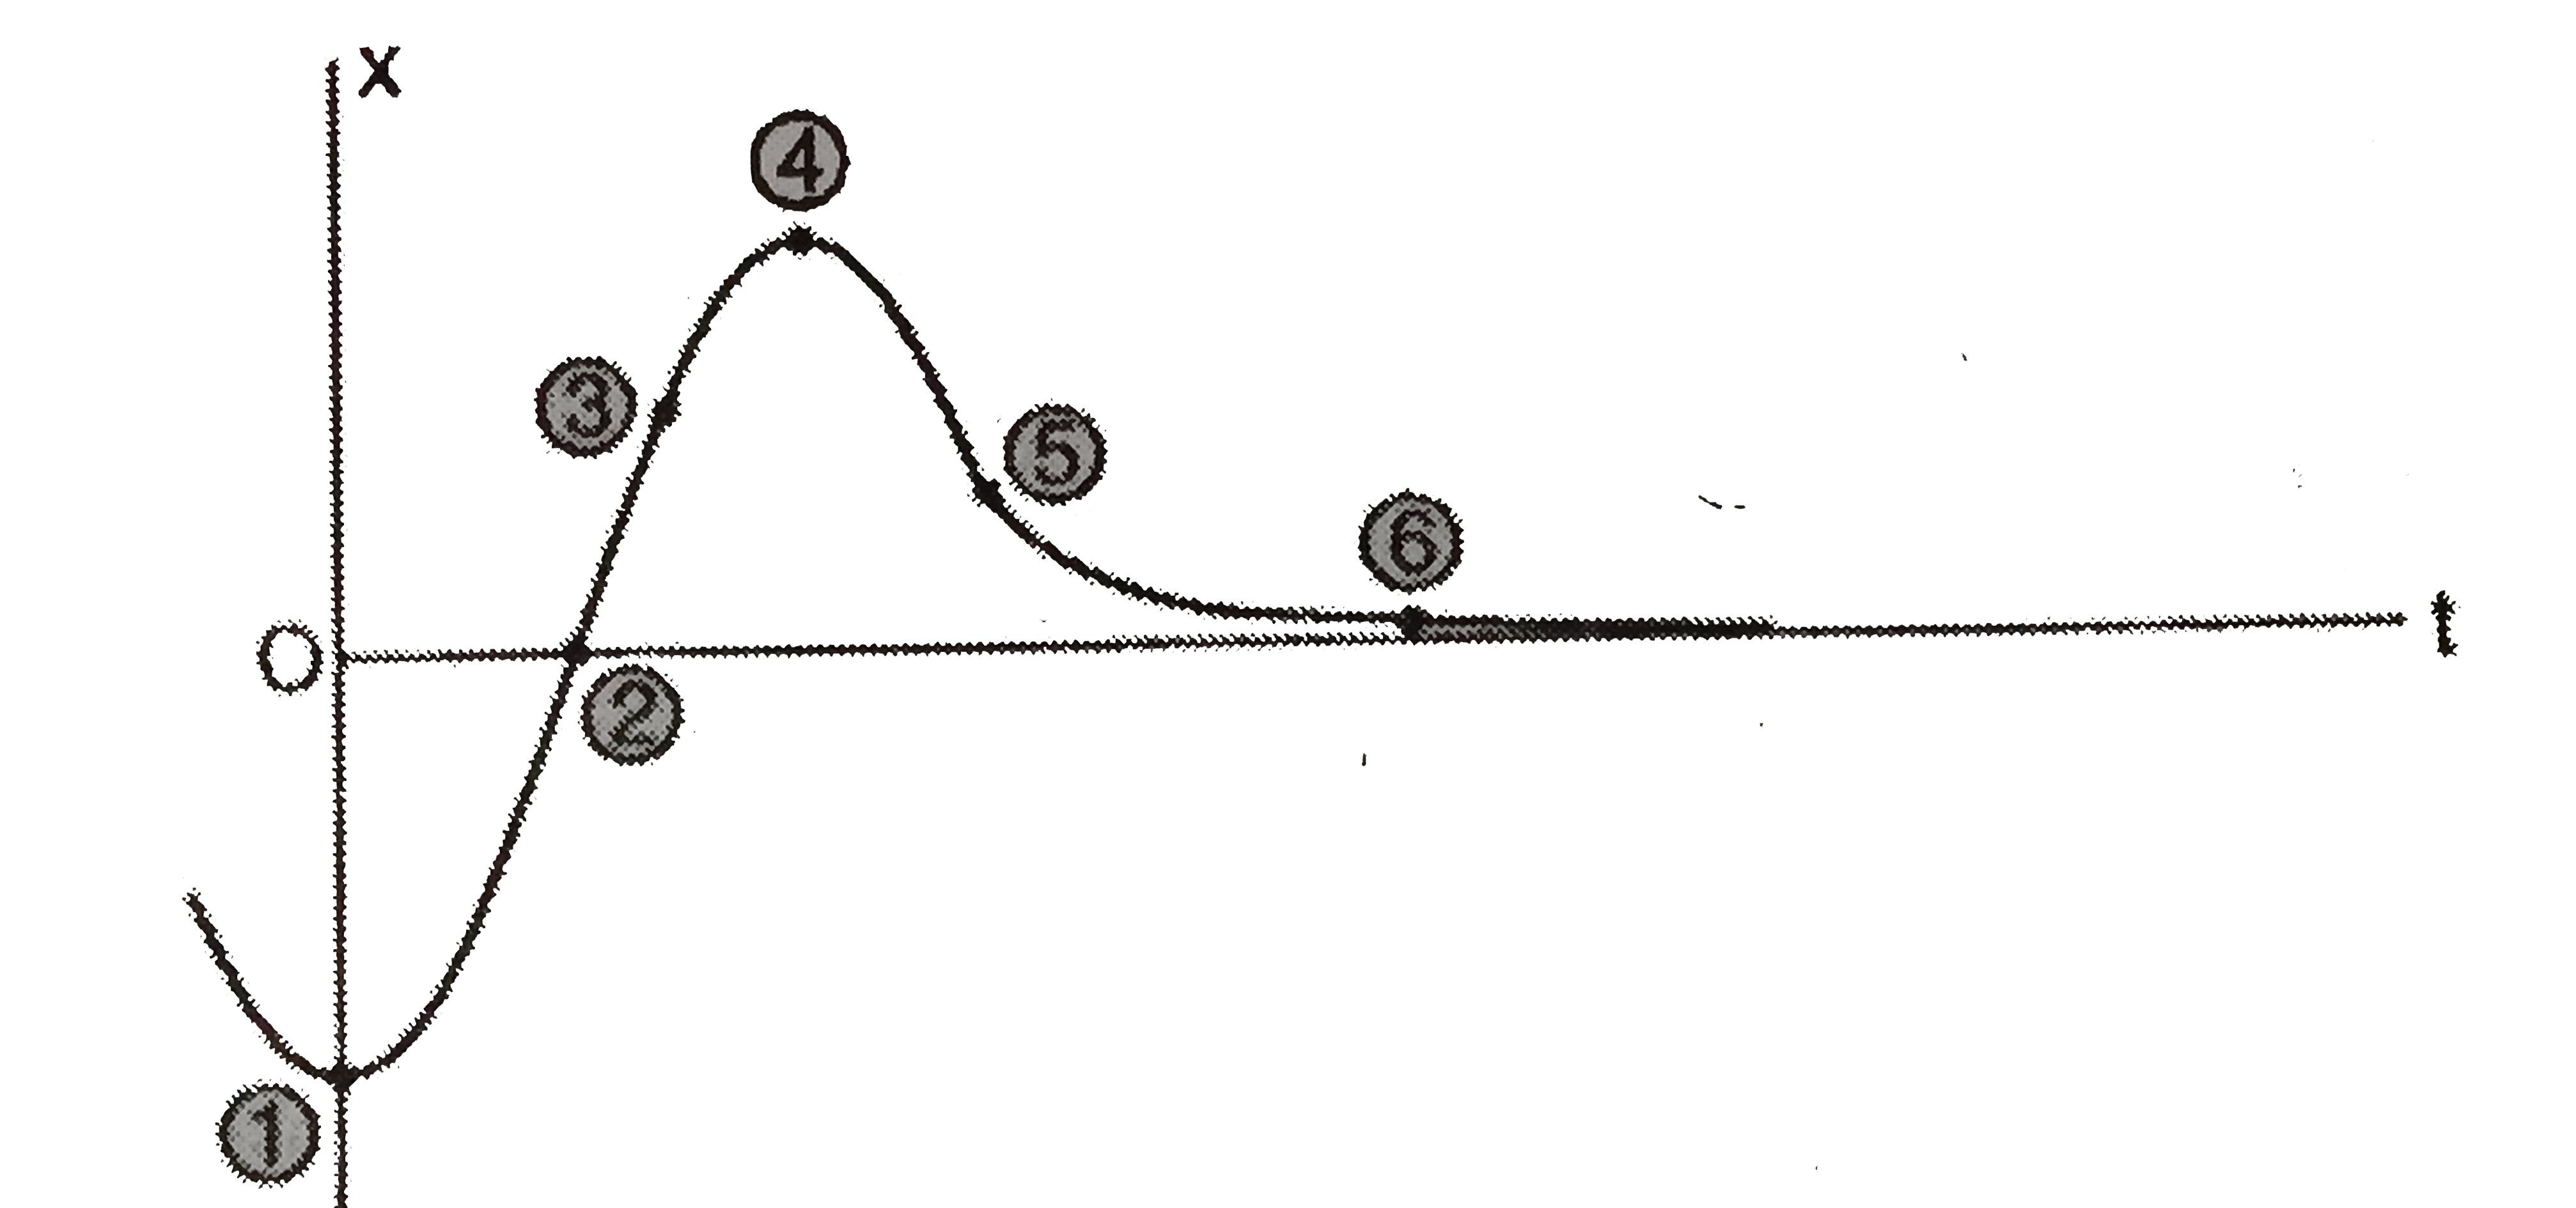
As the particle passes position (3) :Ait is moving along positive X-direction with a maximum speedBit is moving along negative X-direction with a speed that is increasing with timeCit is moving along positive X-direction with a speed that is decreasing with timeDit is moving along negative X-direction with a speed that is decreasing with time - Question 3 - Select One
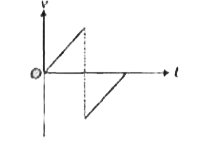
The velocity (v) - time (t) graph for a particle moving along x - axis is shown in the figure. The corresponding position (x) - time (t) is best represented by
 A
A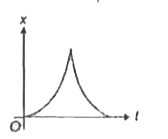 B
B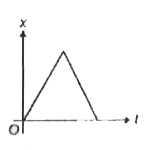 C
C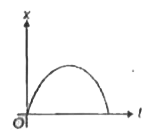 D
D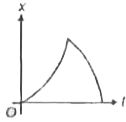
The x-t graph of a particle moving along a straight line is shown in figure
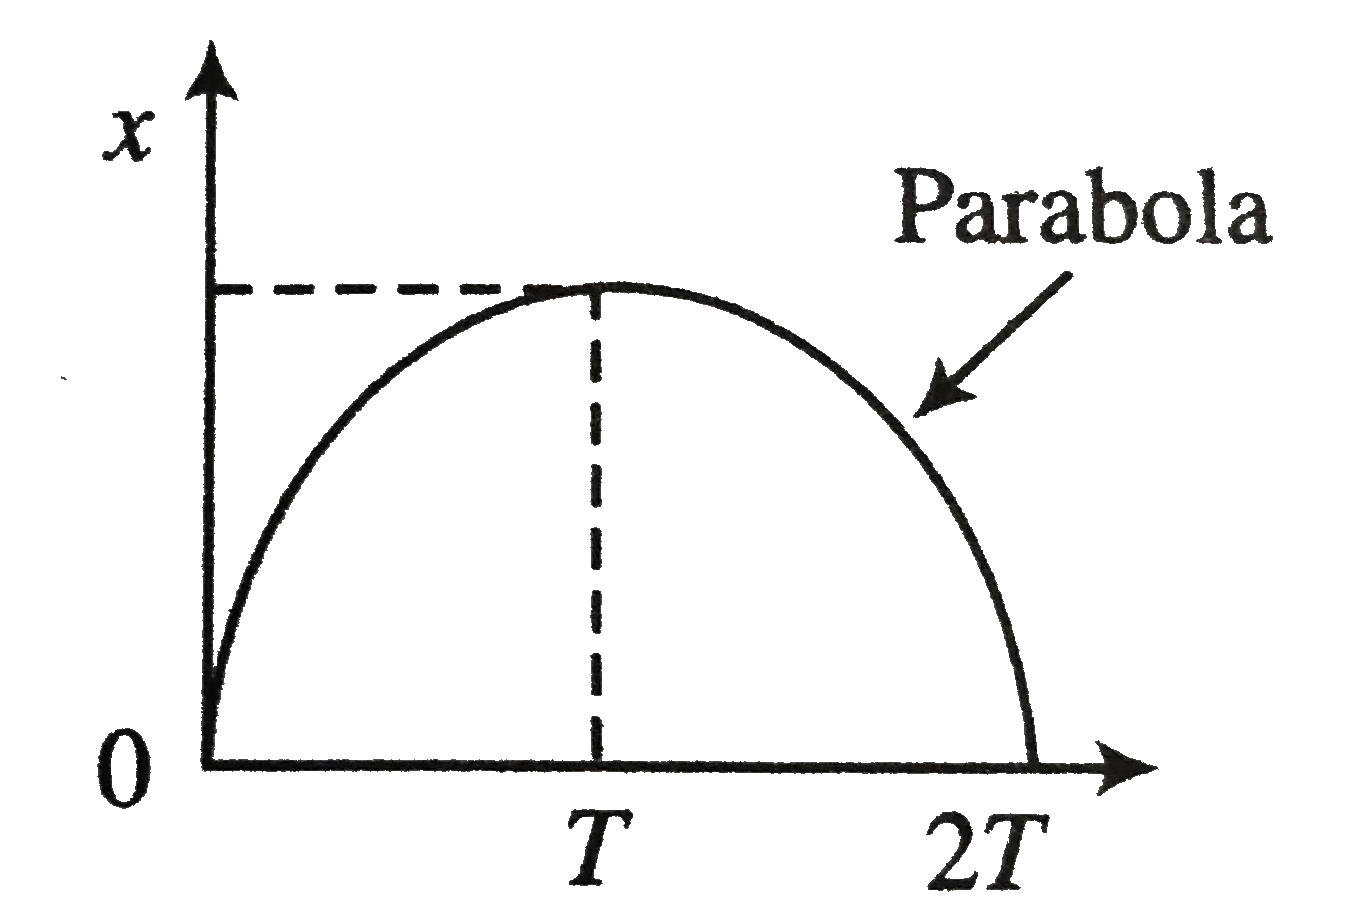
The a-t graph of the particle is correctly shown byView SolutionThe x-t graph of a particle moving along a straight line is shown in figure

The v-t graph of the particle is correctly shown byView SolutionKinetic energy of a particle moving in a straight line varies with time t as K=4t2. The force acting on the particle
View SolutionThe x−t graph of particle moving along a straight line is shown in figure
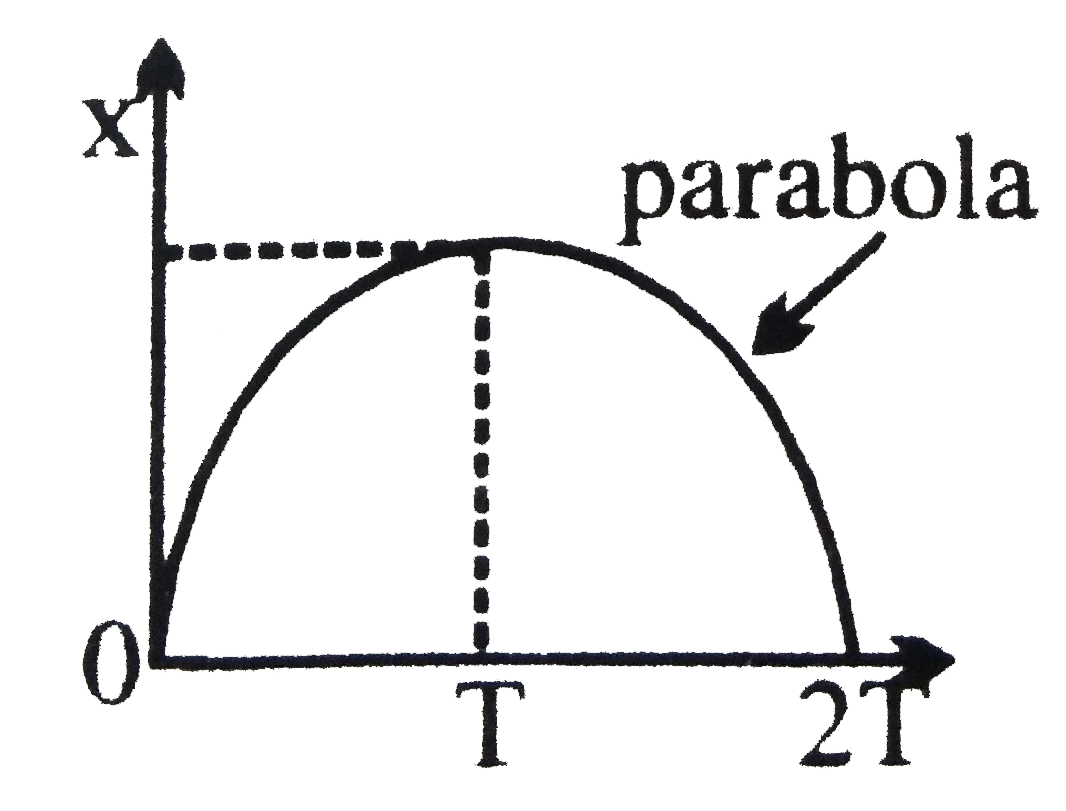
The a−t graph of the particle is correctly shown byView SolutionThe x−t graph of particle moving along a straight line is shown in figure
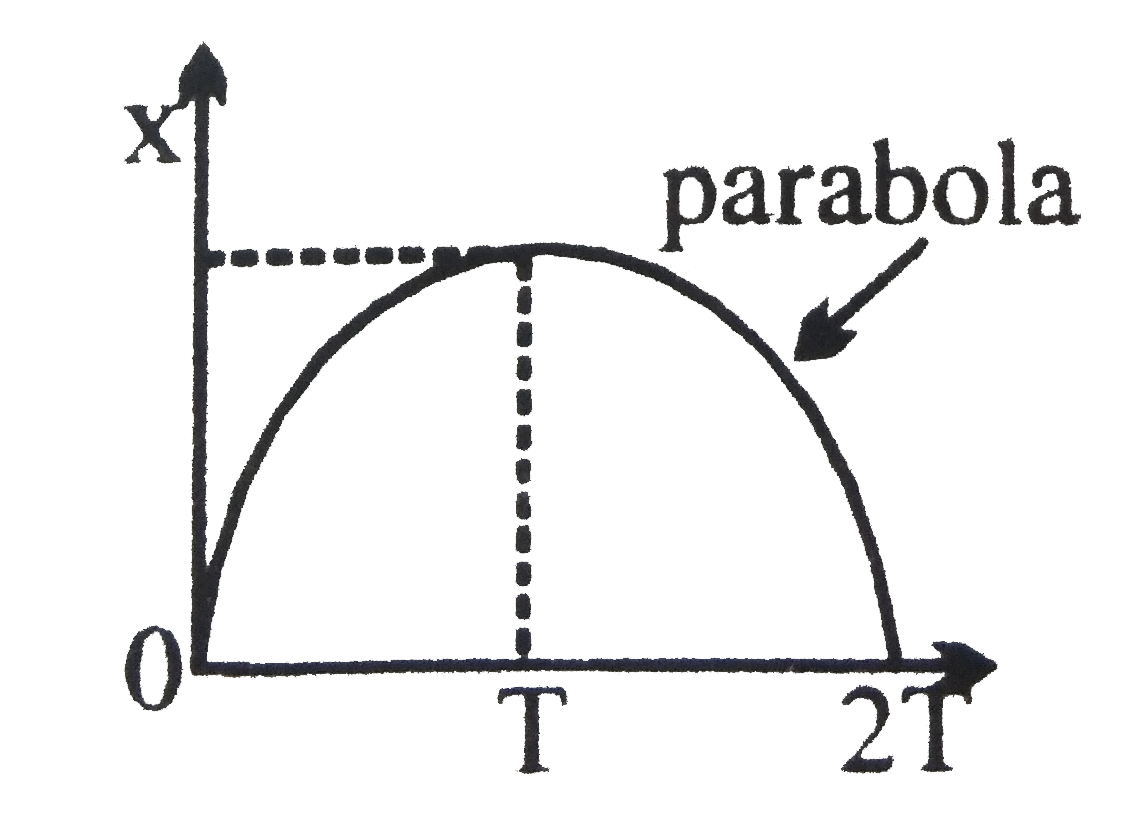
The v−t graph of the particles is correctly shown byView Solution


