Study the bar graph representing the number of
persons in various age groups in a town shown in Figure. Observe the bar graph and answer the following questions:
(i)What is the percentage of the youngest age-group persons over those in the oldest age group?
(ii)What is the total population of the town?
(iii)What is the number of persons in the age group 60-65?
(iv)What is the age-group of exactly 1200 persons living in the town?
(v)What is the total number of persons living in the town in the age group 50-55?
(vi)What is the total number of persons living in the town in the age group 10-15 and 60-65?
To solve the questions based on the bar graph representing the number of persons in various age groups in a town, we will follow these steps:
1. Identify the number of persons in the youngest age group (10-15 years) from the bar graph.
- Youngest age group: 1400 persons
2. Identify the number of persons in the oldest age group (70-75 years) from the bar graph.
- Oldest age group: 300 persons
3. Calculate the percentage using the formula:
Percentage=(Youngest groupOldest group)×100
Percentage=(1400300)×100=1400×100300=140000300=466.67%
(ii) Total population of the town:
1. Add the number of persons in all age groups as represented in the bar graph:
- Age groups and their respective counts:
- 10-15: 1400
- 20-25: 1200
- 30-35: 1100
- 40-45: 1000
- 50-55: 900
- 60-65: 800
- 70-75: 300
2. Calculate the total:
Total=1400+1200+1100+1000+900+800+300=6700
(iii) Number of persons in the age group 60-65:
1. From the bar graph, identify the number of persons in the age group 60-65.
- Age group 60-65: 800 persons
(iv) Age group of exactly 1200 persons living in the town:
1. Check the bar graph for the age group that has exactly 1200 persons.
- Age group: 20-25
(v) Total number of persons living in the town in the age group 50-55:
1. From the bar graph, identify the number of persons in the age group 50-55.
- Age group 50-55: 900 persons
(vi) Total number of persons living in the town in the age group 10-15 and 60-65:
1. Identify the number of persons in both age groups:
- Age group 10-15: 1400 persons
- Age group 60-65: 800 persons
2. Add the two values:
Total=1400+800=2200
Summary of Answers:
1. Percentage of youngest age group over oldest age group: 466.67%
2. Total population of the town: 6700
3. Number of persons in the age group 60-65: 800
4. Age group of exactly 1200 persons: 20-25
5. Total number of persons in the age group 50-55: 900
6. Total number of persons in the age group 10-15 and 60-65: 2200
- Youngest age group: 1400 persons
2. Identify the number of persons in the oldest age group (70-75 years) from the bar graph.
- Oldest age group: 300 persons
3. Calculate the percentage using the formula:
Percentage=(Youngest groupOldest group)×100
Percentage=(1400300)×100=1400×100300=140000300=466.67%
- Age groups and their respective counts:
- 10-15: 1400
- 20-25: 1200
- 30-35: 1100
- 40-45: 1000
- 50-55: 900
- 60-65: 800
- 70-75: 300
2. Calculate the total:
Total=1400+1200+1100+1000+900+800+300=6700
- Age group 60-65: 800 persons
- Age group: 20-25
- Age group 50-55: 900 persons
- Age group 10-15: 1400 persons
- Age group 60-65: 800 persons
2. Add the two values:
Total=1400+800=2200
1. Percentage of youngest age group over oldest age group: 466.67%
2. Total population of the town: 6700
3. Number of persons in the age group 60-65: 800
4. Age group of exactly 1200 persons: 20-25
5. Total number of persons in the age group 50-55: 900
6. Total number of persons in the age group 10-15 and 60-65: 2200
Topper's Solved these Questions
Similar Questions
Study the bar graph representing the number of persons in various age groups in a town shown in Figure. Observe the bar graph and answer the following questions: What is the percentage of the youngest age-group persons over those in the oldest age group? What is the total population of the town? What is the number of persons in the age-group 60-65? How many persons are more in the age-group 10-15 then in the age group 30-35? What is the age-group of exactly 1200 persons living in the town? What is the total number of persons living in the town in the age-group 50-55? What is the total number of persons living in the town in the age-groups 10-15 and 60-65? Whether the population in general increases, decreases or remains constant with the increase in the age-group.
View SolutionWhat is the total number of elements in the III group of the modern periodic table
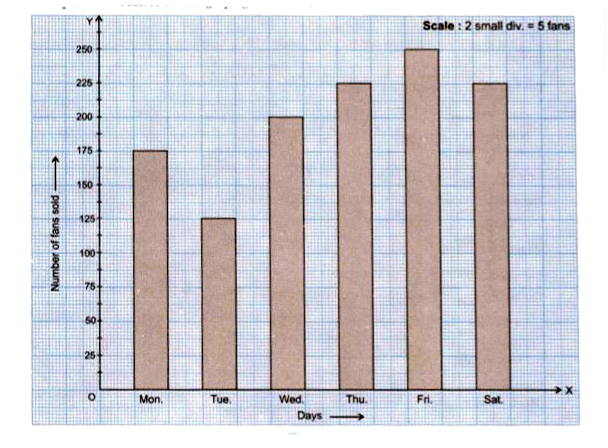
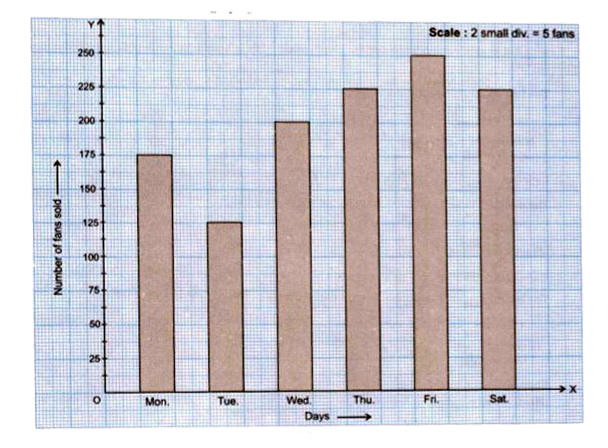
View SolutionObserve the bar graph given below :

Read the bar graph carefully and answer the following questions :
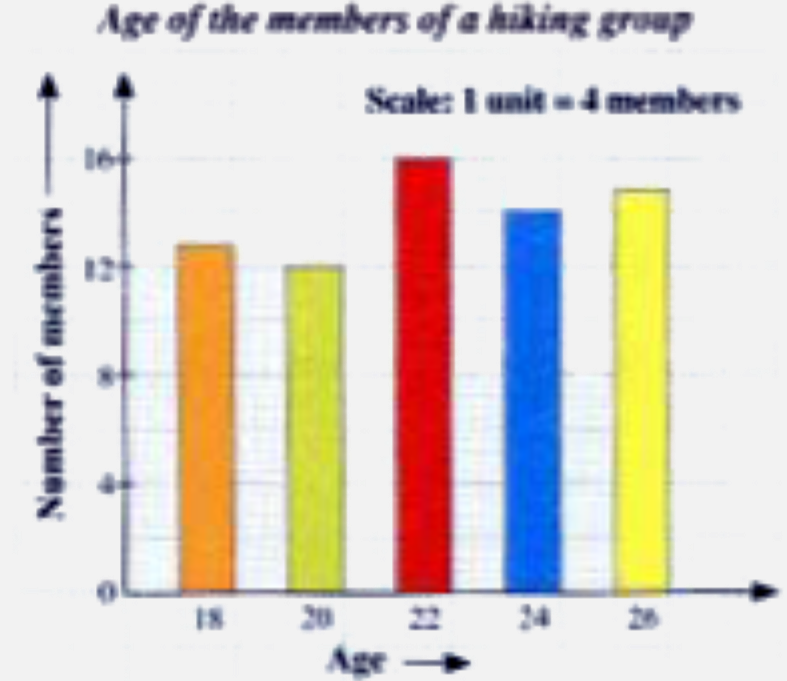
What was the total sale during the week?View SolutionThe given graph represents the age and number of members of a hiking group who are planning an excursion. Study the graph and answer the following question.
Which age group has the least members in the hiking group?
 View Solution
What is the total number of elements in the I group of the modern periodic table
View SolutionThe given graph represents the age and number of members of a hiking group who are planning an excursion. Study the graph and answer the following question.
Which age group has the maximum members in the hiking gruoup?
 View Solution
What is the total number of elements in the II group of the modern periodic table
View SolutionObserve the bar graph given below :

Read the bar graph carefully and answer the following questions :
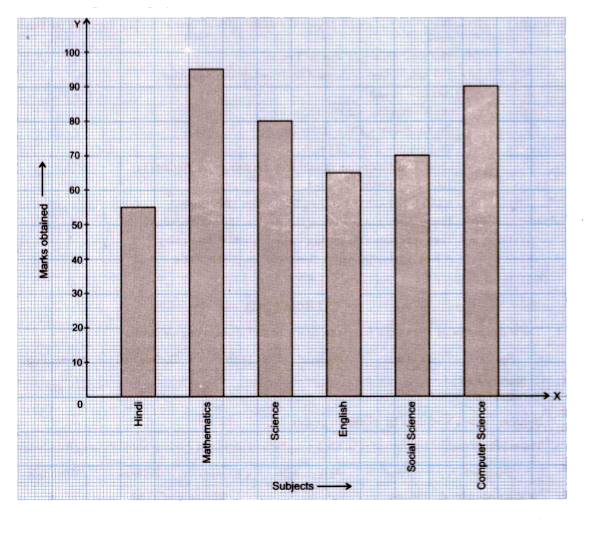
What information is given by the bar graph?View SolutionRead the given bar graph and answer the question that follow :

What information is represented by the bar graph?View SolutionNumber of persons in various age groups in a town is given in the following tableDraw a bar graph to represent the above information and answer the following questions. (take 1 unit length = 20 thousands)(a) Which two age groups have same population?(b) All persons in the age group of 60 and above are called senior citizens. How many senior citizens are there in the town?
View Solution
