The expenditure (in 10 crores
of rupees) on health by the Govt. of India during the various five year plans
in shown below:

Construct a bar graph to represent the above data.
Topper's Solved these Questions
Similar Questions
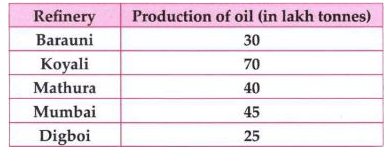
The production of oil (in lakh tonnes) in some of the refineries in India during 2008 is given below :

Construct a bar graph to represent the above data
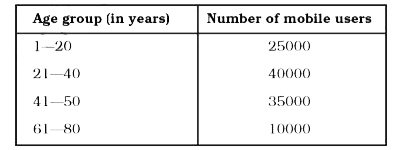
View SolutionNumber of mobile phone users in various age groups in a city is listed below:

Draw a bar graph to represent the above information.
View SolutionThe runs scored by a cricket team in first 10 overs are given below:

Draw a line graph representing the above data.
View SolutionThe expenditure of a family of different heads in a month is given below

Draw a bar graph to represent the data above.
View SolutionGiven below is the data of school going students (boys and girls):

Draw the bar graph to represent the above data.
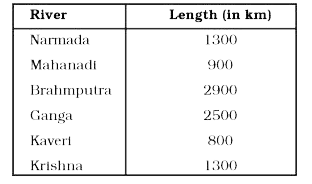
View SolutionThe lengths in km (rounded to nearest hundred) of some major rivers of India is given below:

Draw a bar graph to represent the above information.
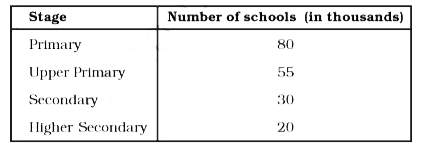
View SolutionThe following table gives the data of number of schools (stage-wise) of a country in the year 2002.

Draw a bar graph to represent the above data:
View Solution70 students from a locality use different modes of transport to go to school as given below:

Draw the bar graph representing the above data.
View Solution70 students from a locality use different modes of transport to go to school as given below:
 Draw the bar graph representing the above data.
View SolutionThe population of four major cities in India in a particular year is given below: City: Mumbai Kolkata Delhi Chennai No. of Students: 120 130 150 80 Construct a bar graph to represent the above data.
View Solution
