The
following table gives the number of vehicles passing through a busy crossing
in Delhi in different time intervals on a particular day.

Represent
the above data by a bar graph.
Topper's Solved these Questions
Similar Questions
The following table gives the number of vehicles passing through a busy crossing in Delhi in different time intervals on a particular day. Time interval, 8 to 9 hrs, 9 to 10 hrs, 10 to 11 hrs, 11 to 12 hrs, 12 to 13 hrs, 13 to 14 hrs, 14 to 15 hrs No. of vehicles, 300, 400, 350, 250, 200, 150, 100 Represent the above data by a bar graph.
View SolutionThe following table gives the number of vehicles passing through a busy crossing in Delhi in different time intervals on a particular day. Time interval, 8-9 hrs, 9-10 hrs, 10-11 hrs, 11-12 hrs, 12-13 hrs, 13-14 hrs, 14-15 hrs, 15-16 hrs, 16-17 hrs, 17-18 hrs No. of Vehicles, 300, 400, 350, 250, 200, 150, 100, 200, 300, 450 Represent the above data by a bar graph.
View Solution
Knowledge Check
On a particular day, the number of vehicles passing through a crossing is given below:

A particular vehi cle is chosen at random. What is the probability that it is not a four-wheeler?A1/8B2/3C3/4D5/4
The following table gives the number of vehicles passing through a busy crossing in Delhi in different time intervals on a particular day. Time interval, 8-9 hrs, 9-10 hrs, 10-11 hrs, 11-12 hrs, 12-13 hrs, 13-14 hrs, 14-15 hrs, 15-16 hrs, 16-17 hrs, 17-18 hrs No. of Vehicles, 300, 400, 350, 250, 200, 150, 100, 200, 300, 450 Represent the above data by a bar graph.
View SolutionThe following bar graph shows the number of vehicles passing through a road crossing in Delhi in different time intervals on a particular day. Read the bar graph and answer the following questions: What does the bar graph represent? Also, give the maximum number of vehicles. When is the hourly traffic maximum? Also give the minimum number of vehicles. When is the hourly traffic minimum? What is the total number of vehicles passing through a crossing during a particular day?
View SolutionThe following bar graph shows the number of vehicles passing through a road crossing in Delhi in different time intervals on a particular day. Read the bar graph and answer the following questions: What does the bar graph represent? Also, give the maximum number of vehicles. When is the hourly traffic maximum? Also give the minimum number of vehicles. When is the hourly traffic minimum? What is the total number of vehicles passing through a crossing during a particular day?
View SolutionThe following table shows the number of fruits in a fruit shop. Represent the above data by a bar graph
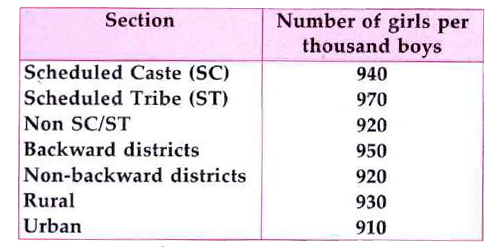
View SolutionThe following data on the number of girls (to the nearest ten) per thousand boys in different sections of Indian society is given below

Represent the information above by a bar graph.
View Solution. The following data shows the year wise strength of a school.Represent the the above data by bar graph:
View SolutionThe following table shows the percentage of buyers of four different brands of bathing soaps.

Represent the above data by a pie chart.
View Solution
