The marks
scored by 750 students in an examination are given in the form of a frequency
distribution table.

Represent
this data in the form of a histogram and construct a frequency polygon.
Topper's Solved these Questions
Similar Questions
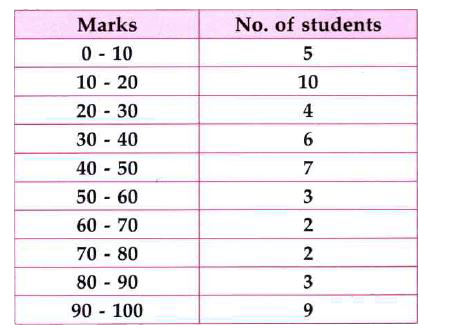
For the following data, draw a histogram and a frequency polygon

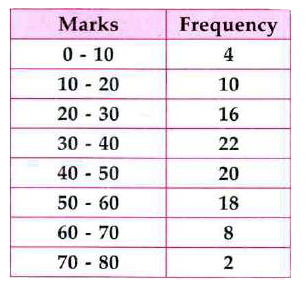
View SolutionThe following is a frequency distribution of marks:

If a and b are equal, find their values. Draw a histogram and a frequency polygon.
View SolutionThe marks scored by 750 students in an examination are given in the form of a frequency distribution table: Marks No. of students Marks No. of students 600-640 16 760-800 172 640-680 45 800-840 59 680-720 156 840-880 18 720-760 284 Prepare a cumulative frequency table by less than method and draw an ogive.
View SolutionThe marks scored by 750 students in an examination are given in the form of a frequency distribution table: Marks No. of students Marks No. of students 600-640 16 760-800 172 640-680 45 800-840 59 680-720 156 840-880 18 720-760 284 Prepare a cumulative frequency table by less than method and draw an ogive.
View SolutionThe marks scored by 750 students in an examination are given in the form of a frequency distribution table. Marks 600−640,640−680,680−720and720−760,760−800,800−840,840−880 No. of Students: 16 45 156 284 172 59 18 Represent this data in the form of a histogram and construct a frequency polygon.
View SolutionThe marks scored by 750 students in an examination are given in the form of a frequency distribution table.
.Marks 600−640,640−680,680−720and720−760,760−800,800−840,840−880
N⊙ofStudents:16451562841725918 Represent this data in the form of a histogram and construct a frequency polygon.
View SolutionThe following table gives the marks scored by 100 students in an entrance examination

Represent this data in the form of a histogram.
View SolutionPresent the following data in the form of a frequency polygon :

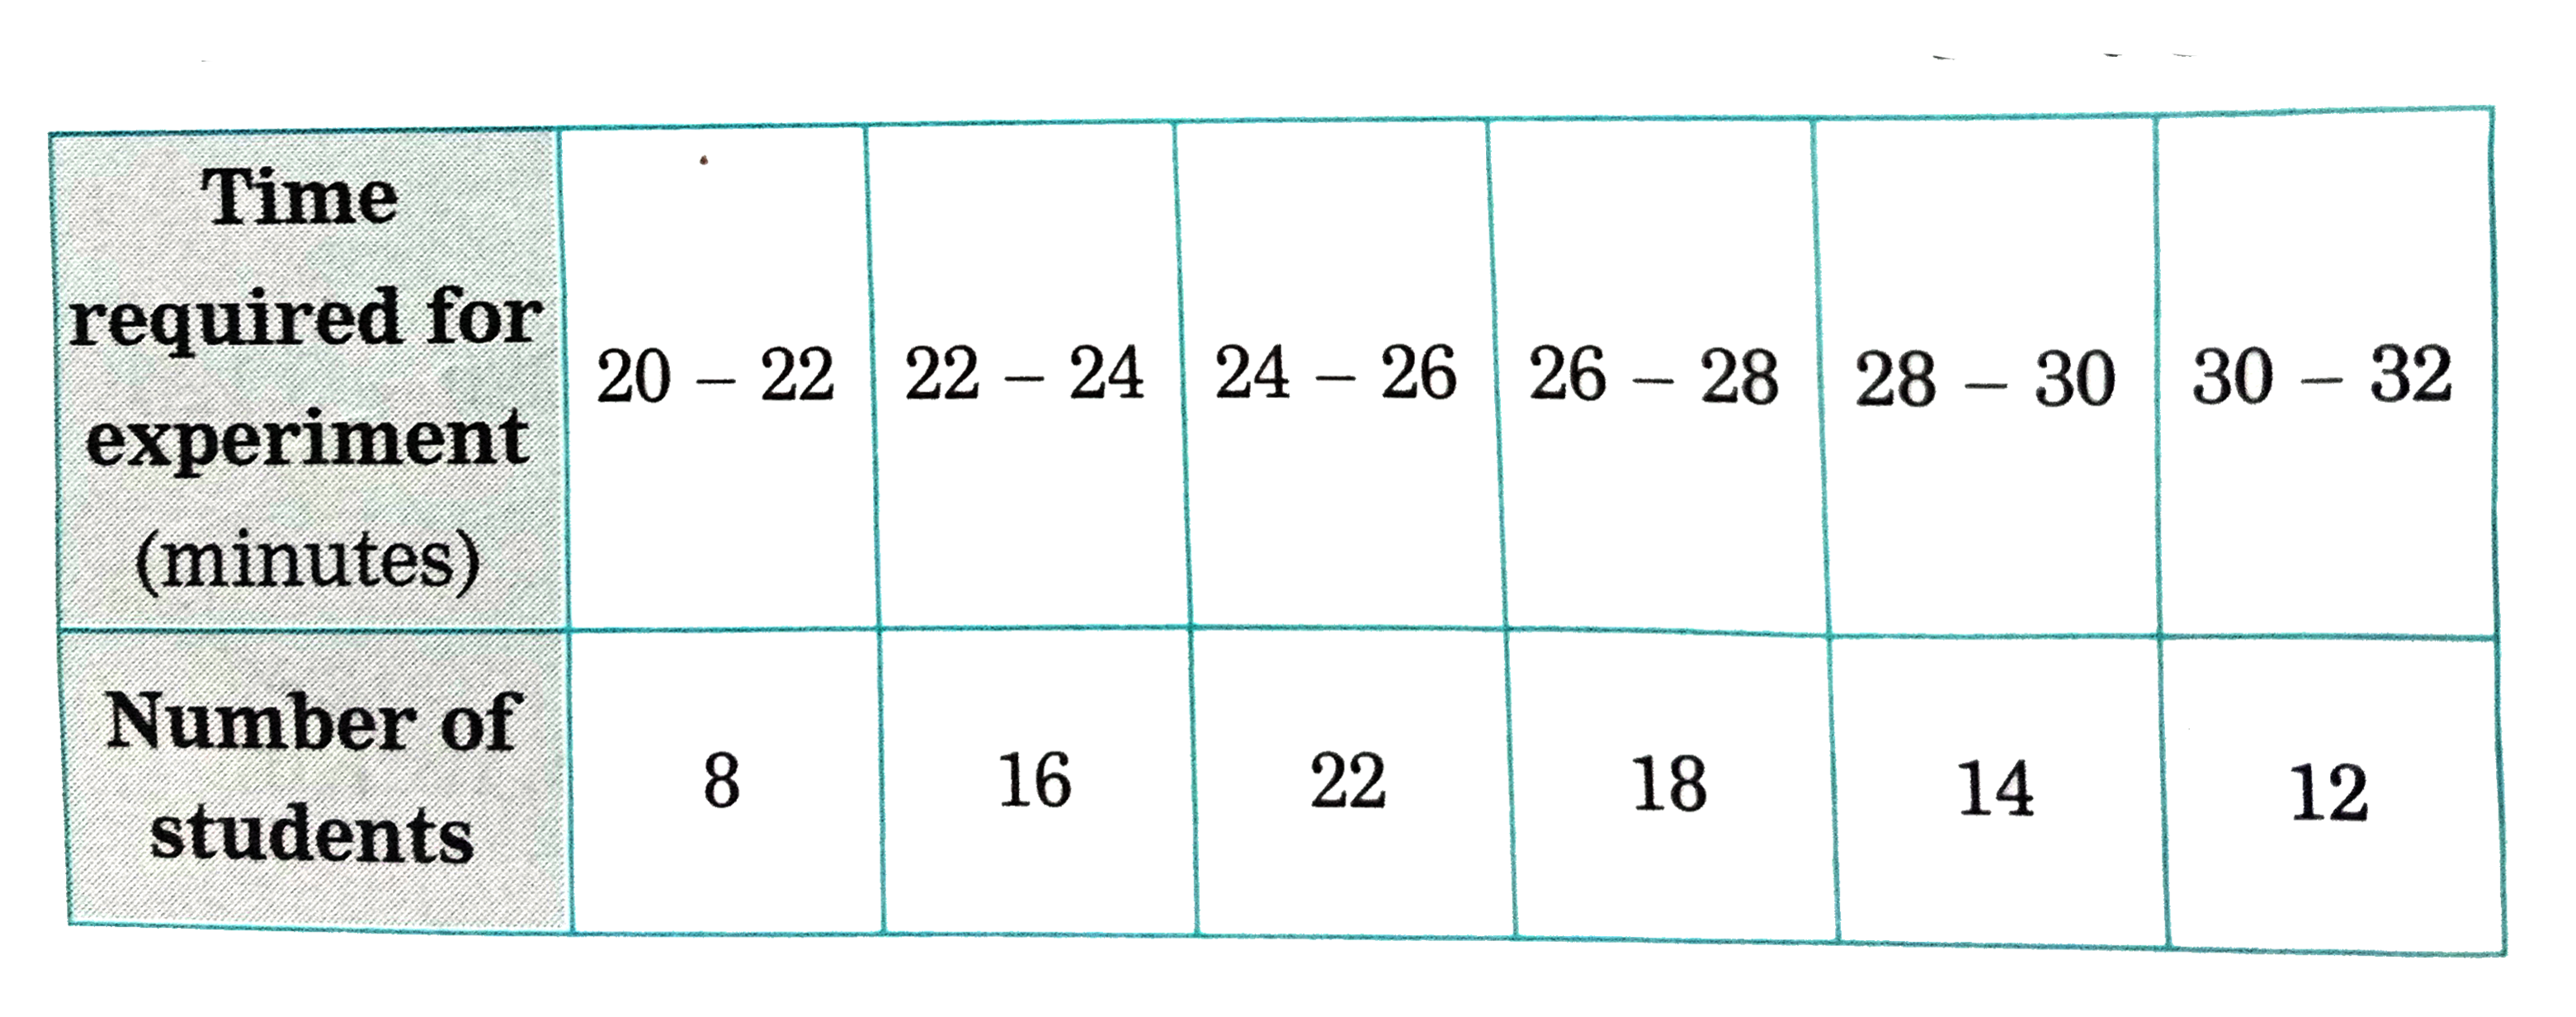
View SolutionThe time required for students to do a science experiment and the number of students is shown in the following grouped frequency distribution table. Show information by a histogram and also by a frequency polygon.

View SolutionThe marks scored by students in Mathematics in a certain examinations are given below:

Draw histogram for the above data.
View Solution
