Complete Solutions to MCQs of chapter STATISTICS of Class 12 book with complete answers and questions
| Class 12 | MATHS |
| Chapter | STATISTICS |
| NDA PREVIOUS YEARS | MCQs |
| Number Of Questions | 100 |
| Academic Year | 2023-24 |
The production of food grains in Maharashtra is given for the 12 years from 1992 to 2003. Which one of the following representations is most suitable to depict the data?
01:21View SolutionIn a manufacture of ready-made graments, which average is used to find the most frequent size?
01:01View SolutionUnder what condition will the angle between two regression lines become zero?
01:03View SolutionThe arithmetic mean of `""^(n)C_(0),""^(n)C_(1),""^(n)C_(2), ..., ""^(n)C_(n)`, is
03:37View SolutionThe standard deviation of n observation `x_(1),x_(2),……x_(n)` is 6. The standard deviation of another set of n observations `y_(1),y_(2),………..y_(n)` is 8. What is the standard deviation of n observations `x_(1)-y_(1),x_(2)-y_(2),………..,x_(n)-y_(n)`?
04:00View SolutionFollowing is the frequency distribution of life length in hours of 100 electric bulbs :

If the median of life length in 20 hours, then what are the missing frequencies (x, y)?04:22View SolutionAssertion (A) : We cannot find out the regression of x on y from that of y on x.
Reason (R) : In one equation x is dependent variable and y is independent whereas in other equation y is dependent variable and x is independent.02:17View SolutionIf from the point of intersection of two ogives, a perpendicular is drawn on the x-axis, what does the x-coordinate give?
00:45View SolutionThe marks scored by two students A and B in six subjects are given below:
`{:(A,71,56,45,89,54,44),(B,55,74,83,54,38,52):}`
Which one of the following statements is correct?02:07View SolutionIf we join the mid points of the upper horizontal sides of each rectangle of a histogram by straight lines, what is the figure so obtained known as?
01:11View SolutionThe definition of Mode fails if:
00:58View SolutionA firm employing 30 workers and paying on an average Rs 500 is combined with another firm employing 20 workers paying on an average Rs 600. What is the average pay of the workers of the combined firm?
01:53View SolutionWhich one of the following statement is correct ?
02:41View SolutionThe mean weight of all the students in a certain class is 60 kg. The mean weight of the boys from the class is 70 kg. while that of the girls is 55 kg. What is the ratio of number of boys to that of girls?
01:46View Solution
Frequency curves for the distribution of blood pressure readings of certain anthletes before exercise (A) and after exercise (B) are plotted together as shown in the figure above. From the frequency curves, which one of hte following can be concluded?02:19View SolutionIf the slopes of the line of regression of Y and X and of X and Y are `30^(@) and 60^(@)` respectively, then r(X, Y) is :
02:48View SolutionWhich one of the following measures is the most suitable one of central location for computing intelligence of students?
01:10View SolutionIn a binomial distribution, the mean is 4 and the variance is 3. What is the mode?
01:56View SolutionIf X is changed to `a+hU and Y` to `b+kV`, then which one of the following is the correct relation between the regression coefficients `b_(XY) and b_(UV)`?
02:50View SolutionStudents of two schools appeared for a common test carrying 100 marks. The arthmetic means of their marks for school I and II are 82 and 86 respectively, If the number of students of school II is 1.5 times the number of students of school I, what is the arithmetic mean of the marks of all the students, of both the school ?
01:43View SolutionIf AM of numbers `x_(1),x_(2)…..x_(n)` is `mu`, then what is tha AM of the numbers which are increased by 1, 2, 3, …..n respectively?
01:32View SolutionIn computing a measure of the central tendency for any set of 51 numbers, which one of the following measures is well-defined but uses only very few of the numbers of the set?
01:21View SolutionThe data below record and itemwise quarterly expenditure of a private organization:
`|{:("Item of expenditure","Amount (in lakh rupees)"),("1. Salaries",6.0),("2. TA & DA",4.9),("3. House rent and postage",3.6),("4. All other expenses",5.5),("Total : ",ulbar(20.0)):}|`
The data is represented by a pie diagram. what is the sectrorial angle of the sector with largest area?01:30View SolutionWhile constructing the cumulative frequency column of a frequency distribution, it is noticed that these cumulative frequencies arein arithmetic progression.
Assertion (A) : All the class frequencies are equal.
Reason (R) : when all the class frequencies are equal, the cumulative frequencies are arithmetic progression.02:14View SolutionIf in a frequency distribution table with 12 classes, the width of each class is 2.5 and the lowest class boundary is 6.1, then what is the upper class boundary of the highest class ?
01:08View SolutionConsider the following statements :
The appropriate number of classes while constructing a frequency distribution should be chosen such that
1. the class-frequency that increases to a peak and then declines.
2. the class-frequency should cluster around the class mid point.
Which of the statements given is/are correct?02:38View SolutionThe populations of four towns A, B, C and D as on 2001 are as follows:

What is the most appropriate diagram to present the above data?01:39View SolutionConsider the two series of observations A and B as follows:

If the standard deviation of the Series A is `sqrt(28)`, then what is the standard deviation of the Series B?View SolutionIf `n_(1) and n_(2)` are the sizes, `G_(1) and G_(2)` the geometric means of two series respectively, then which one of the following expresses the geometric mean (G) of the combined series?
01:49View SolutionLet `barx` be the mean of n observations `x_(1),x_(2),……..,x_(n)`. If `(a-b)` is added to each observation, then what is the mean of new set of observations?
01:22View Solution
The frequency curve for the distribution of income in a region is positively skewed as shown in the figure above. Then, for this distribution02:19View SolutionWhat is the value of n for which the numbers 1, 2, 3, …., n have variance 2?
05:49View SolutionThe arithmetic mean of `""^(n)C_(0),""^(n)C_(1),""^(n)C_(2), ..., ""^(n)C_(n)`, is
03:37View SolutionThe average age of 20 students in a class is 15 yr. If the teacher's age is included, the average increases by one. What is the teacher's age?
01:19View Solution`{:(X,1,2,3,4),("Frequency",2,3,f,5):}` The frequency of a discrete variable X with one missing frequency f is given above. If the arithmetic mean of X is `(23)/(8)`, what is the value of the missing frequency?
01:21View SolutionFor a set of discrete numbers, three measures of central tendency are given below
1. Arithmetic mean
2. Median
3. Geometric mean
Which of the above measures may not have a meaningful definition?01:46View SolutionConsider the following three methods of collecting data
(1) collecting data from government offices
(2) collecting data from public libraries
(3) collecting data by telephonic interview
Select the correct answer using the code given below01:23View SolutionThe arithmetic mean of 4 numbers is 15. The arithmetic mean of another 6 numbers is 12. What is the arthmetic mean of the combined 10 numbers?
01:07View SolutionThe average sales and standard deviation of sales for four months for a company are as follows:

During which month are the sales most consistent?03:07View SolutionThe marks scored by two students A and B is six subjects are given below
`{:(A,71,56,55,75,54,49),(B,55,74,83,54,38,52):}`
Which one of the following statements is most appropriate?01:41View SolutionIn a factory, there arc 30 men and 20 women employees. If the average salary of men is Rs 4050 and the average salary of all the employees is Rs 3550, then what is the average salary of woman ?
01:44View SolutionWhat is the standard deviation of numbers 7, 9, 11, 13, 15?
01:17View SolutionIf the monthly expenditure pattern of a person who earns a monthyl salary of Rs 15000 is represented in a pie diagram, then the sector angle of an item on transport expenses meassures `15^(@)`. What is his monthely expenditure on transport?
01:16View SolutionIf `sum_(i=1)^(n)(x_(i)-2)=110, sum_(i=1)^(n)(x_(i)-5)=20`, then what is the mean?
01:56View SolutionA class consists of 3 sections A, B and C with 35, 35 and 30 students respectively, The arithmetic means of the marks secured by students of sections A and B, who appeared for a test of 100 marks are 74 and 70 respectively, The arithmetic mean of the marks secured by students of section C, who appeared for a test in the same subject which carried 75 marks is 51. What is the average percentage of marks secured by all the 100 student of the three sections?
03:15View SolutionIn a study on the relationship between in vesestment (X) and profit (Y), the following two regression equations were obtained based on the data on X and Y
`3X+Y-12=0`
`X+2Y-14=0`
What is the mean `barX` ?02:19View SolutionFollowing table gives the mean and variance of monthyl demand for four products A, B, C and D in a supermarket

For which product the demand is consistent?View SolutionWhat is the least value of the standard deviation of 5 integers, no two of which are equal ?
02:18View SolutionCorrelation between two variable is said to be perfect if
00:58View SolutionConsider the following statements
I. The data, which are collected from the unit of individual respondents directly for the purpose of certain study on information are known as primary data.
II. The data obtained in a census study are primary data.
Which of tha above statements is/are correct?01:26View SolutionThe table below gives an incomplete frequency distribution with two missing frequencies `f_(1) and f_(2)`
`|{:("Value of x","Frequency"),(0,f_(1)),(1,f_(2)),(2,4),(3,4),(4,3):}|`
The total frequency is 18 and the arithmetic mean of x is 2.
What is the value of `f_(2)`?01:55View SolutionThe table below gives an incomplete frequency distribution with two missing frequencies `f_(1) and f_(2)`
`|{:("Value of x","Frequency"),(0,f_(1)),(1,f_(2)),(2,4),(3,4),(4,3):}|`
The total frequency is 18 and the arithmetic mean of x is 2.
What is the standard deviation?02:38View SolutionThe table below gives an incomplete frequency distribution with two missing frequencies `f_(1) and f_(2)`
`|{:("Value of x","Frequency"),(0,f_(1)),(1,f_(2)),(2,4),(3,4),(4,3):}|`
The total frequency is 18 and the arithmetic mean of x is 2.
What is the coefficient of variance ?03:07View SolutionWhat is the mean deviation of the data 2, 9, 9, 3, 6, 9, 4 ?
01:26View SolutionA set of n values `x_(1),x_(2),……,x_(n)` has standard deviation `sigma`. What is the standard deviation of n values `x_(1)+k, x_(2)+k….,x_(n)+k?`
00:51View SolutionThe two lines of regression are `8x-10y=66` and `40x-18y=214` and variance of x series is 9. What is the standard deviation of y series?
01:42View SolutionThe standard deviation of some consecutive integers is found to be 2. Which of the following statements best describes the nature of the consecutive integers?
03:30View SolutionConsider the following data:

What is the variability in the wages of the workers in Factory - A?02:52View SolutionThe distributions X and Y with total number of observations 36 and 64, and mean 4 and 3 respectively are combined. What is the mean of the resulting distribution X + Y?
03:24View SolutionConsider the following data :
`{:(x,5,7,8,4,6),(y,2,4,3,2,4):}`
What is the regression equation of y on x?05:18View SolutionThe frequency distribution of life of 90 TV tubes whose median life is 17 months is as follows
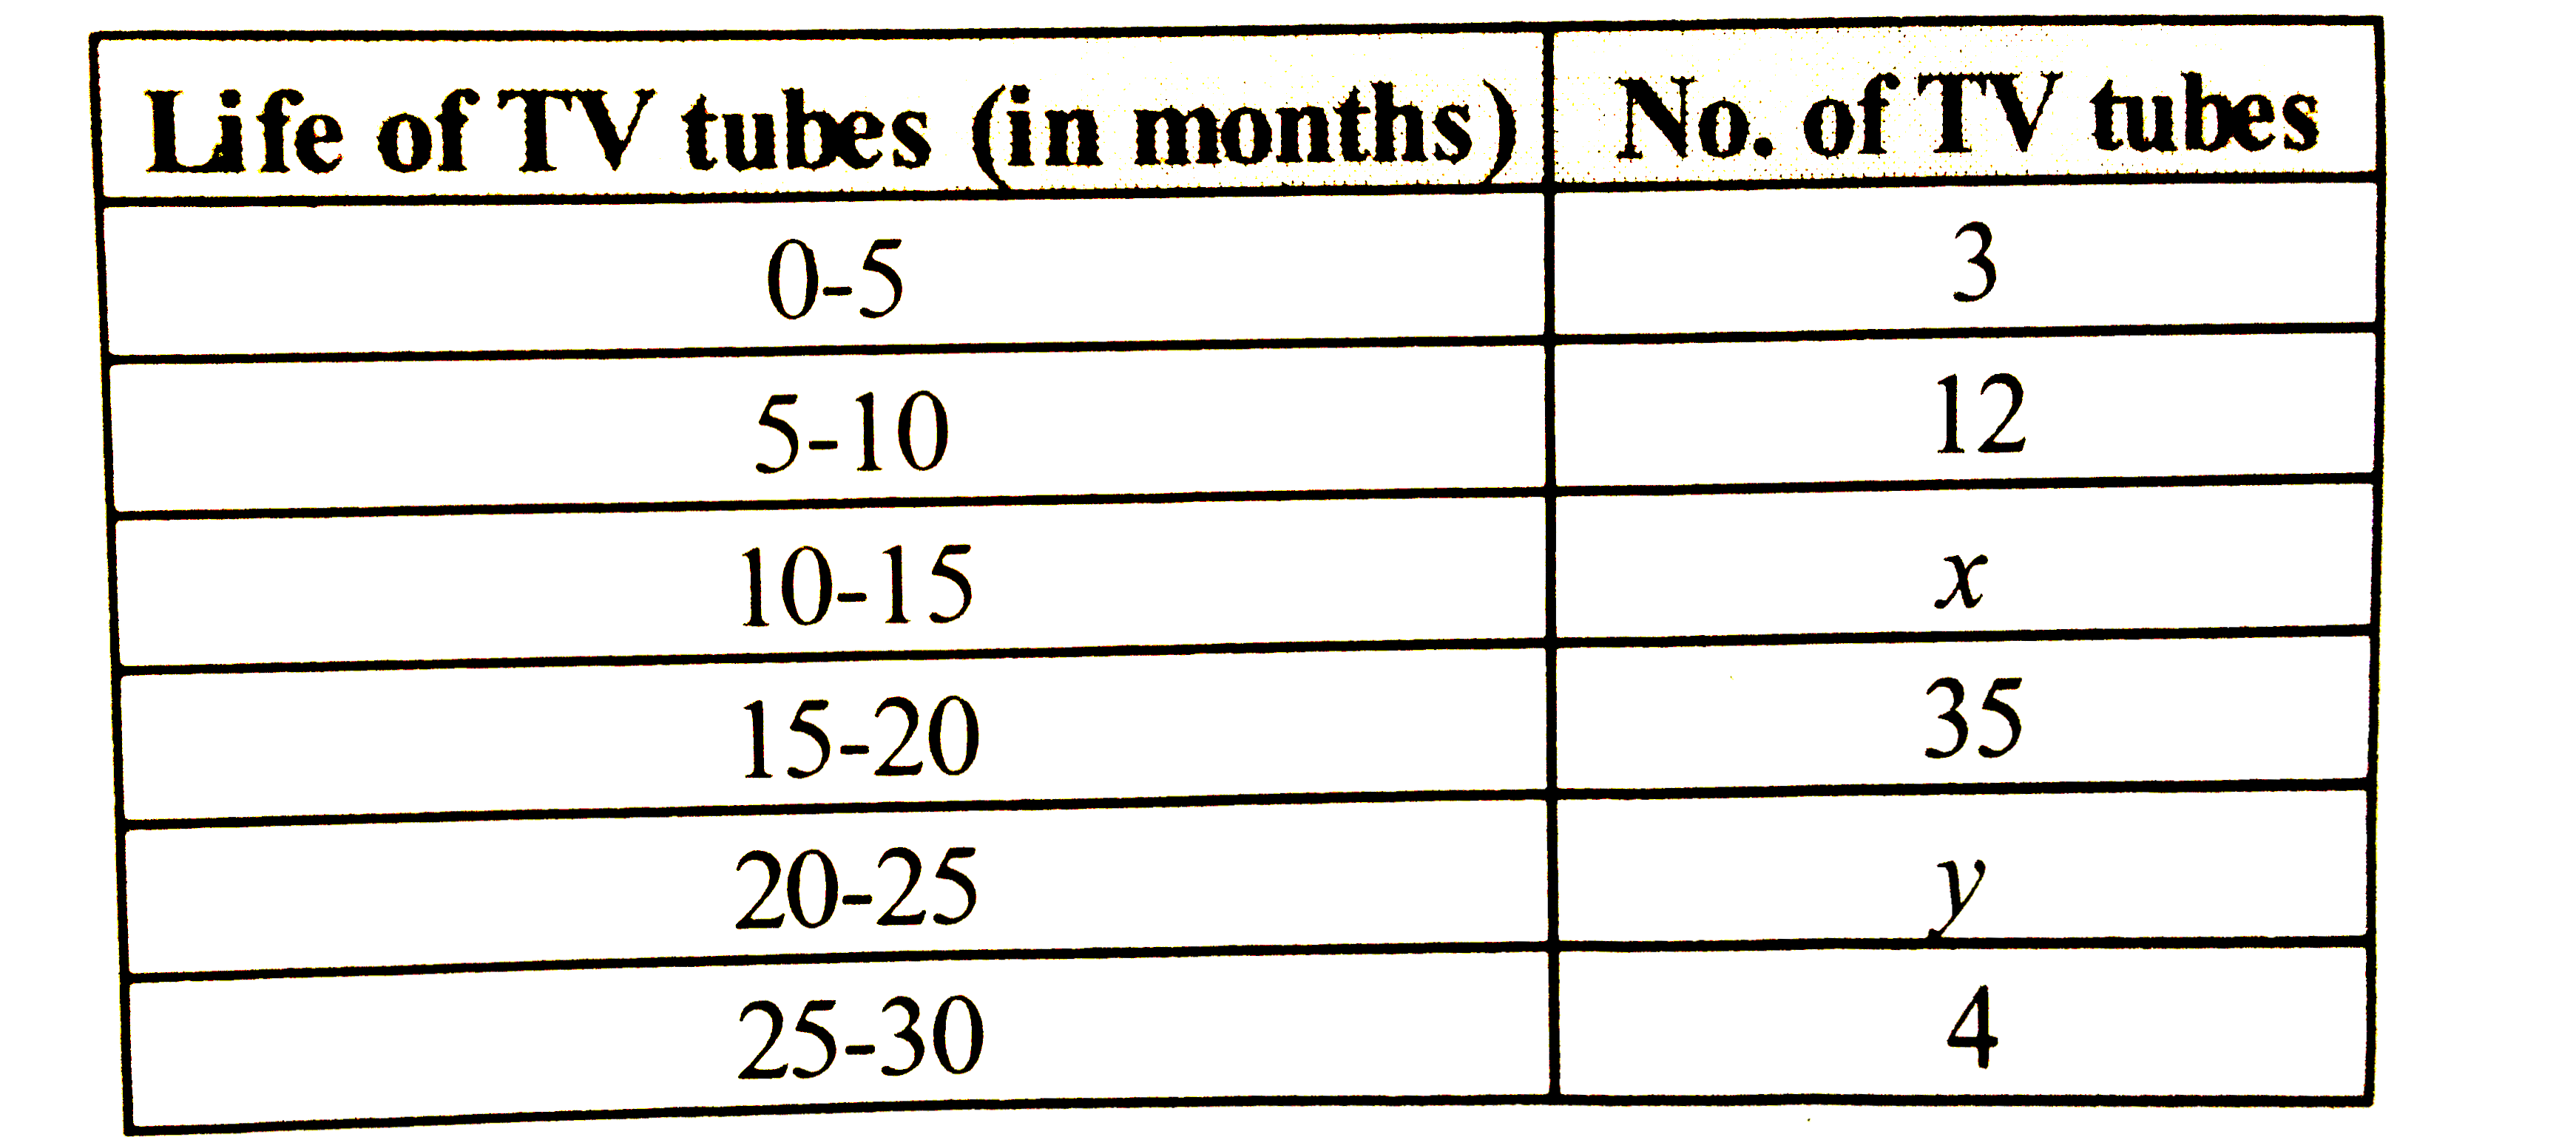
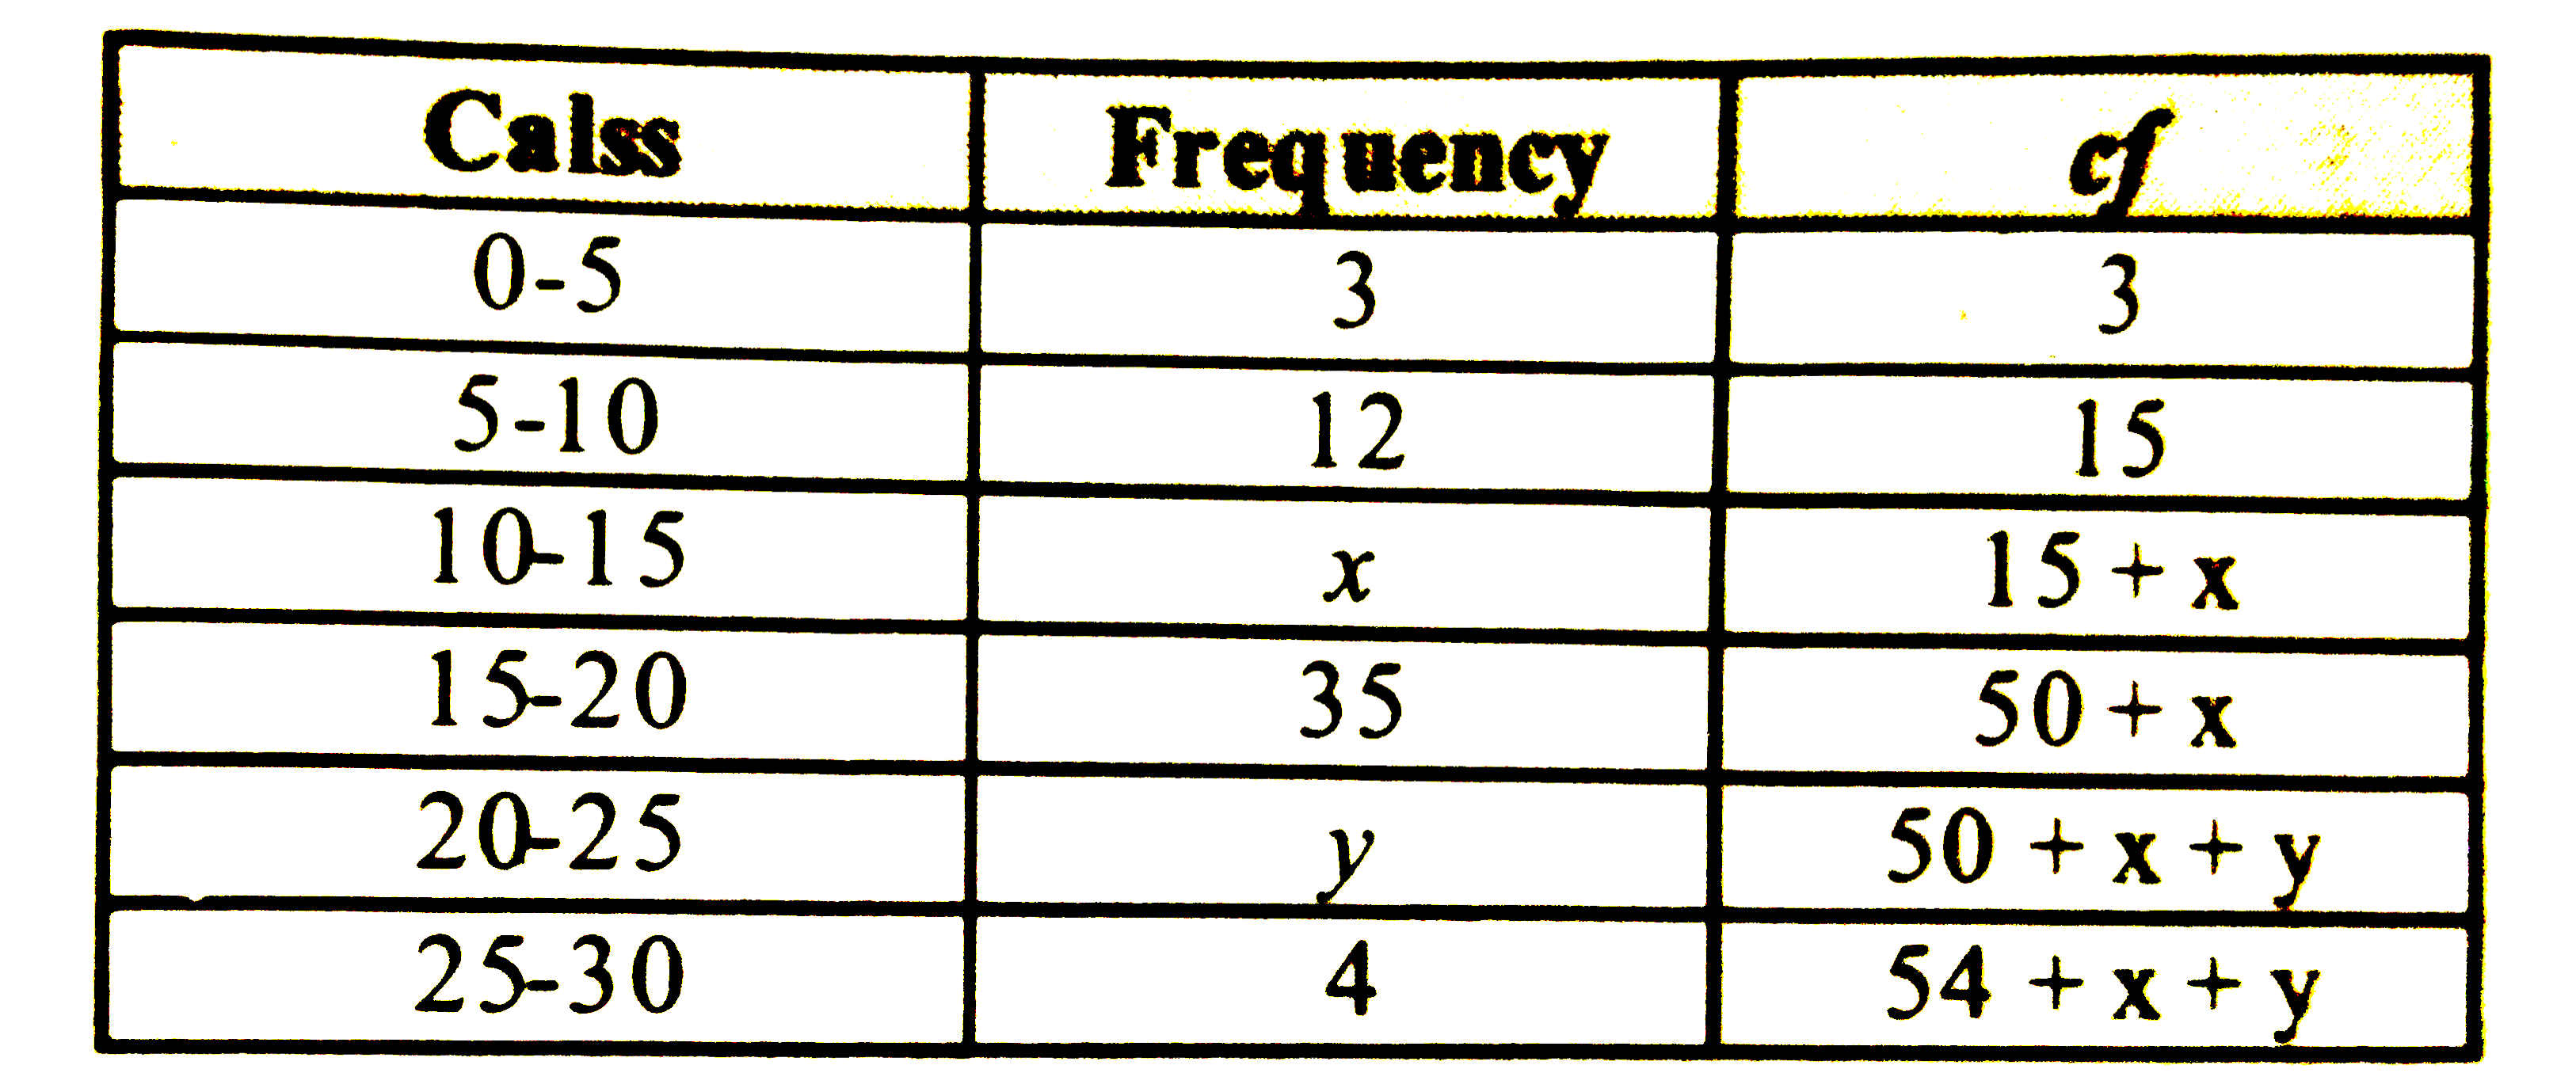
What is the lower limit of the median class?01:19View SolutionThe frequency distribution of life of 90 TV tubes whose median life is 17 months is as follows
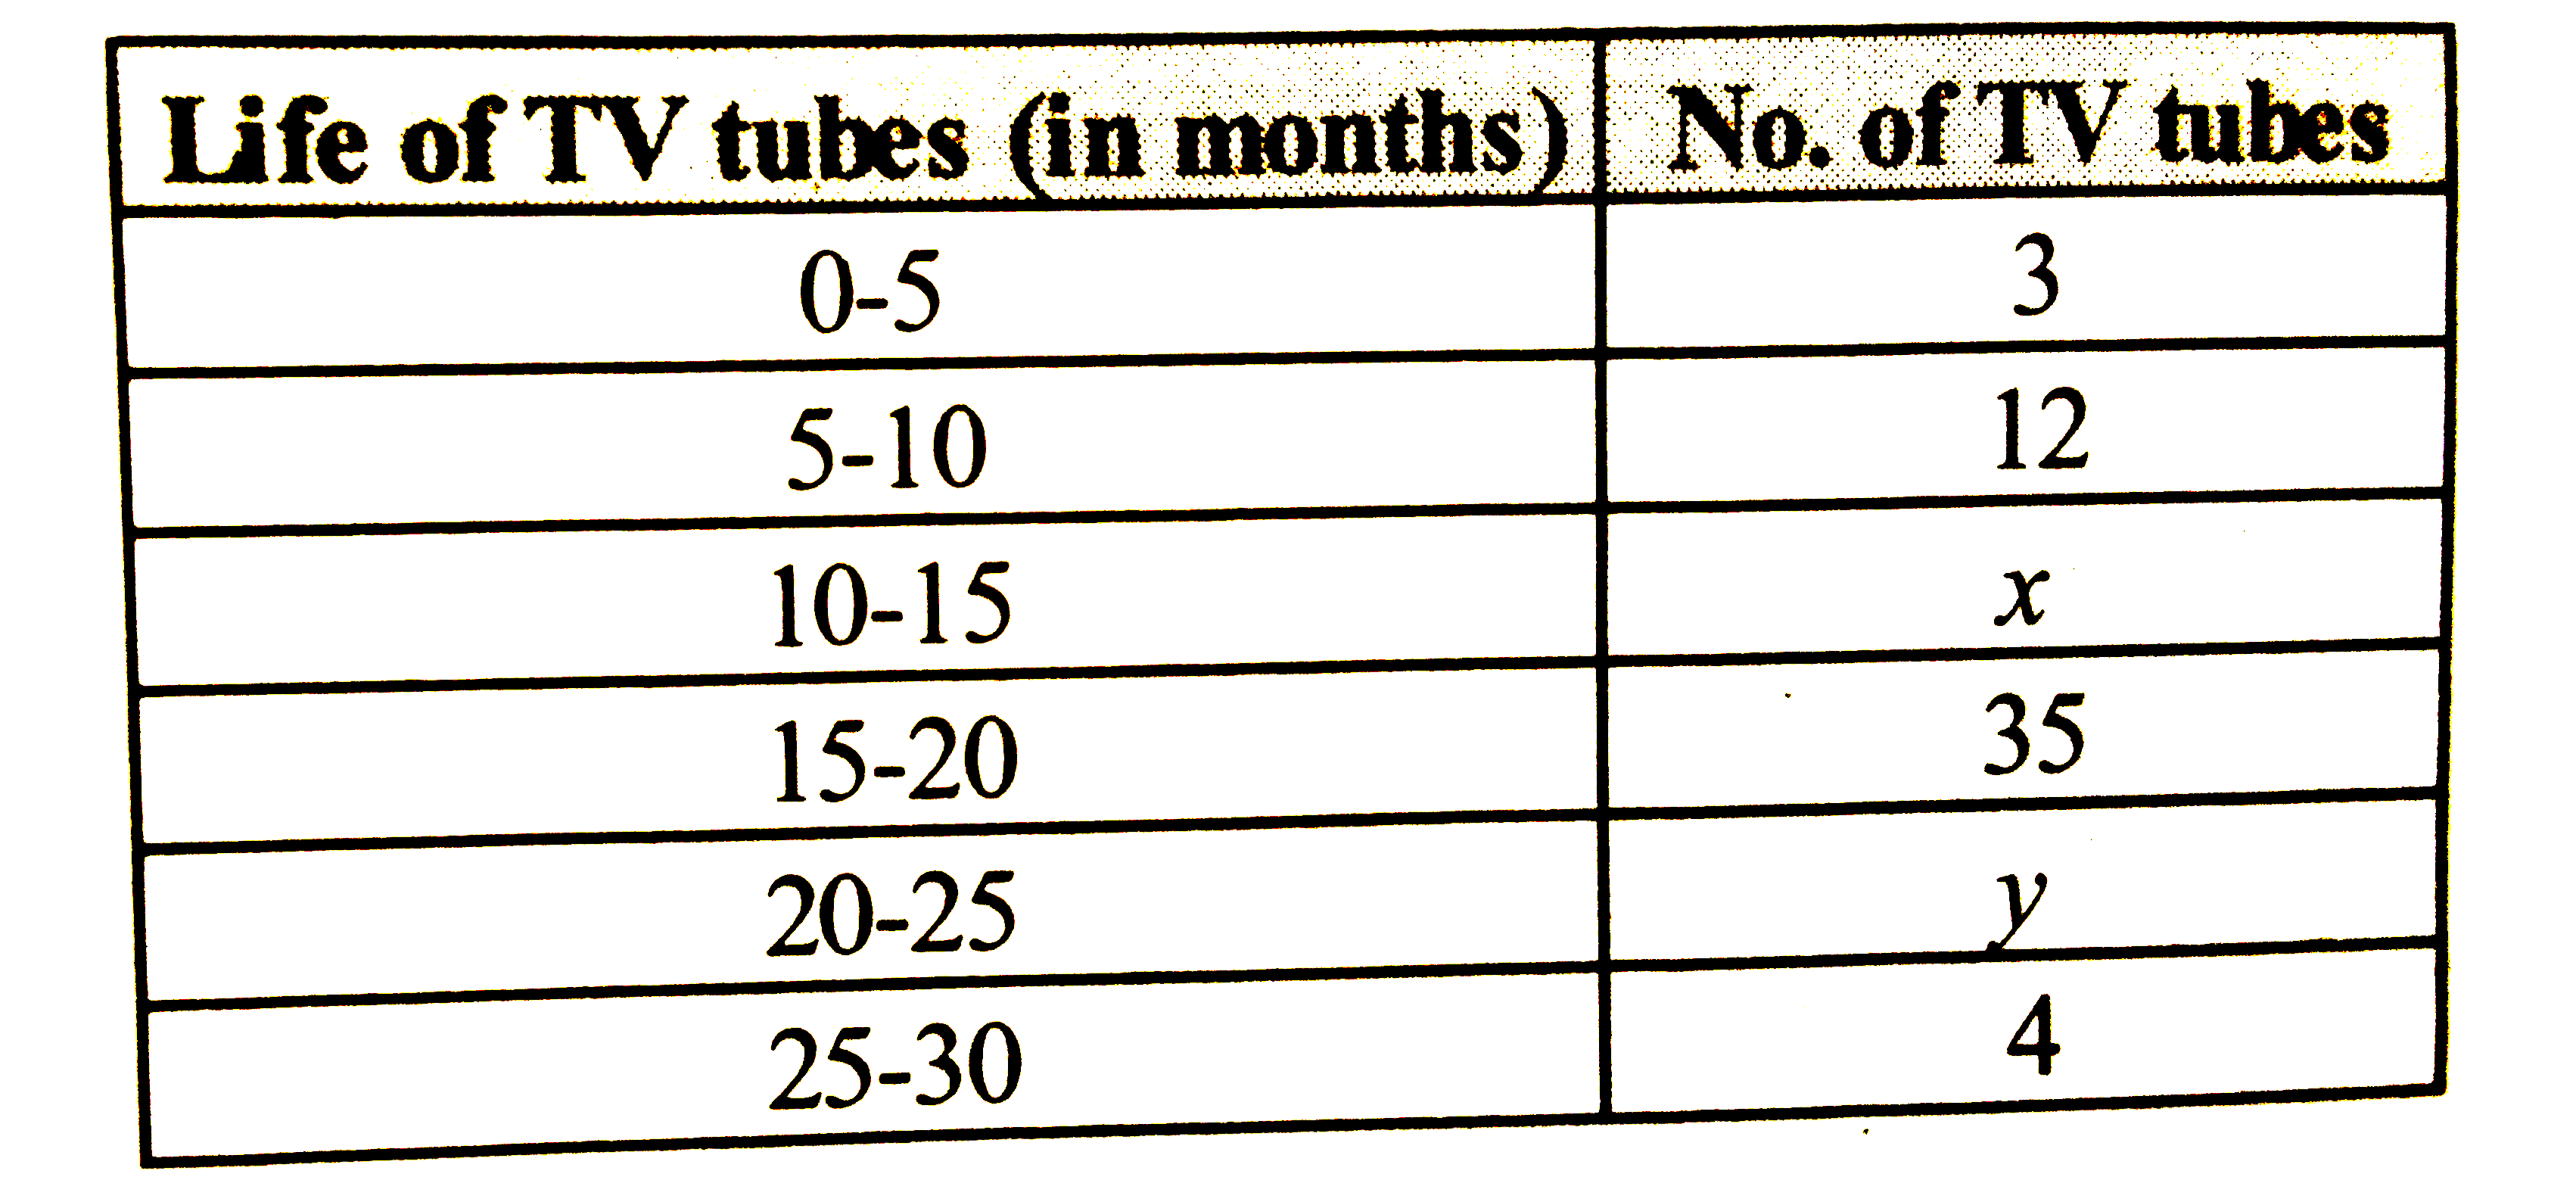
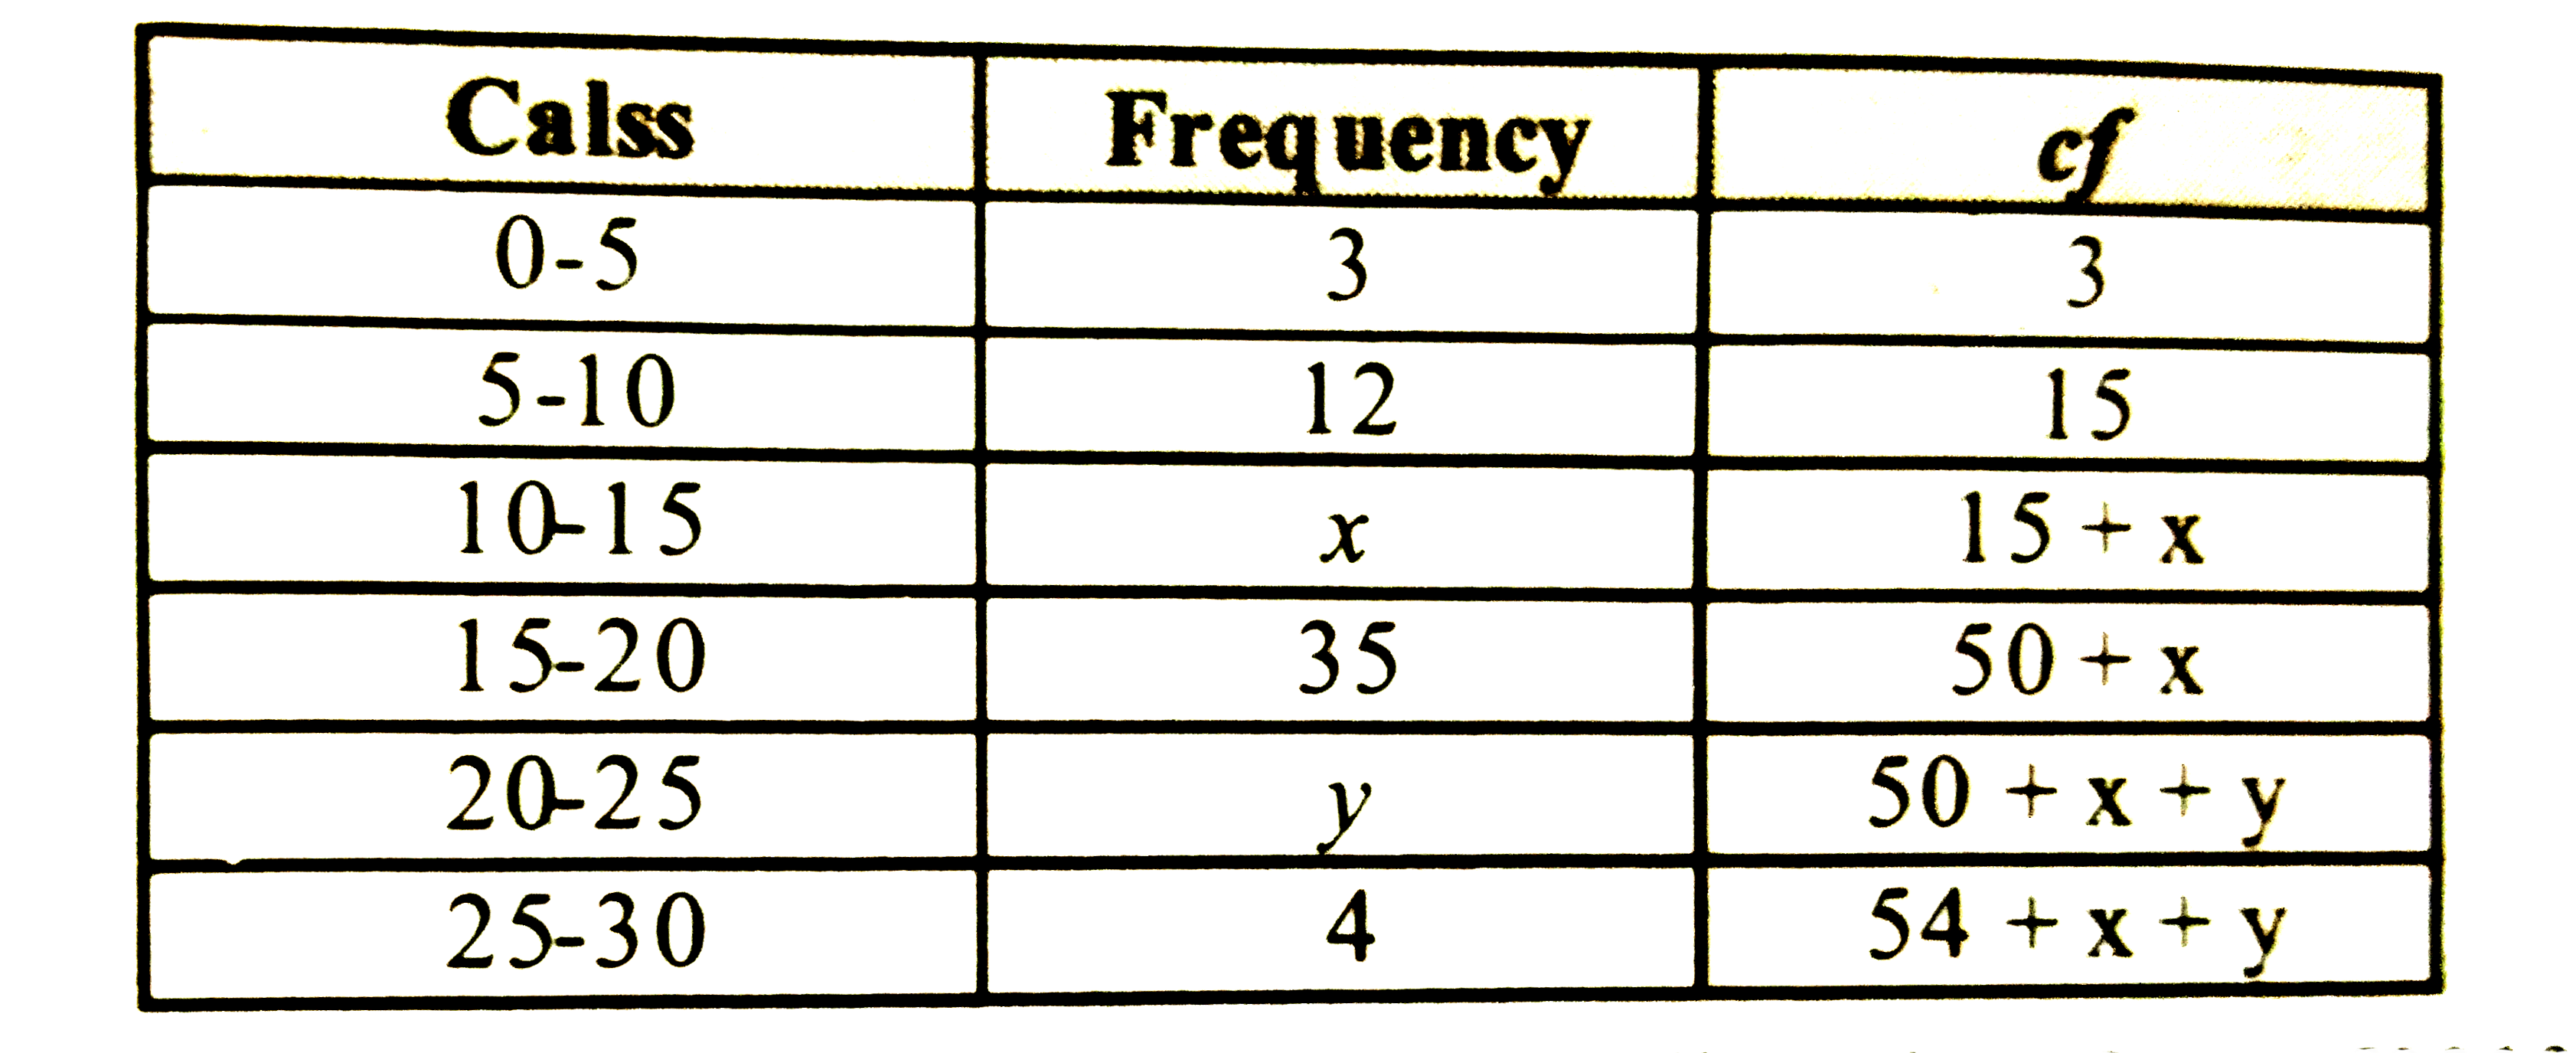
What is the missing frequency y ?02:42View SolutionThe frequency distribution of life of 90 TV tubes whose median life is 17 months is as follows
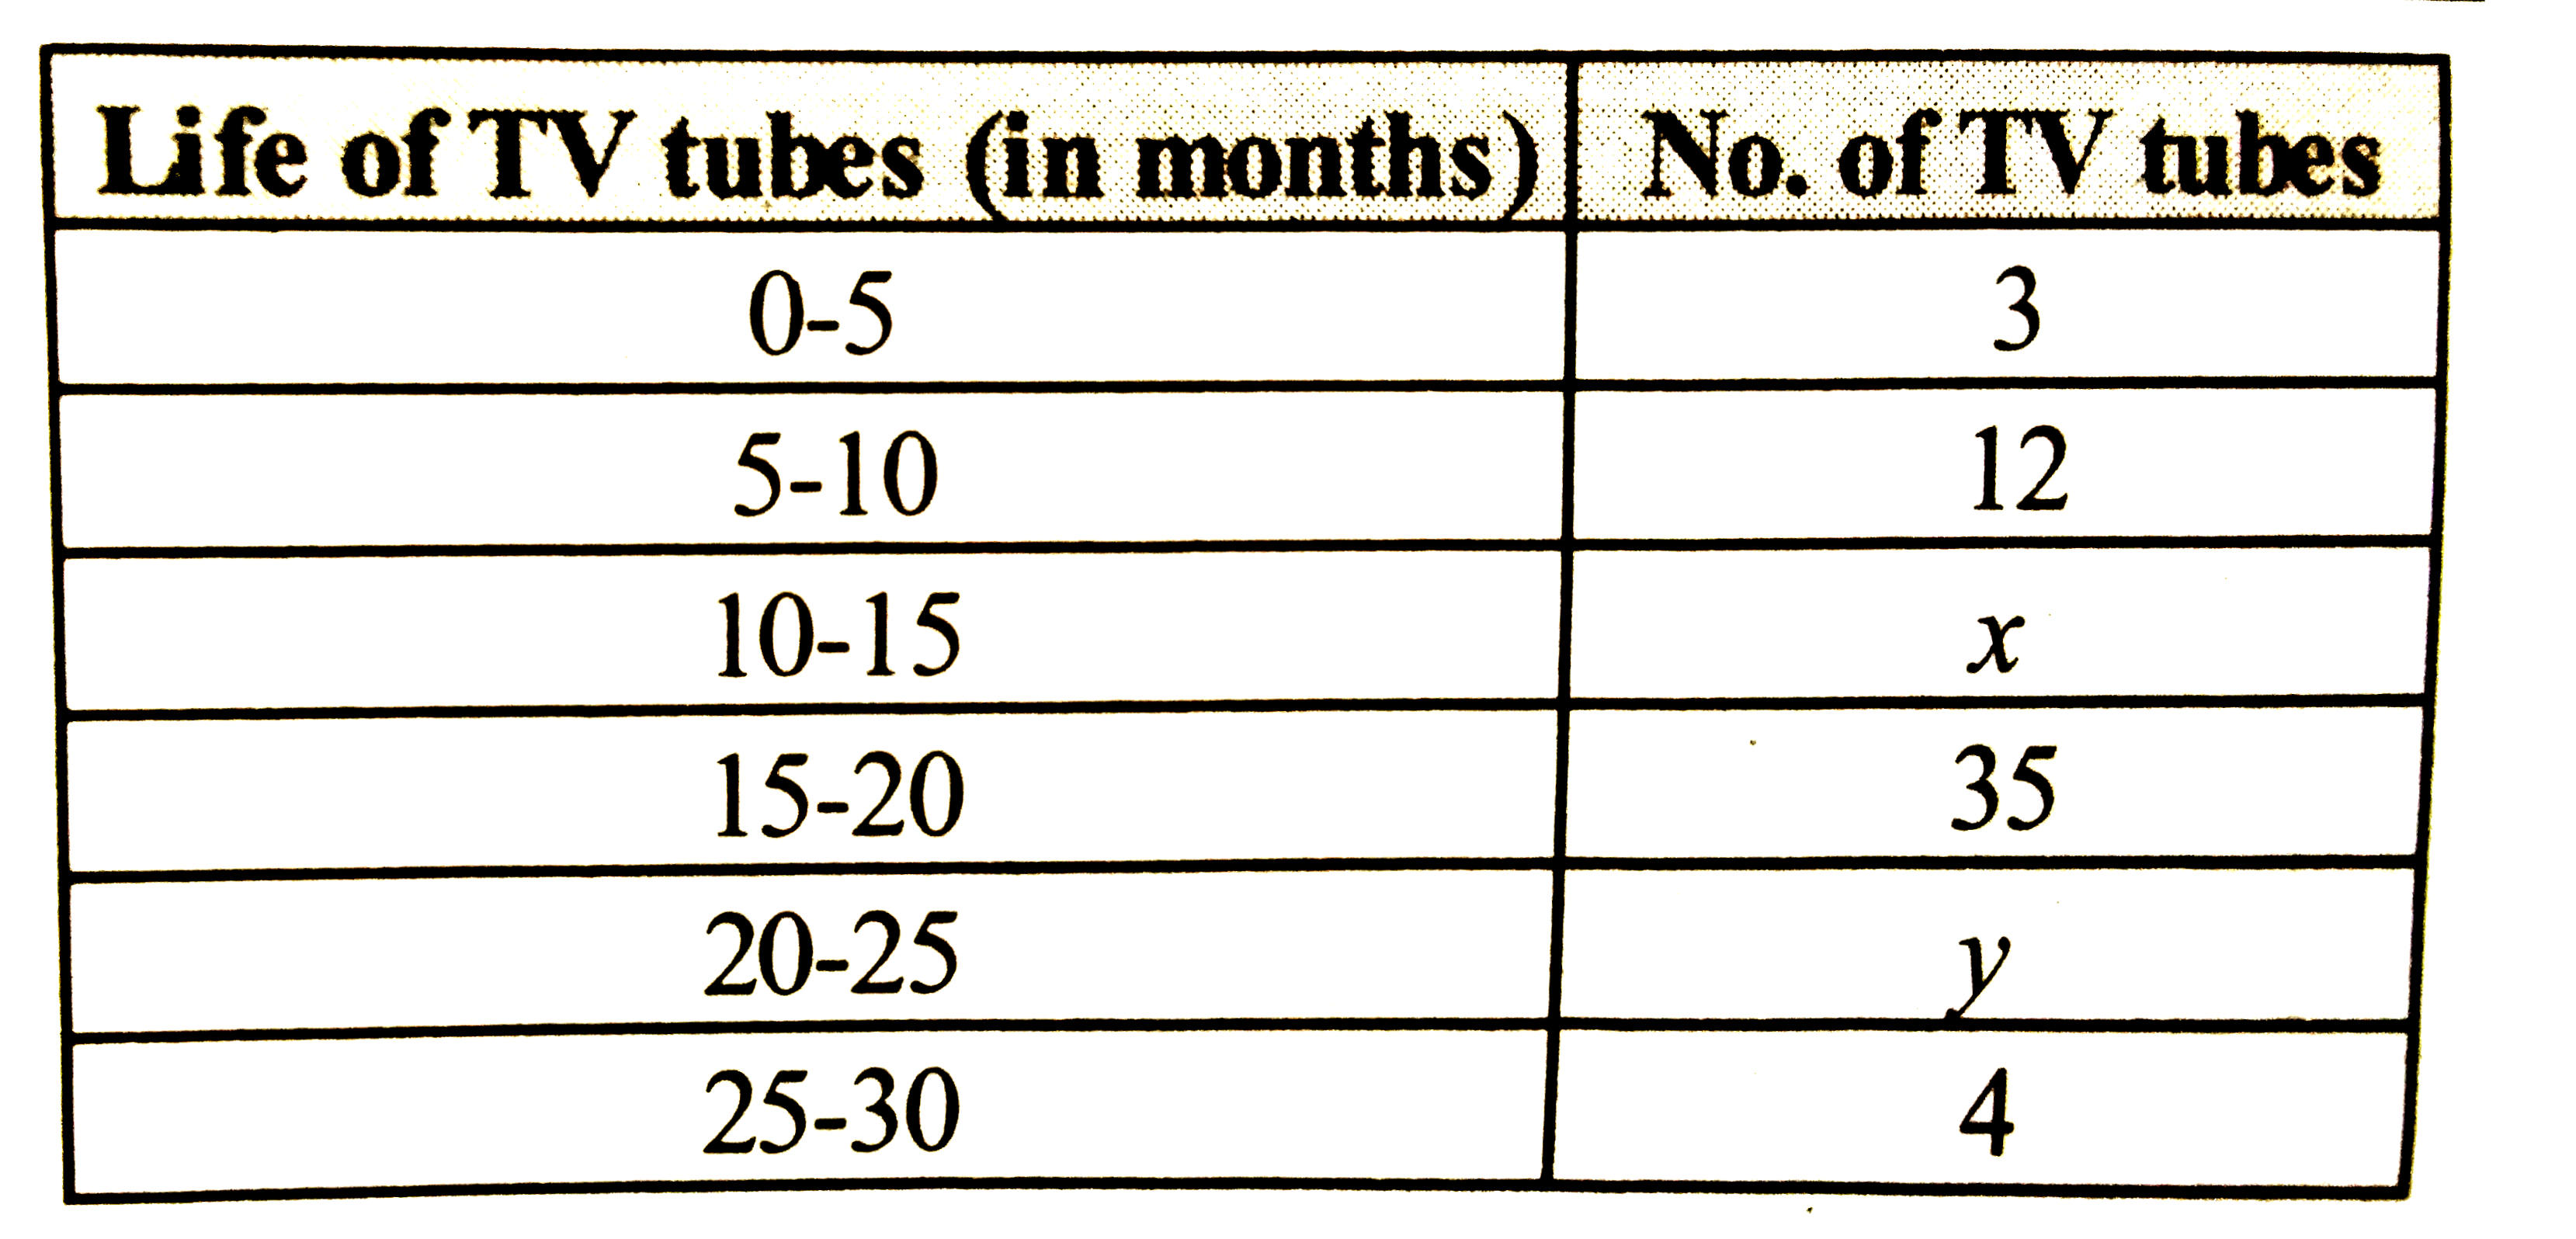
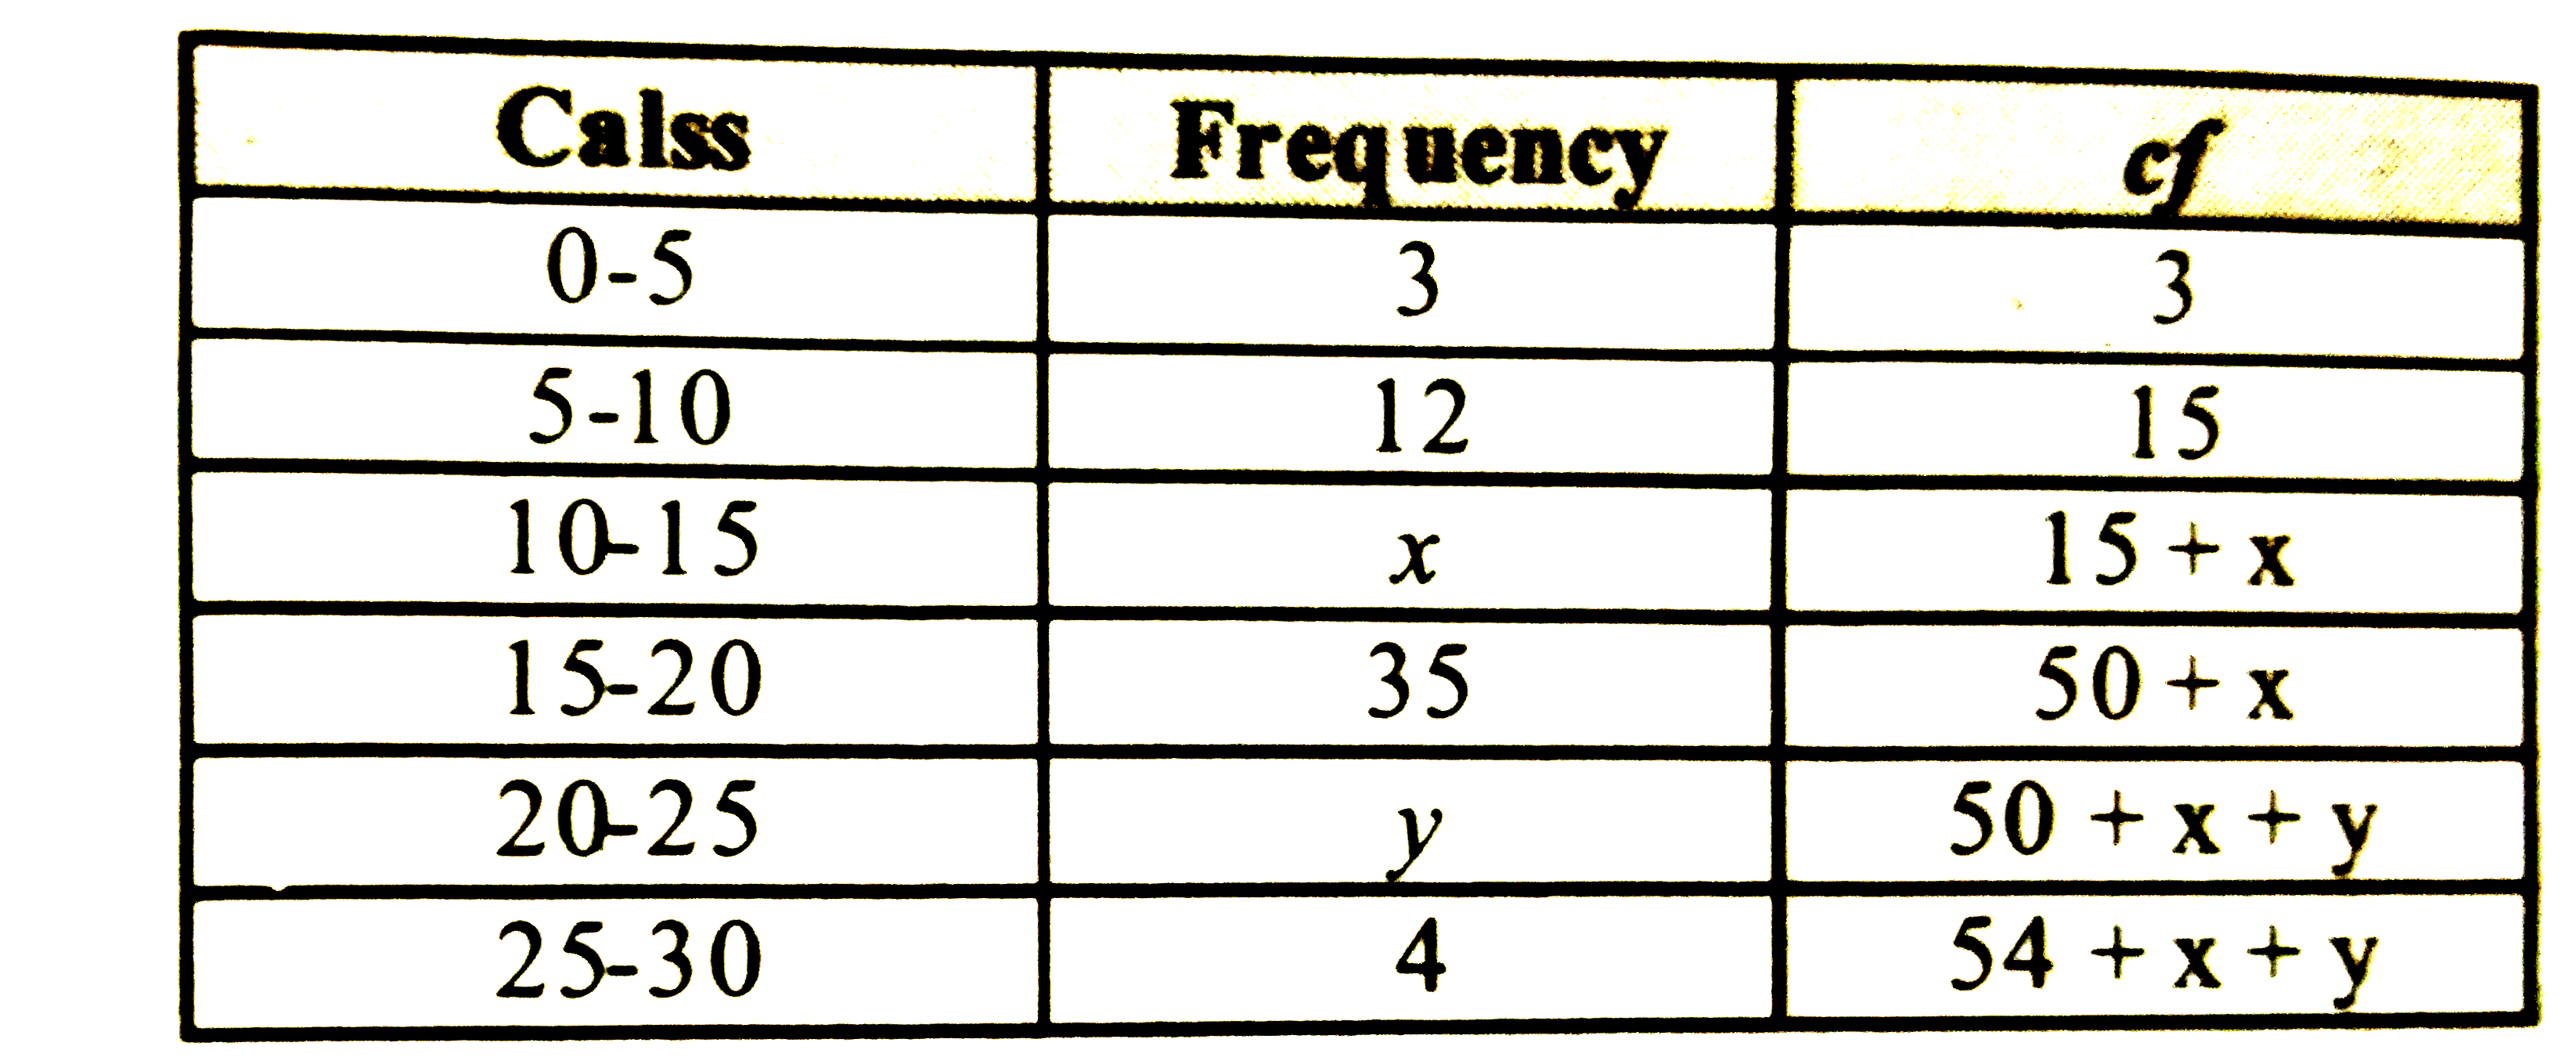
What is the cumulative frequency of the model class?03:57View Solution`{:("Class Interval",1-5,6-10,11-15,16-20),("Frequency",3,7,6,5):}`
Consider the following statement is respect of the above frequency distribution.
I. The median is contained in the modal class.
II. The distribution is bell-shaped.
Which of the above statement is/are correct?04:34View Solution`{:("Class Interval",0.10,10-20,20-30,30-40,40-50),("Frequency",5,0,20,5,10):}`
What is the median of the above frequency distribution?01:57View Solution`{:("Class Interval",0.10,10-20,20-30,30-40,40-50),("Frequency",5,0,20,5,10):}`
What is the mean of the above frequency distribution?01:33View SolutionConsider the following statements with regard to correlation coefficient r between random variables x and y.
I. `r=+1` or `-1` means there is a linear relationship between the variables.
II. `-1lerle1` and `r^(2)` is a measure of the linear relationship between the variables.
Which of the statements given above is/are correct?01:46View SolutionIf the valuesof a set are measured in cm, what will be the unit of variance?
01:05View SolutionWhat is the cumulative frequency curve of statistical data commonly called?
00:57View SolutionThe average daily income of workers of a factory including that of the onwer in Rs 110. However, if the income of the owner is excluded, the average daily income of the remaining 9 workers is Rs 76. What is the daily income of the owner?
02:05View SolutionWhich one of the following is the mean of the data given below?
`|{:(x_(i)" "6,10,14,18,24,28,30),(f_(i)" "2,4,7,12,8,4,3):}|`01:41View SolutionStudents of three sections of a class, having 30, 30 and 40 students appeared for a test of 100 marks. The arithmetic means of the marks of the three sections are `72.2, 69.0 and 64.1` in that order. What is the arithmetic mean of the marks of all the students of the three sections?
01:57View SolutionIf the variance of the data 2, 4, 5, 6, 17 is v, then what is the variance of the data 4, 8, 10, 12, 34?
01:27View Solution10 is the mean of a set of 7 observations and 5 is the mean of a set of 3 observations, the mean of the combined set is
01:56View SolutionSome measures of central tendency for n discrete observations are given below:
1. Arithmetic mean
2. Geometric mean
3. Harmonic mean
4. Median
A desirable property of a measure of central tendency is if every observation is multiplied by c, then the measure of central tendency is also multiplied by c, where `cgt0`. Which of the abvoe measures satisfy the property?02:03View SolutionA variate X takes values 2, 3, 4, 2, 5, 4, 3, 2, 1. What is the mode?
00:55View Solution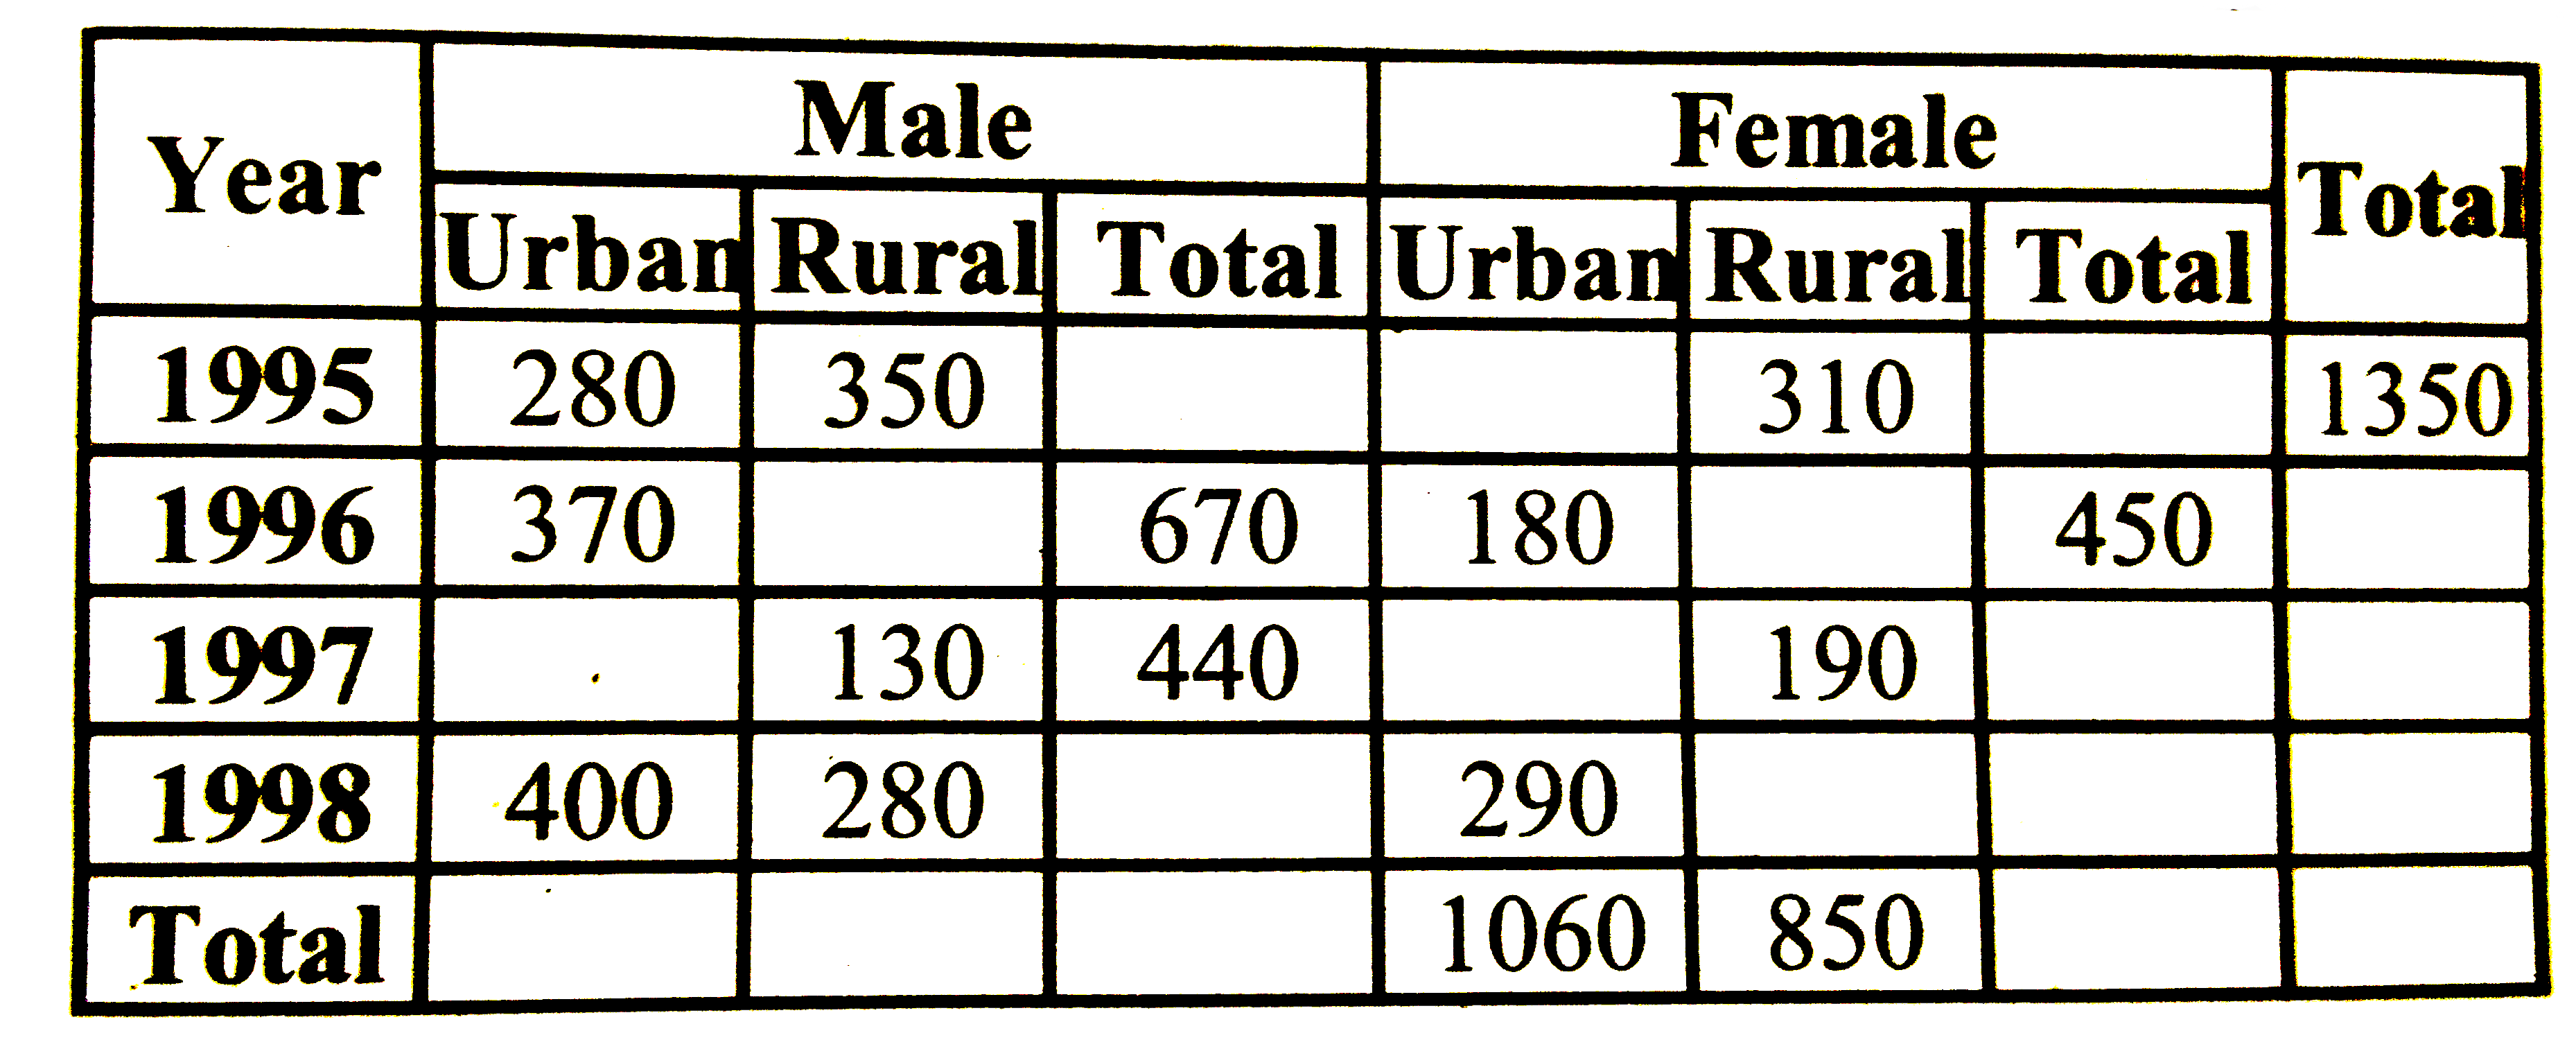
What is the total population for the year 1997?03:03View Solution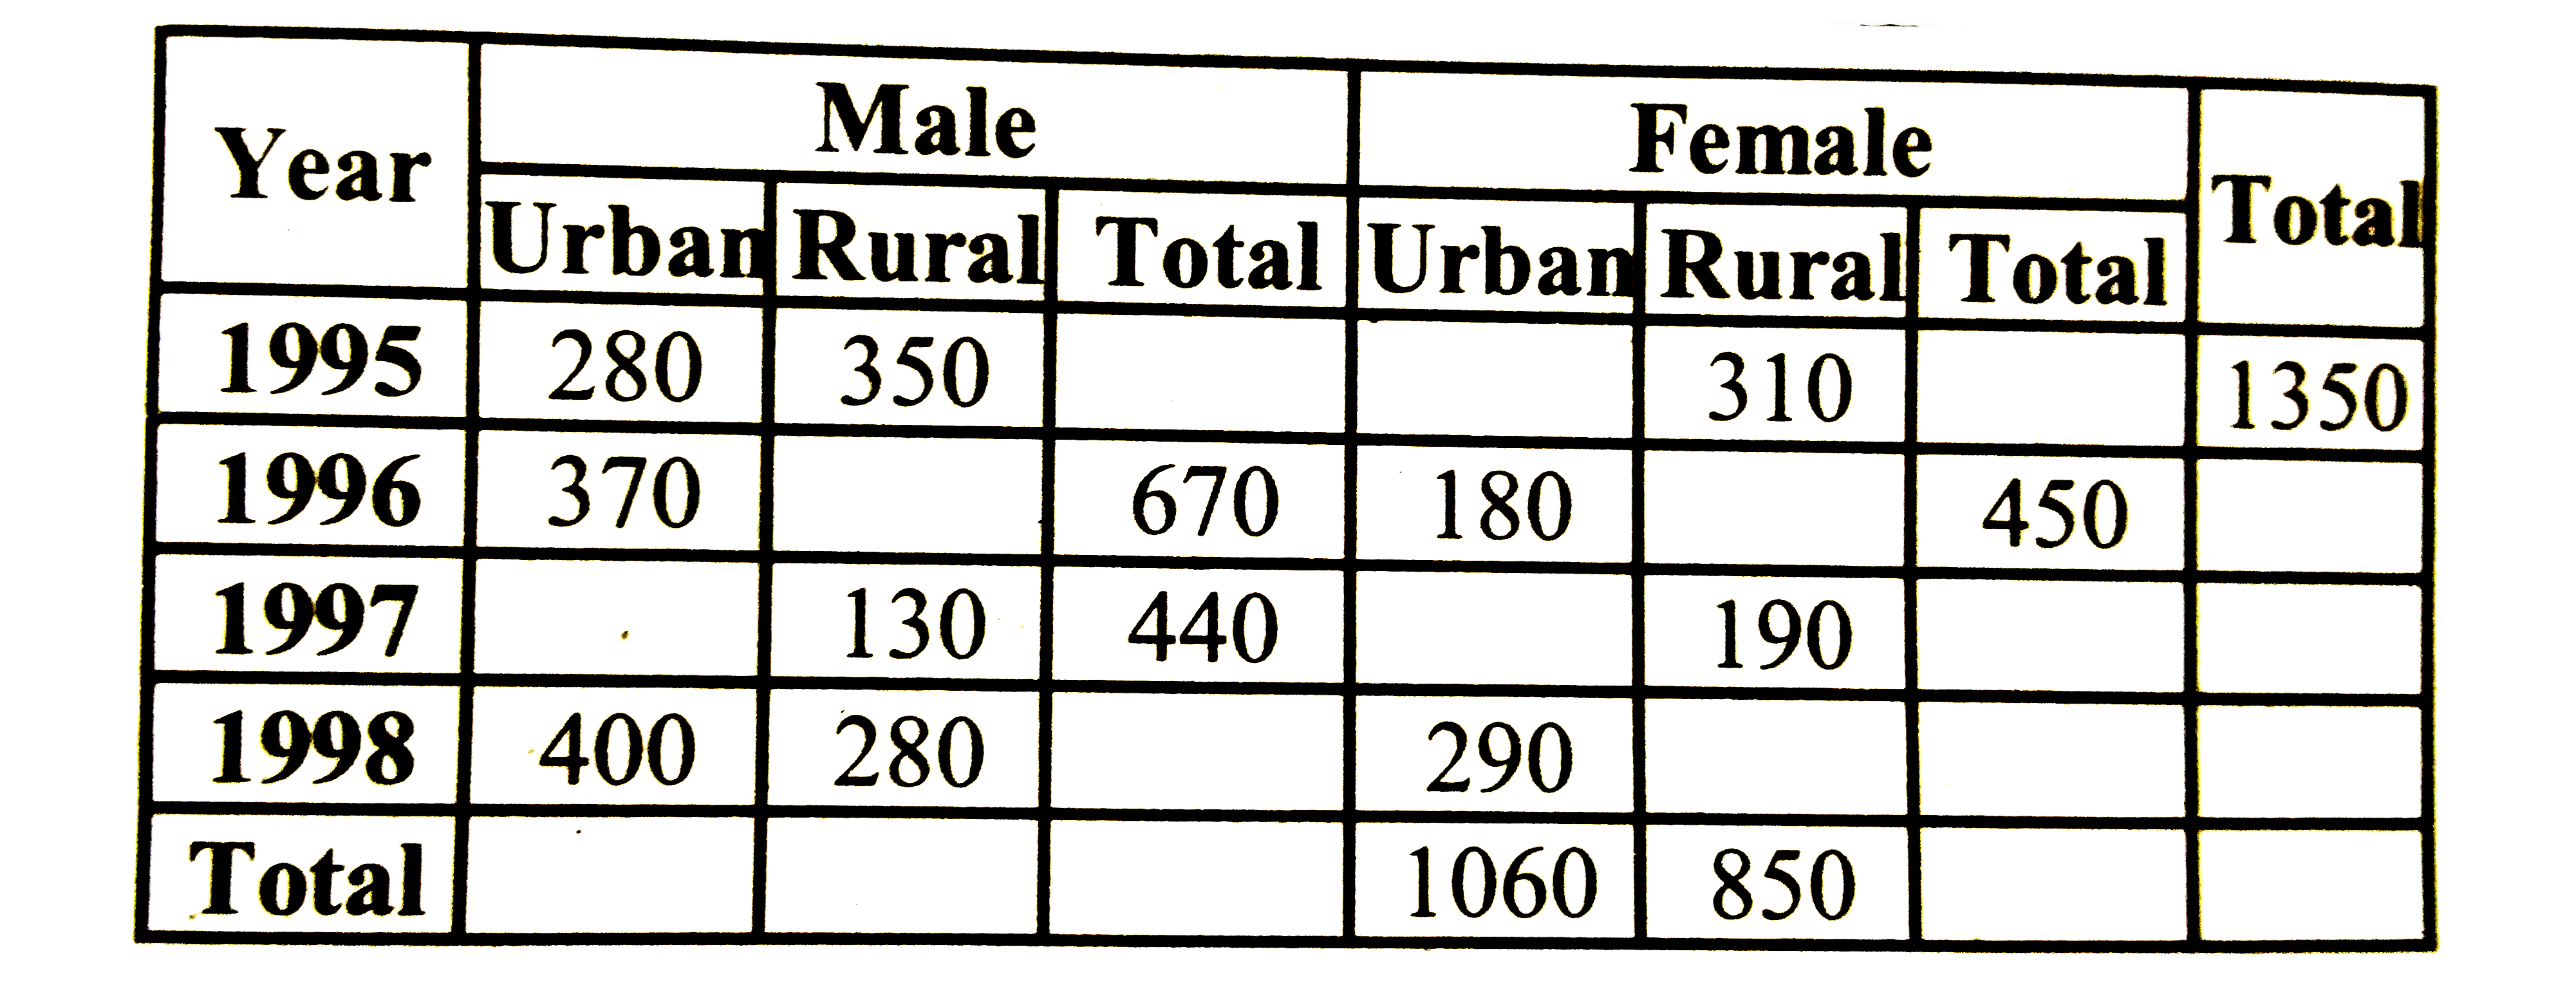
What is the female urban population in the year 1995?01:35View Solution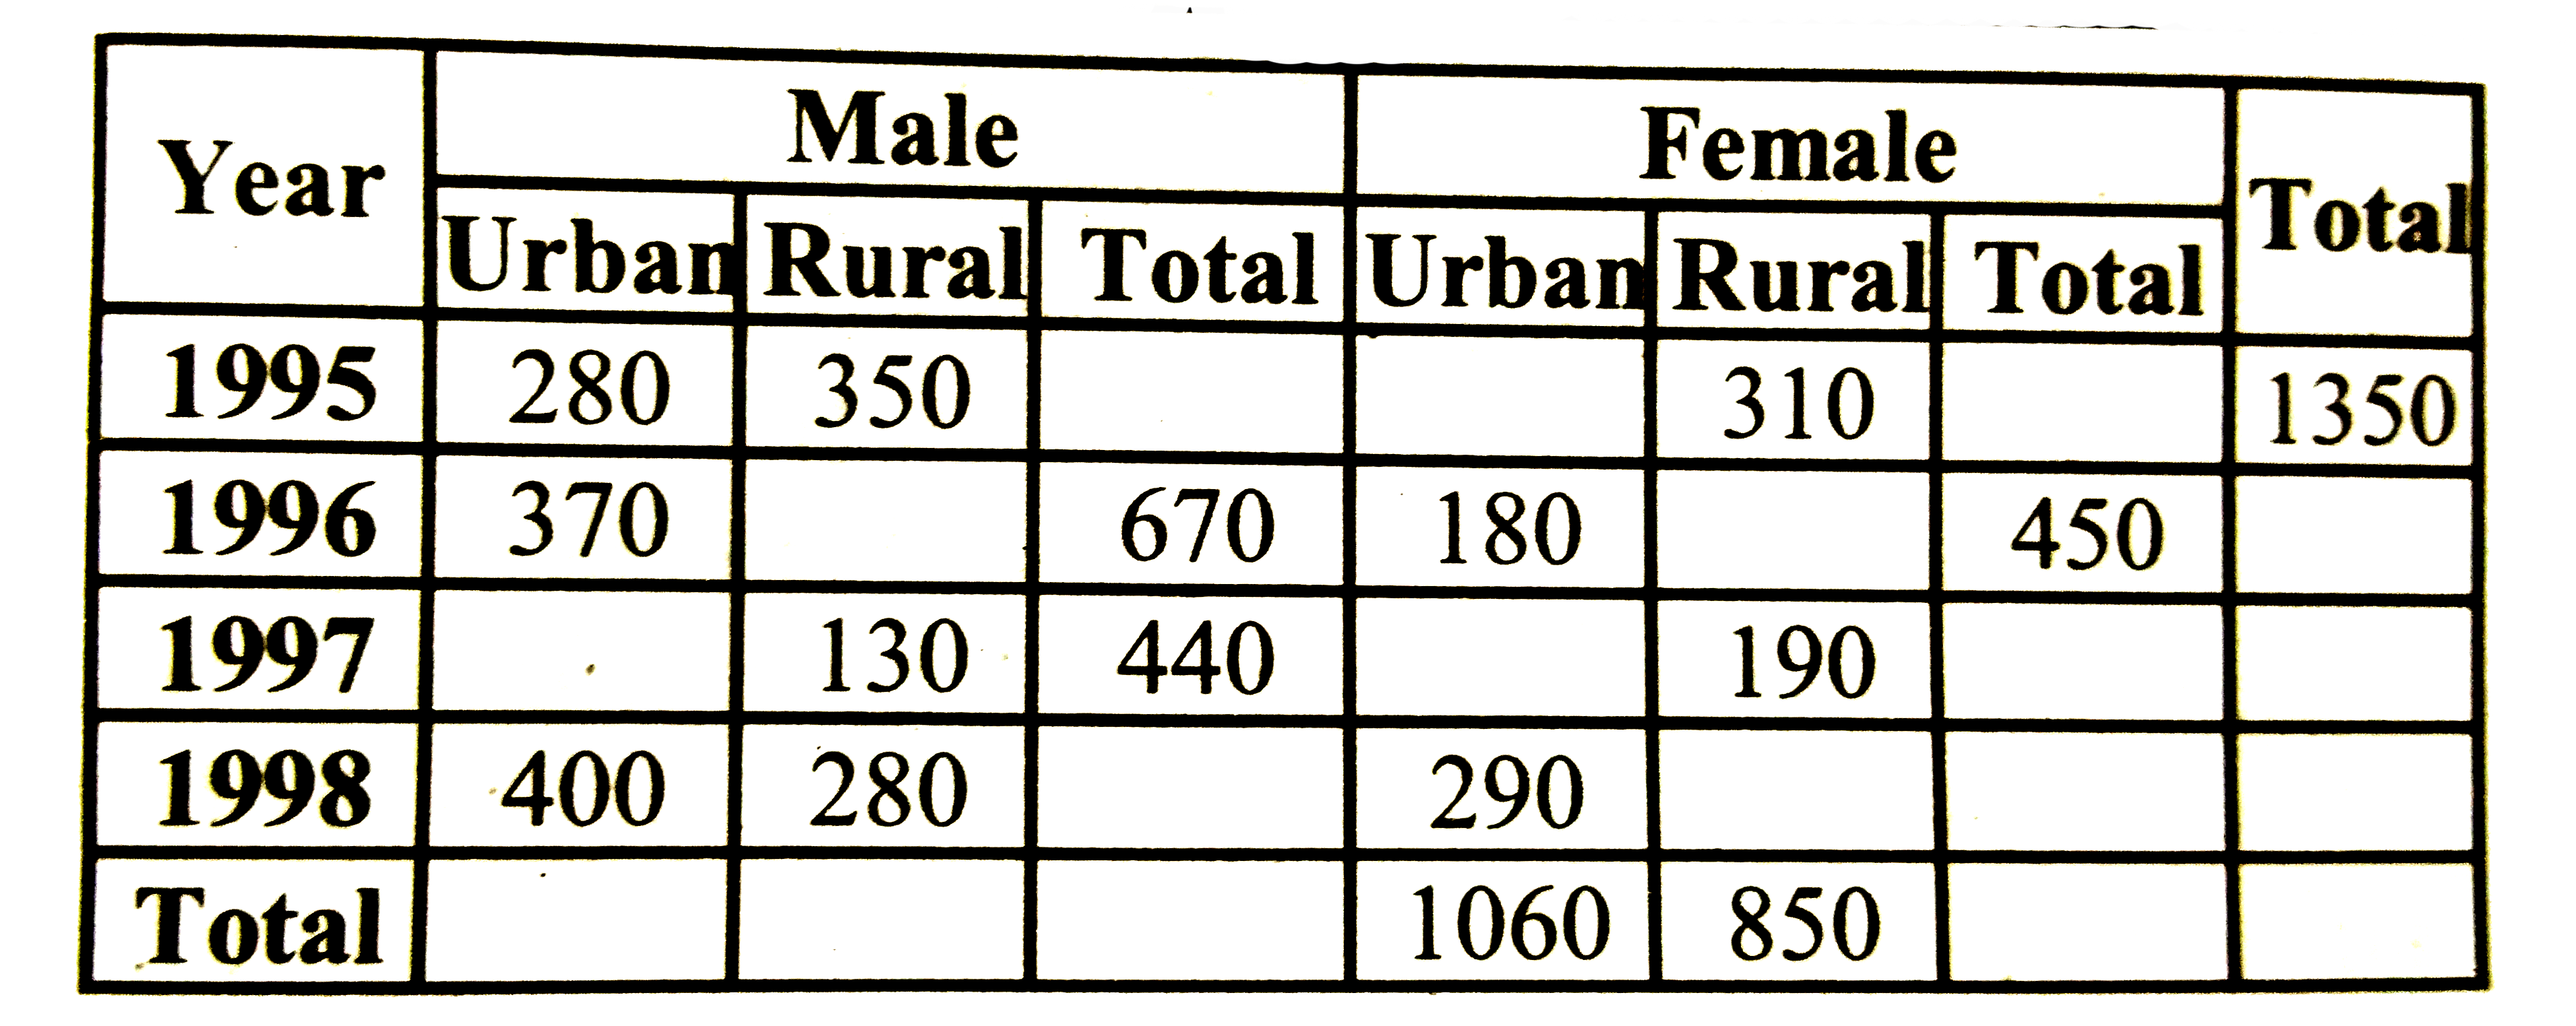
What is the urban population in the year 1997?03:19View Solution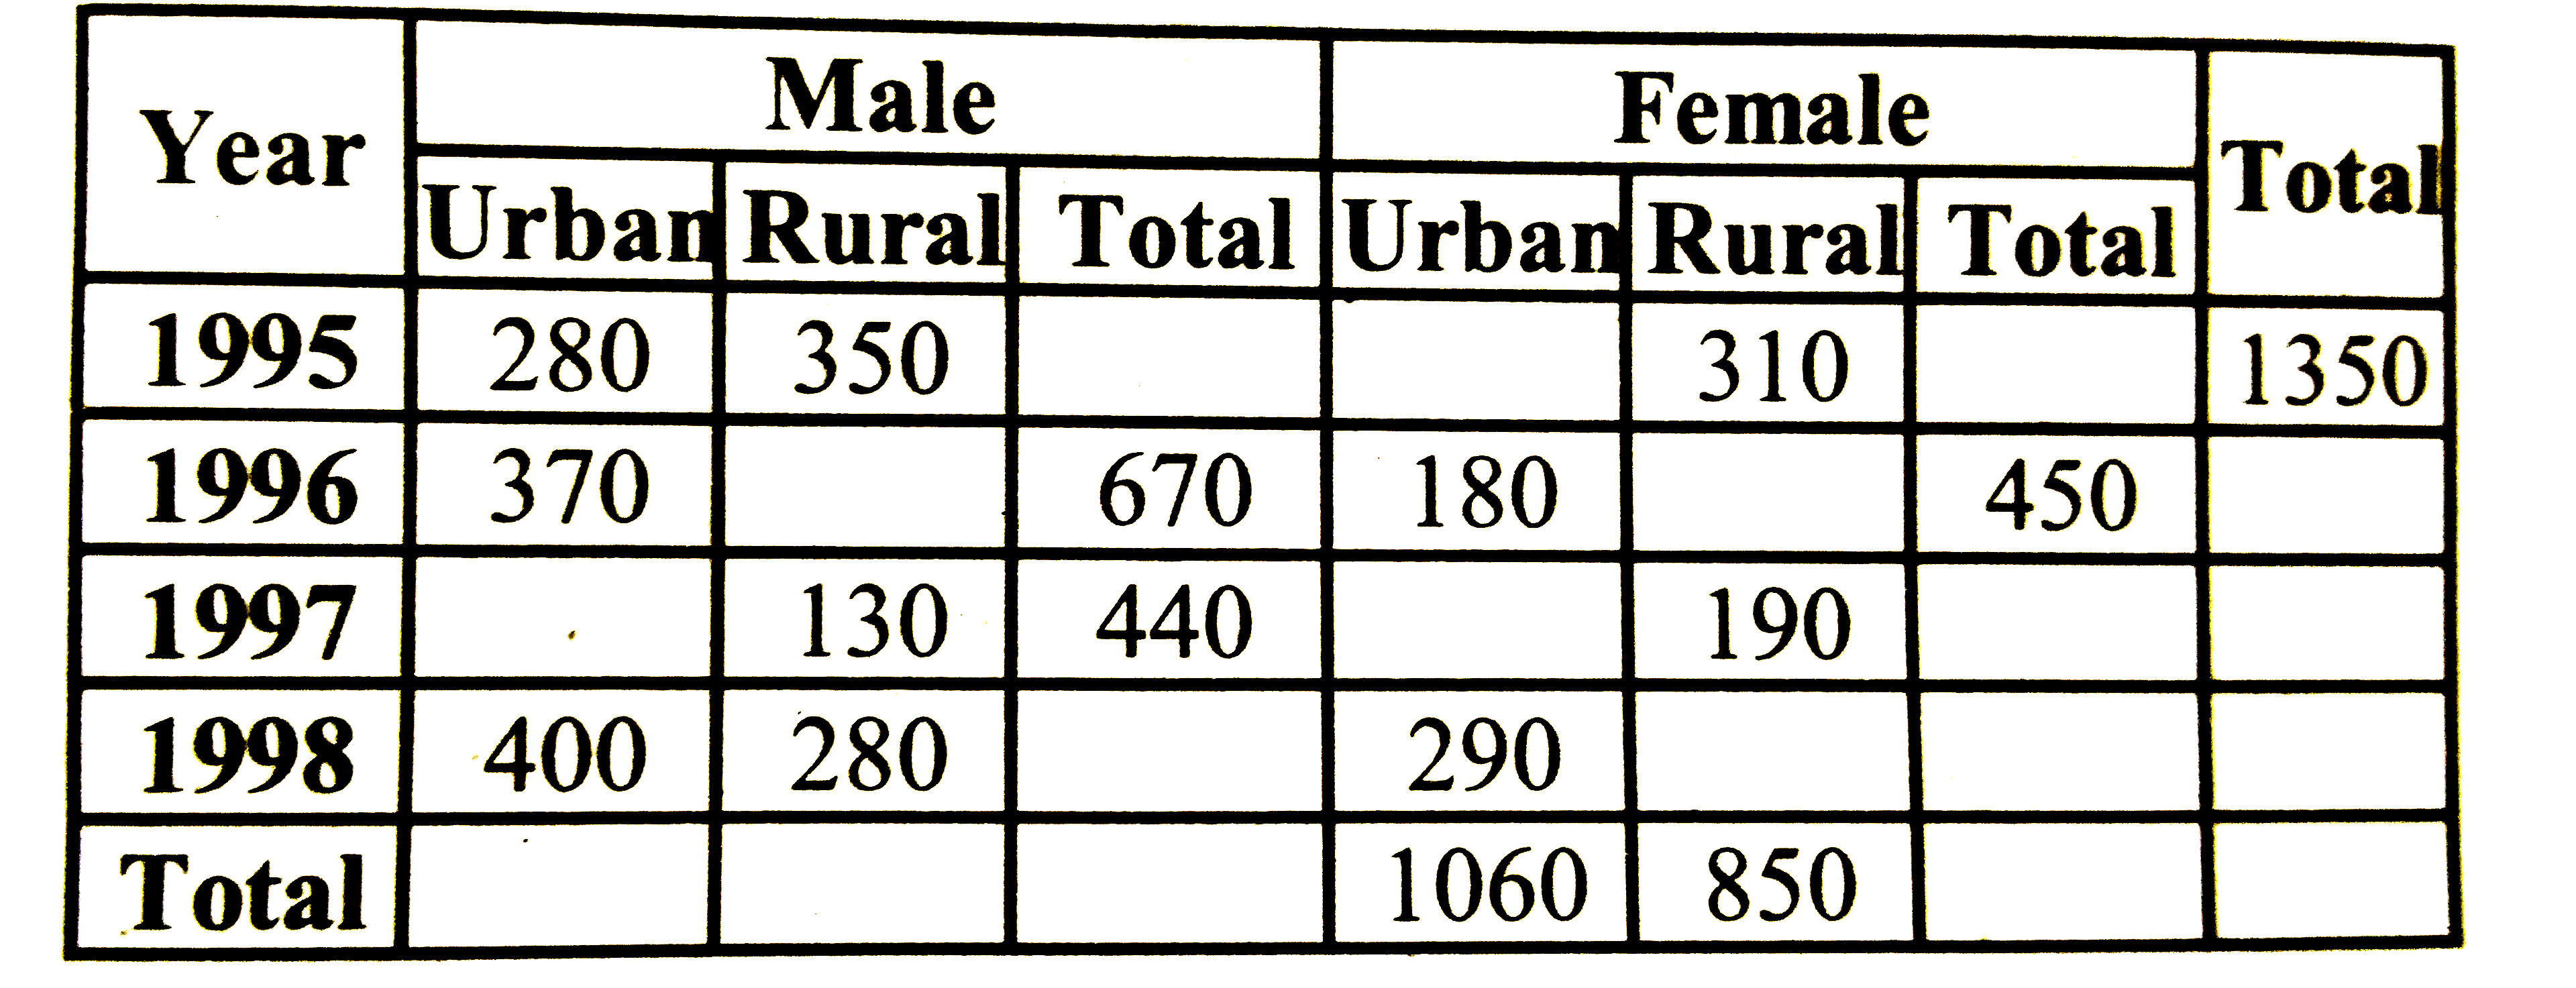
What is the total population in the year 1998?02:28View Solution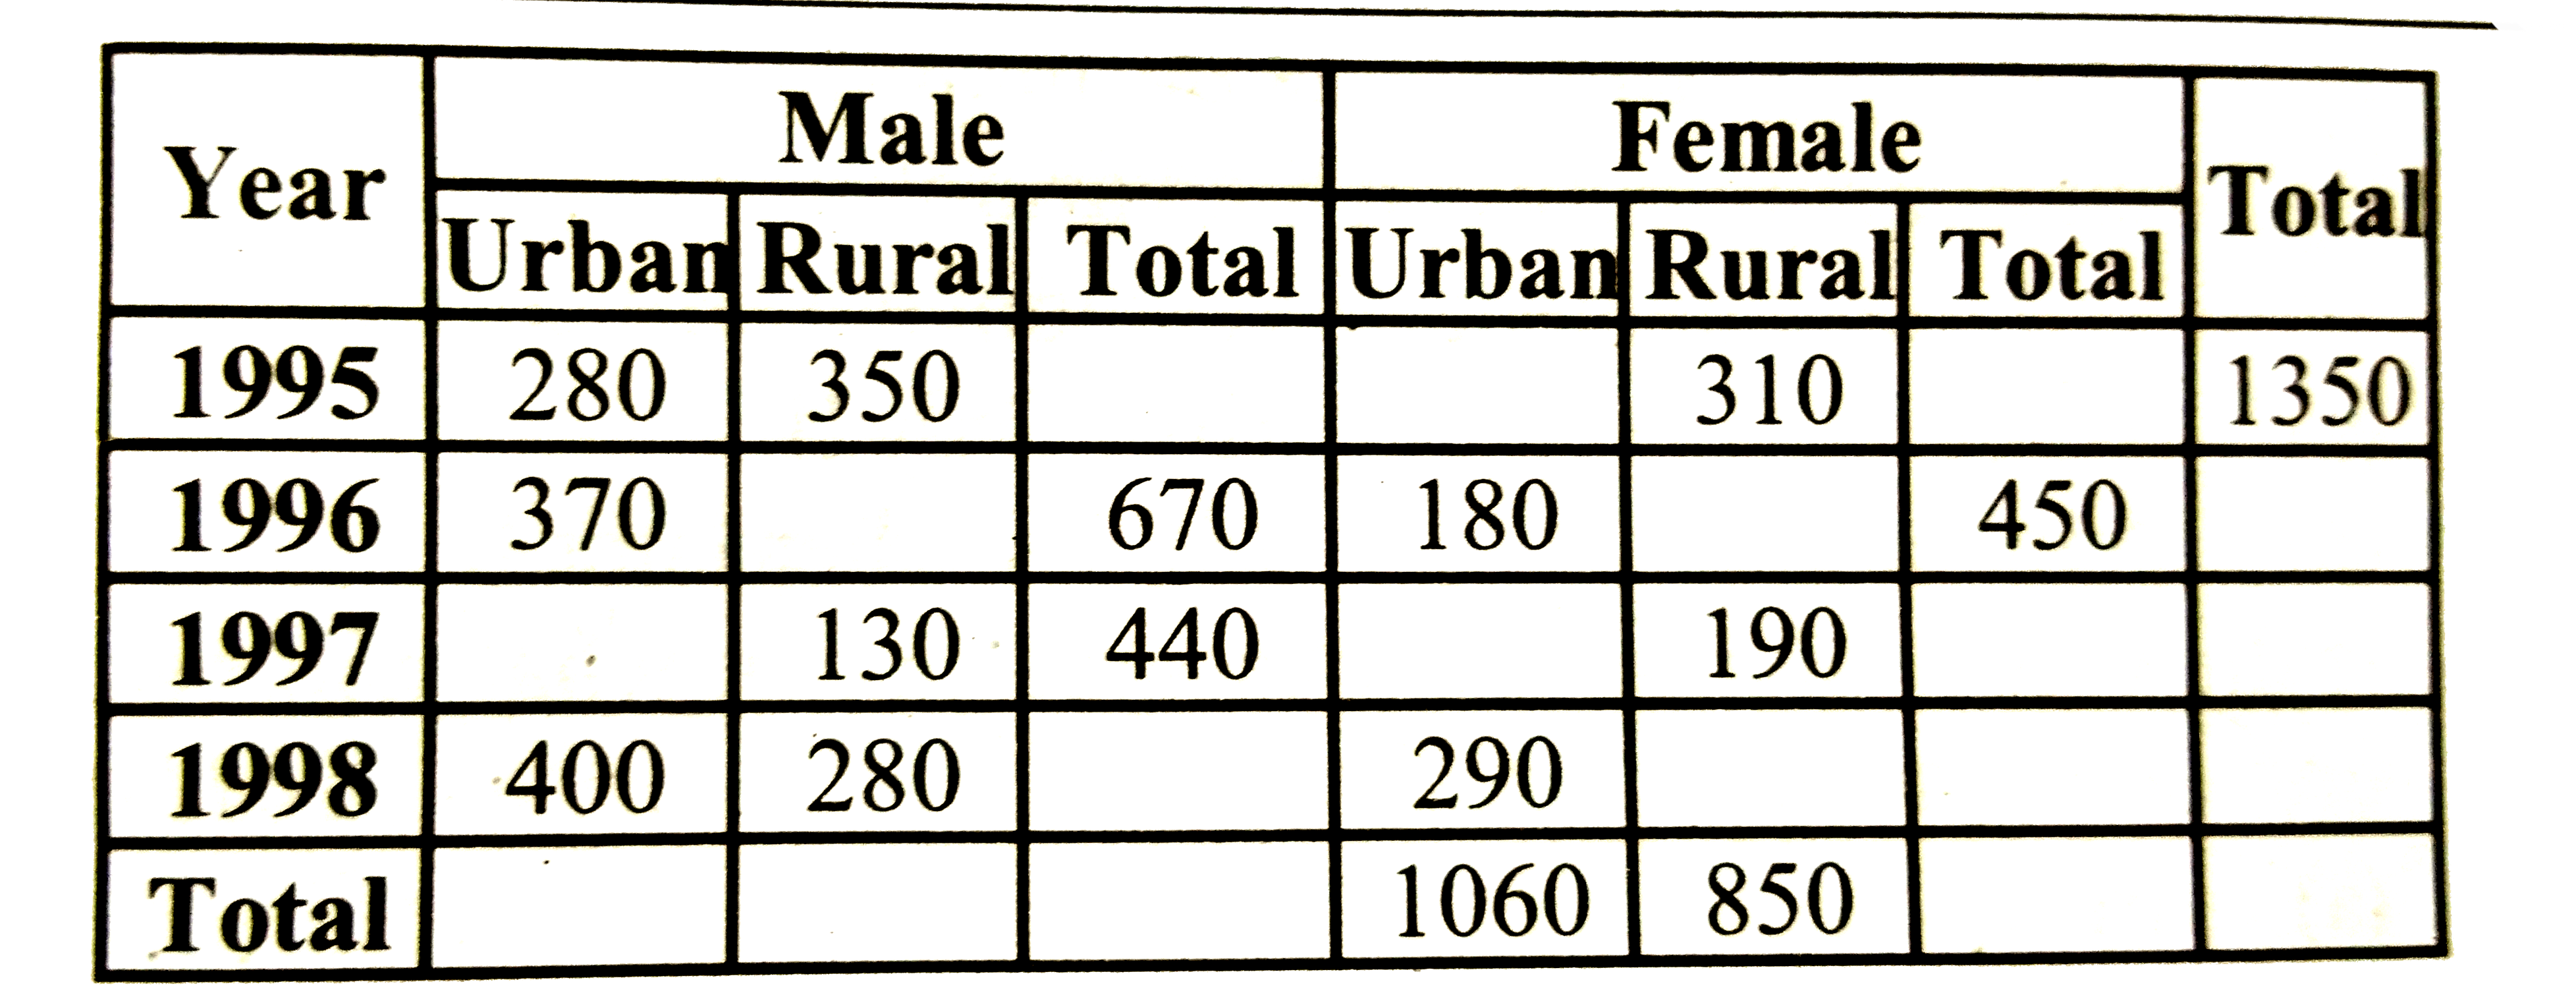
What is the difference between the number of females and the number of males in the year 1995?01:40View Solution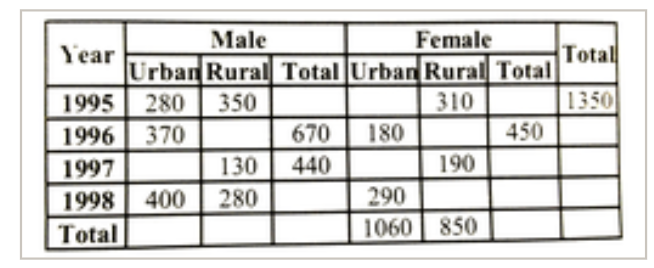
In which year is the male population minimum?01:39View Solution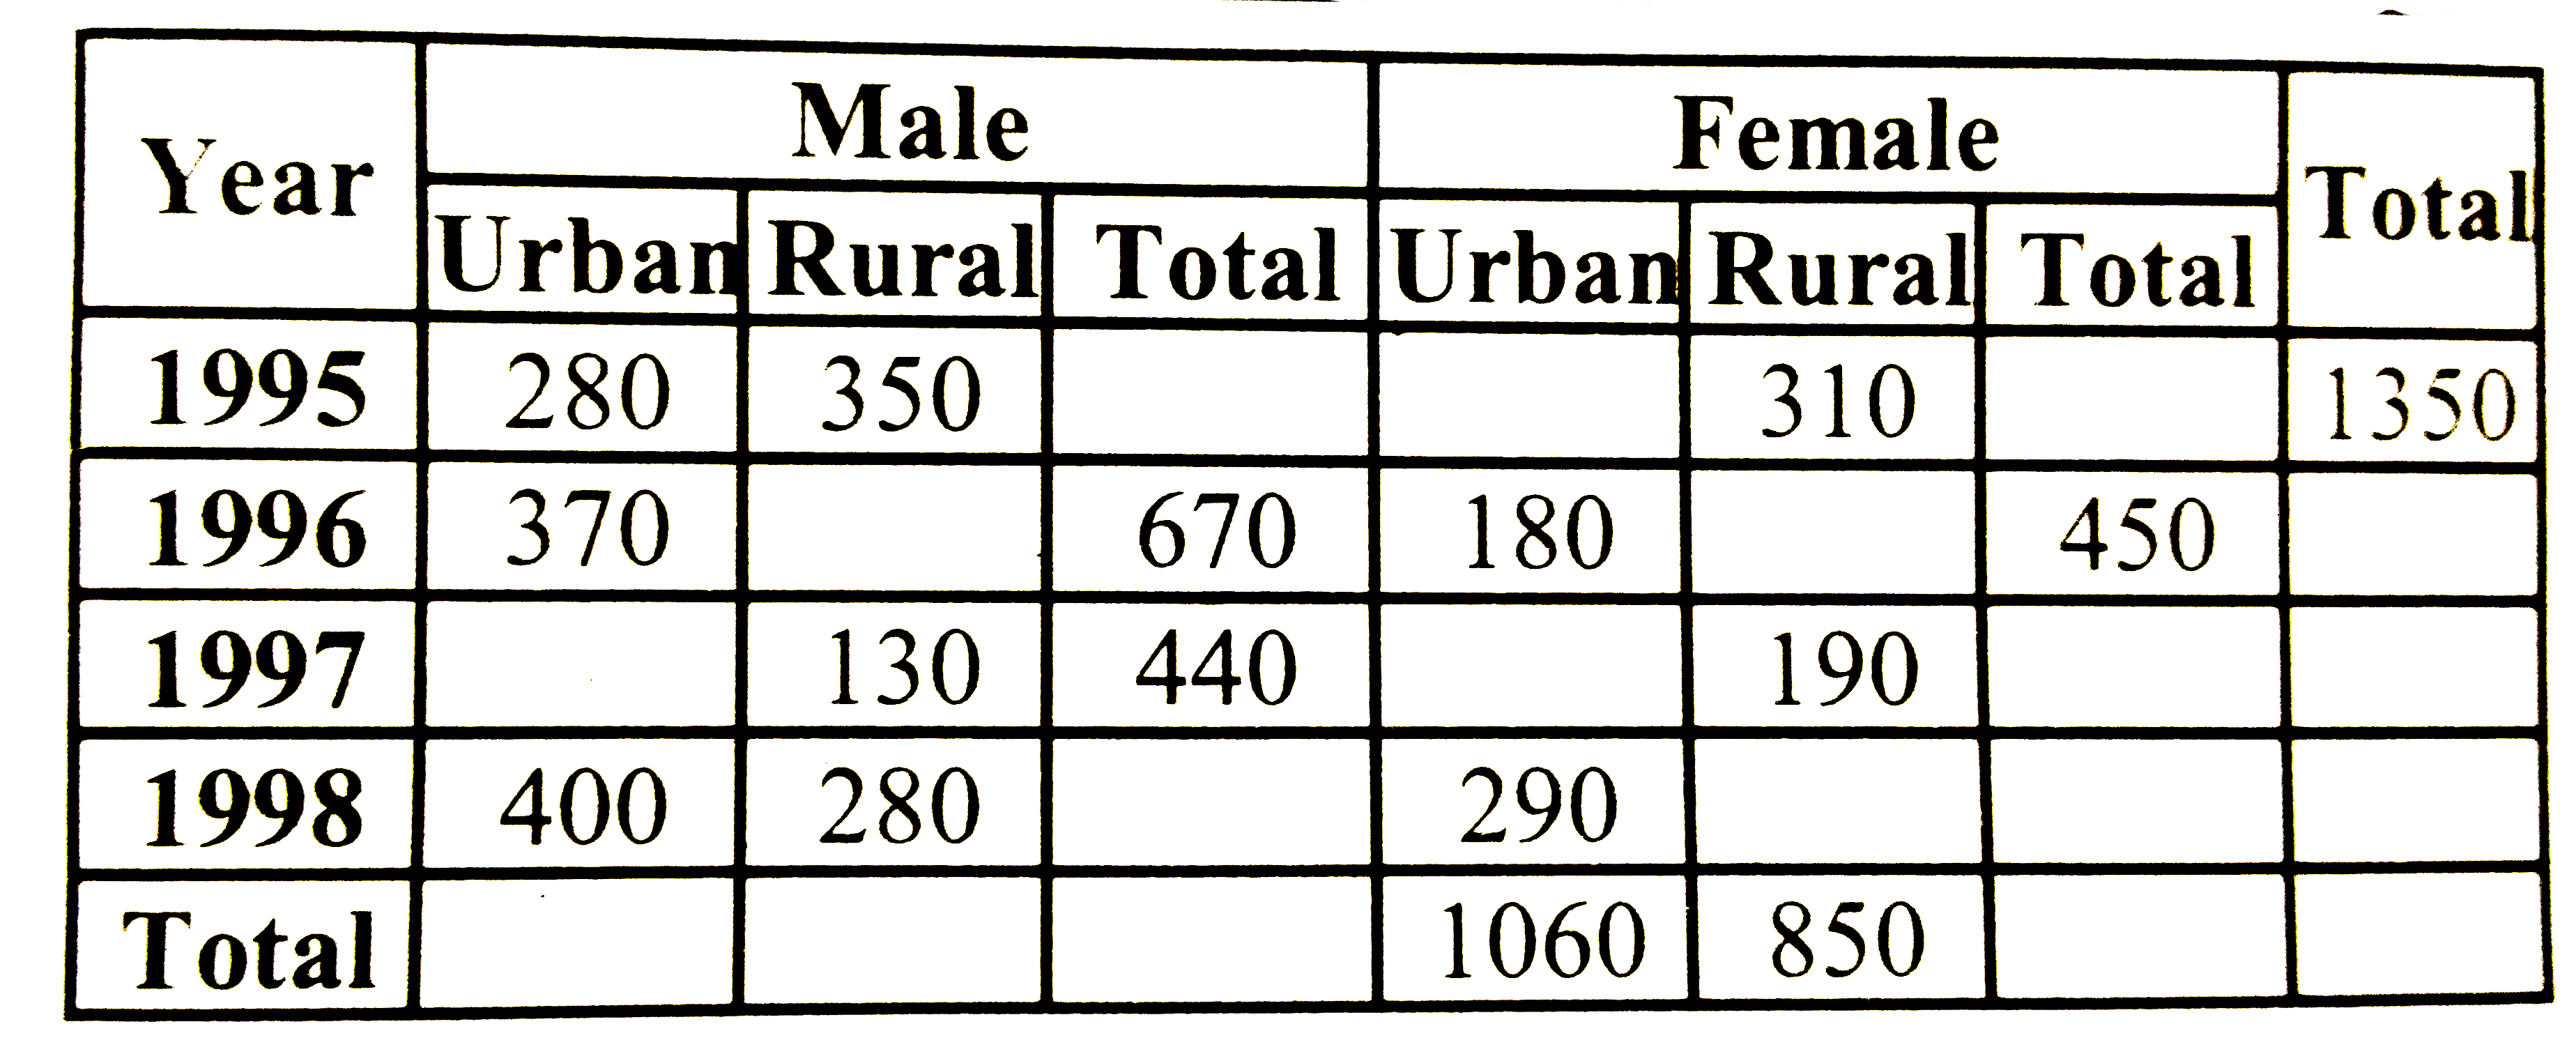
In which year is the female population maximum?03:22View Solution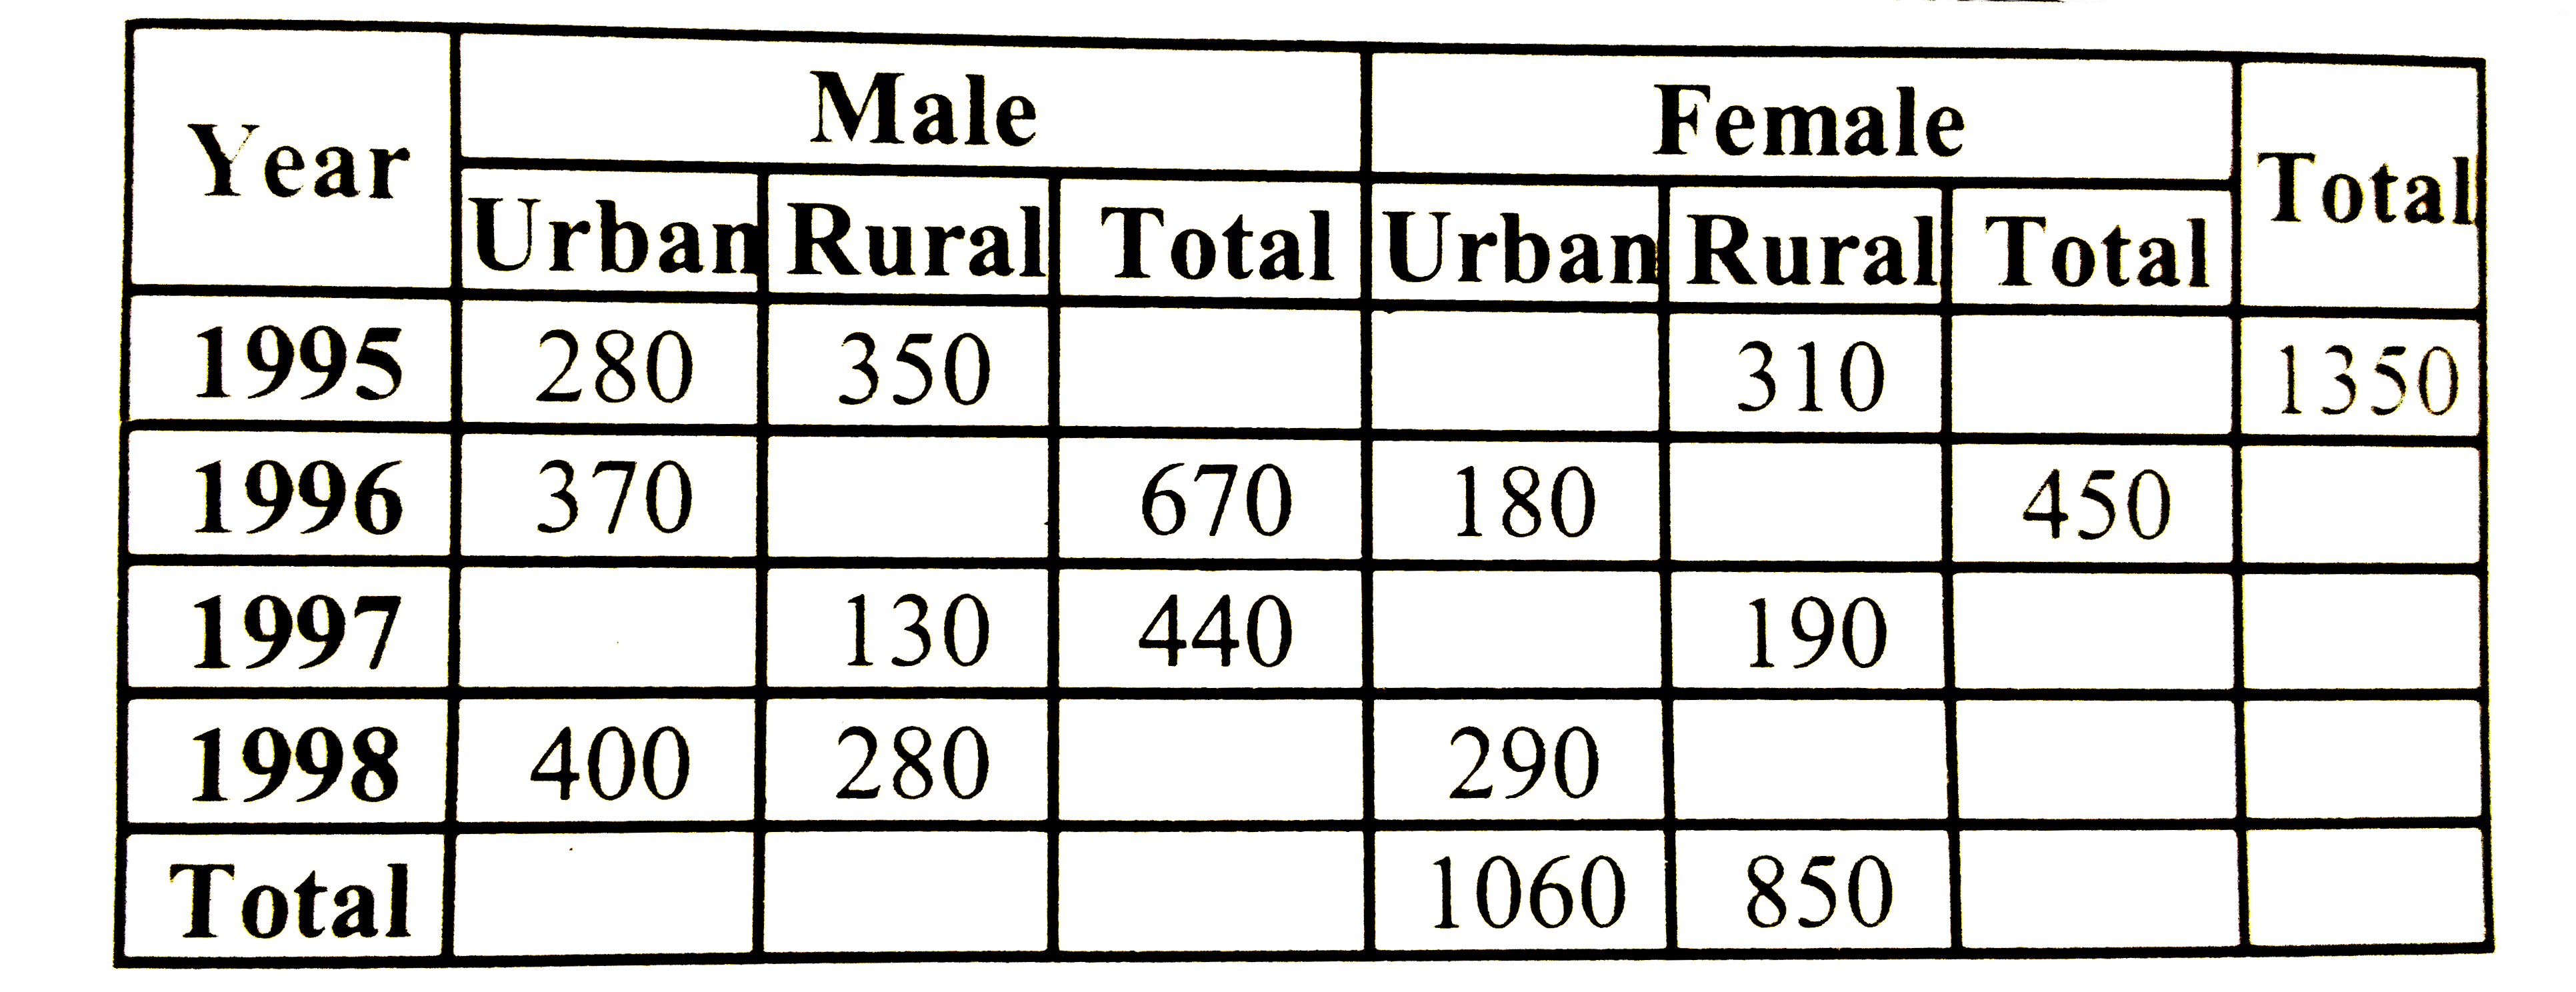
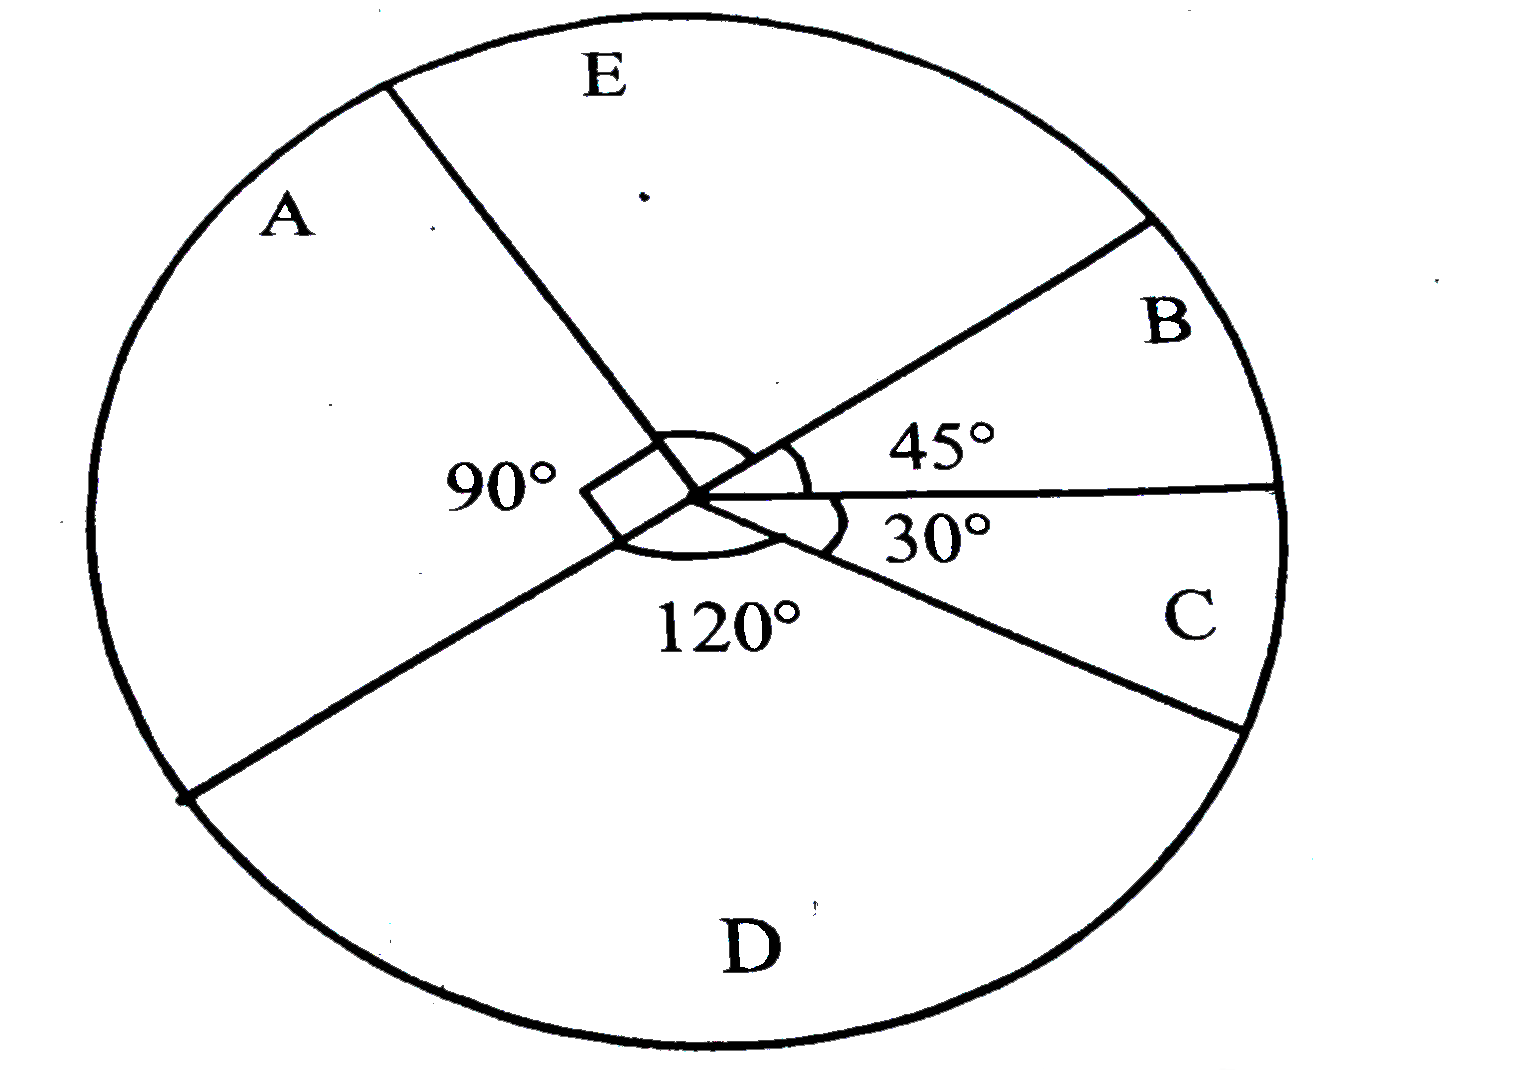
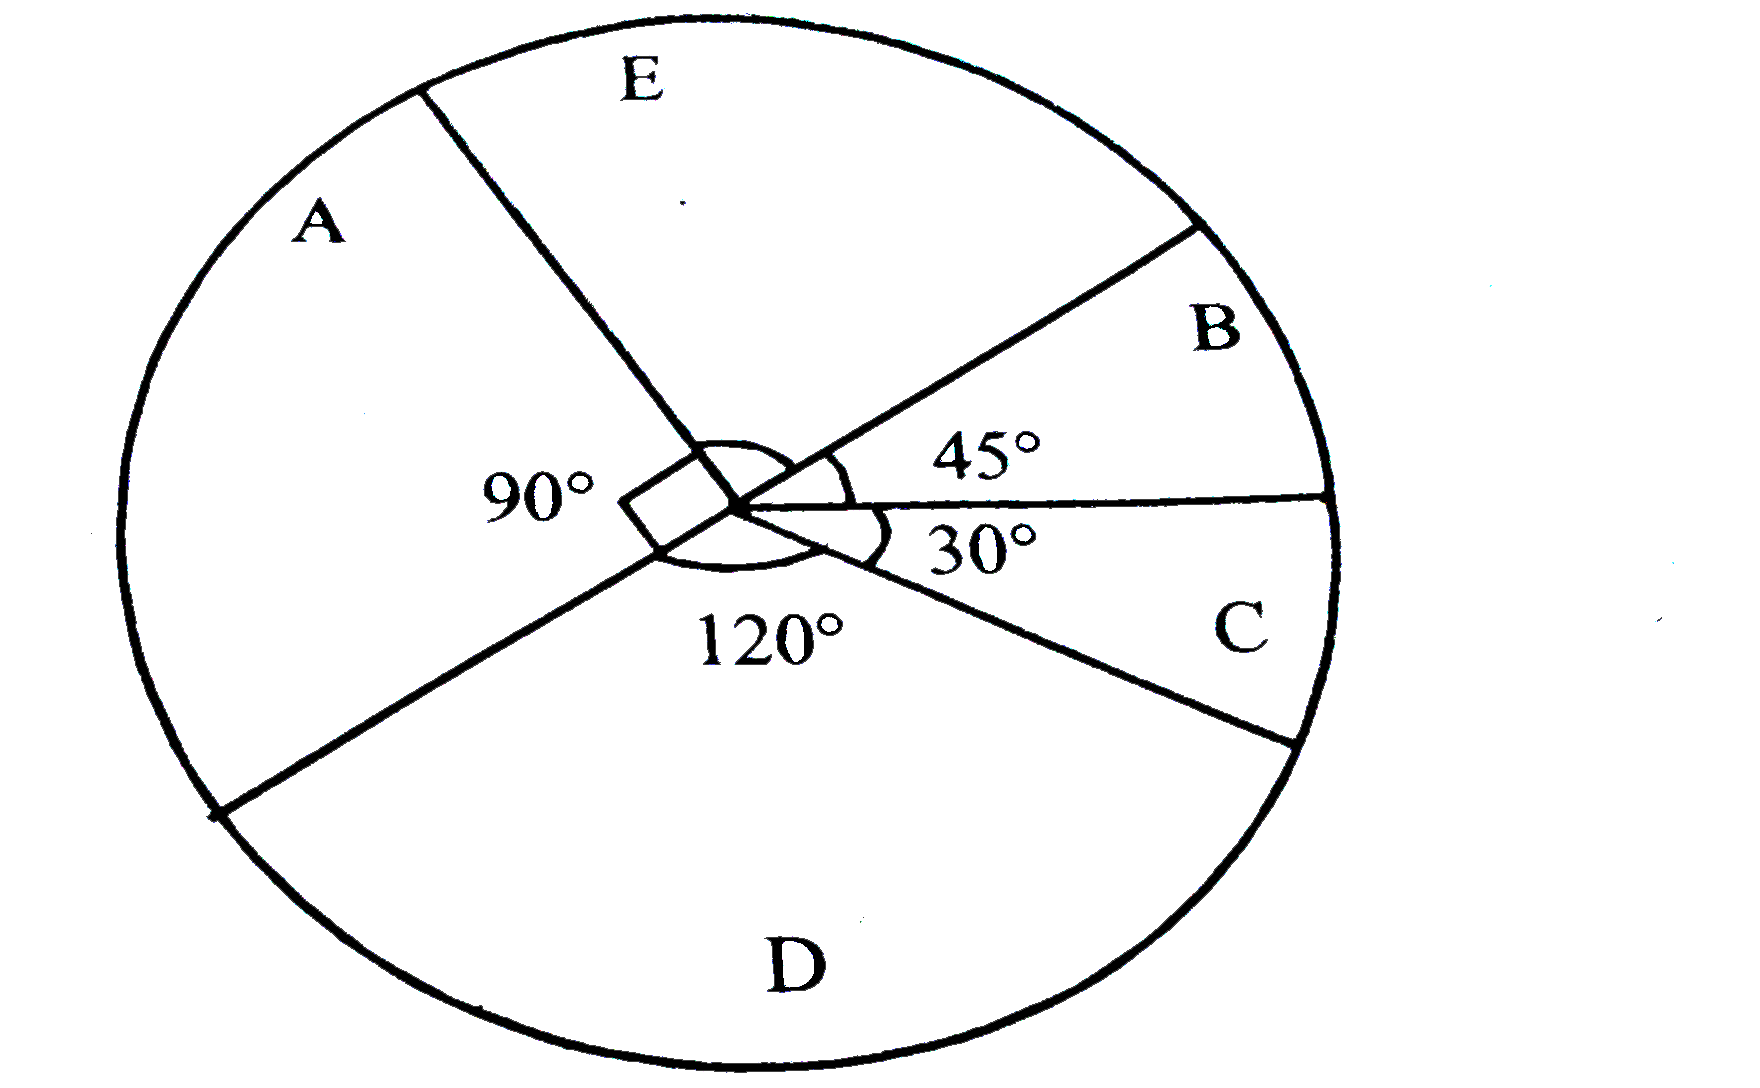
What is the percentage of rural male population (over the whole population) in the year 1998?03:10View SolutionThe following pie chart gives he distribution of funds in a five year plan under the major heads of development expenditures:
Agriculture (A), Industry (B), Education (C), Employment (D) and Miscellaneous (E)
The total allocation is 36,000 (in crores of rupees).
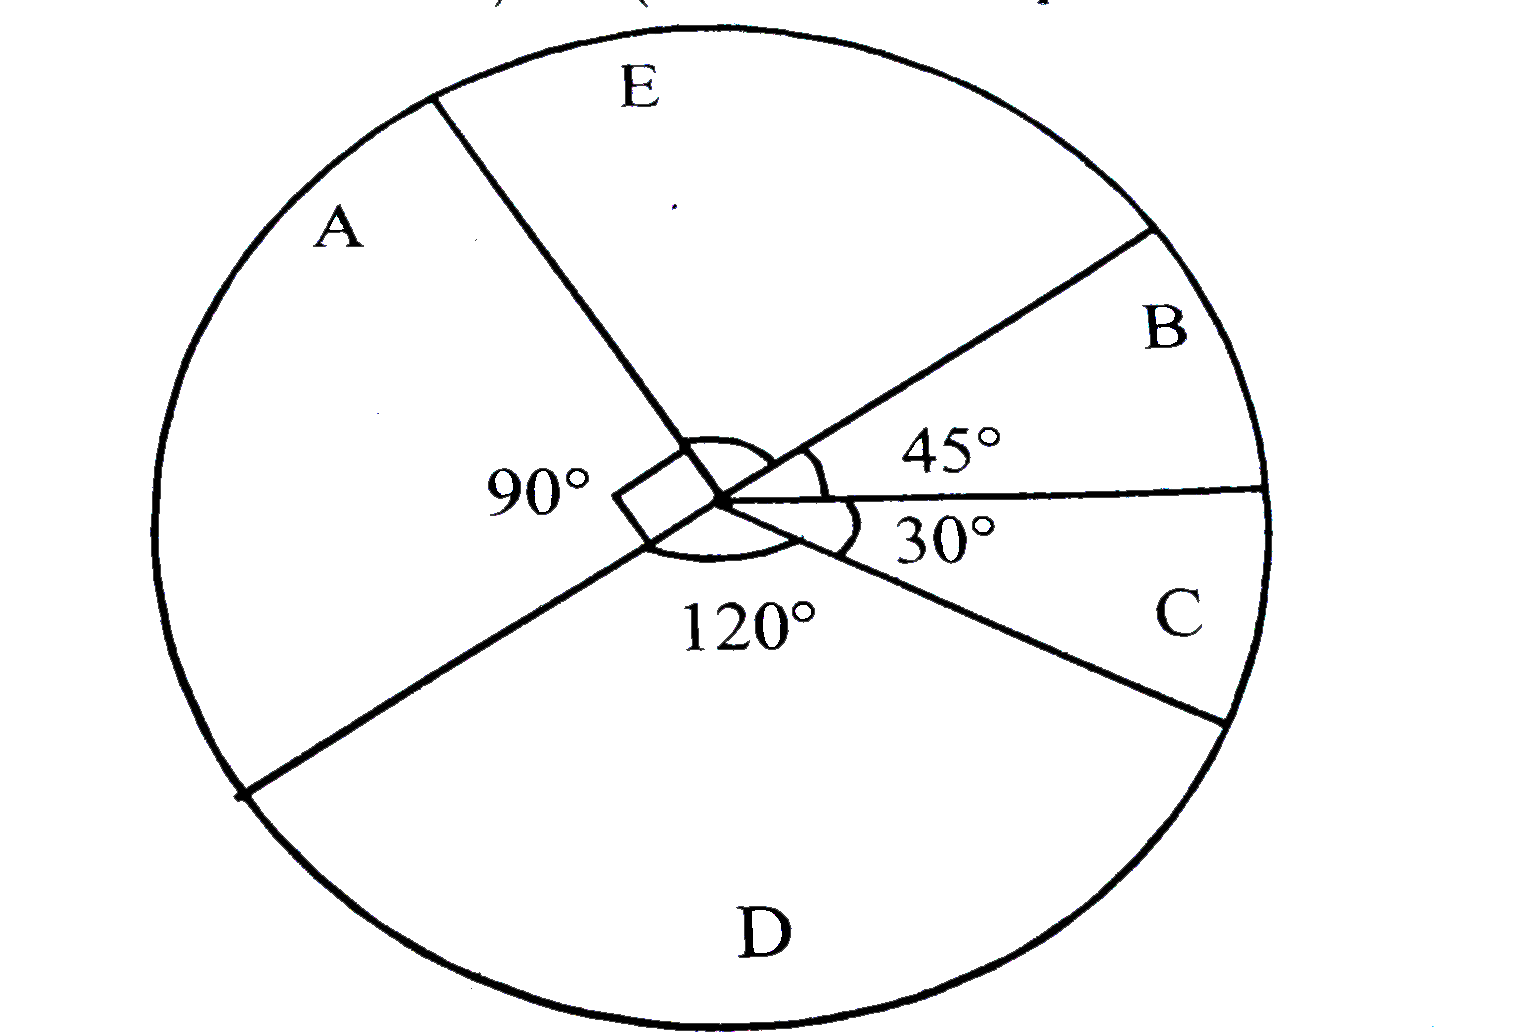
Which head is allocated maximum funds ?02:32View SolutionThe following pie chart gives he distribution of funds in a five year plan under the major heads of development expenditures:
Agriculture (A), Industry (B), Education (C), Employment (D) and Miscellaneous (E)
The total allocation is 36,000 (in crores of rupees).
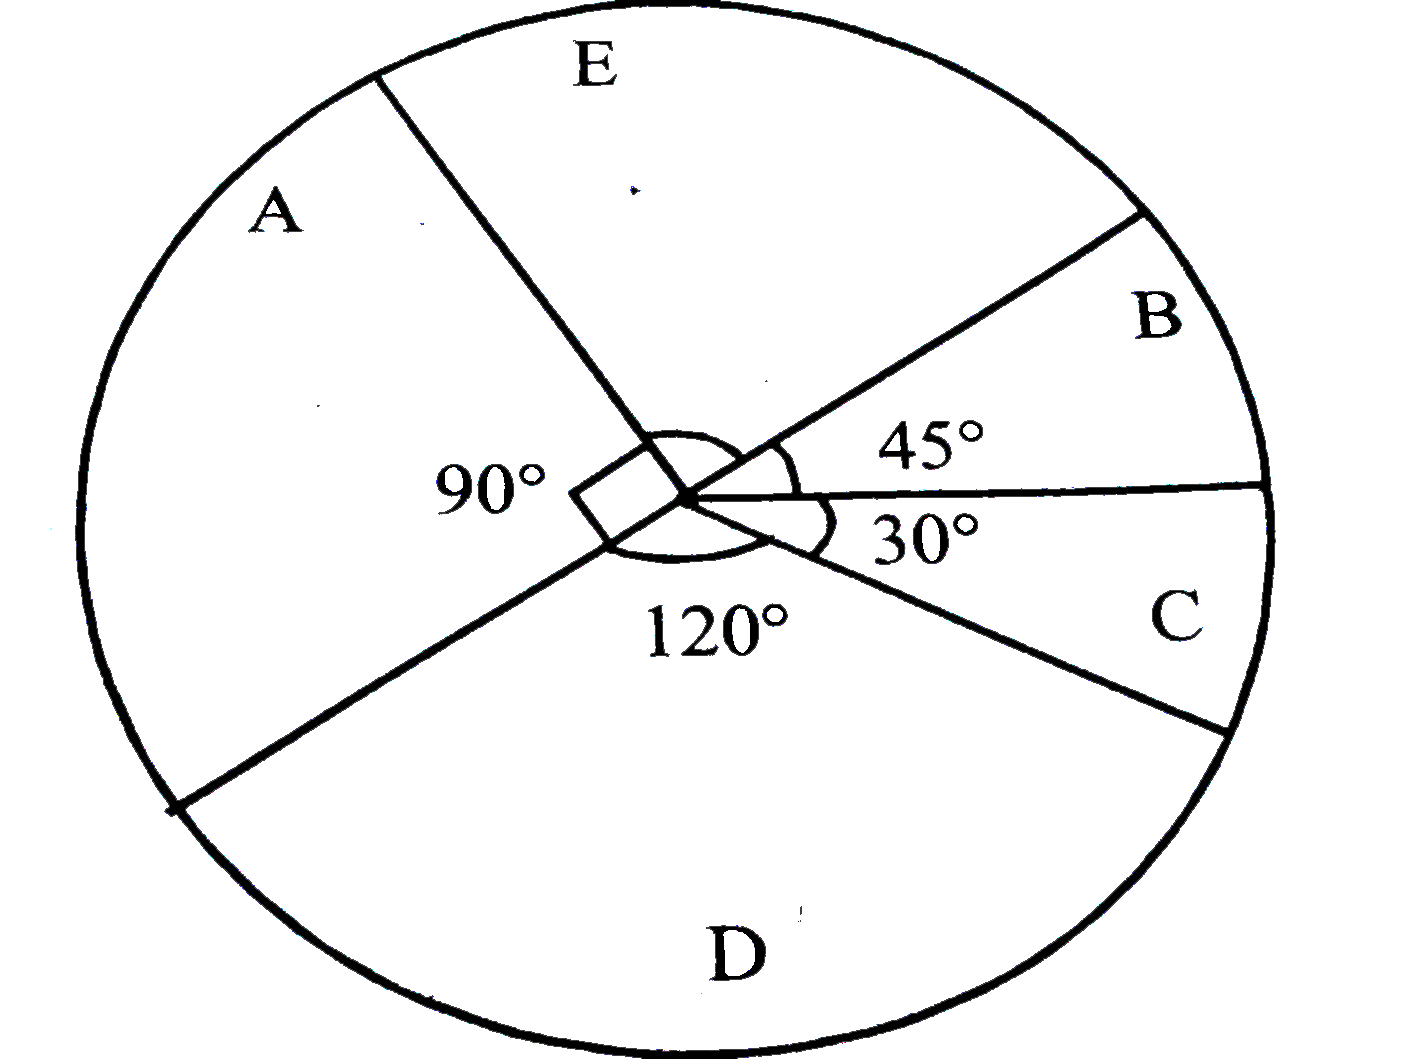
How much money (in crores) is allocated to Education?View SolutionThe following pie chart gives he distribution of funds in a five year plan under the major heads of development expenditures:
Agriculture (A), Industry (B), Education (C), Employment (D) and Miscellaneous (E)
The total allocation is 36,000 (in crores of rupees).
How much money (in crores) is allocated to both Agriculture and Employment?View SolutionThe following pie chart gives he distribution of funds in a five year plan under the major heads of development expenditures:
Agriculture (A), Industry (B), Education (C), Employment (D) and Miscellaneous (E)
The total allocation is 36,000 (in crores of rupees).
How much excess money (in crores) is allocated to Miscellaneous over Education?View SolutionWhat is the median of the distribution 3, 7, 6, 9, 5, 4, 2?
00:56View SolutionWhat is the arithmetic mean of first 16 natural numbers with weights being the number itself?
02:08View SolutionWhat is the mode for the data 20, 20, 20, 21, 21, 21, 21, 21, 22, 22, 22, 22, 22, 22, 22, 23, 23, 23, 23, 23, 24, 24, 25?
01:43View SolutionConsider the following statement:
1. A continuous random variable can take all values in an interval.
2. A random variable which takes a finite number of values is necessarily discrete.
3. Construction of a frequency distribution is based on data which are discrete.
Which of the above statements are correct ?02:37View SolutionConsider the following statements:
1. Two independent variables are always uncorrelated.
2. The coefficient of correlation between two variables X and Y is positive when X decreases then Y decreases. Which of the above statements is/are correct?01:58View SolutionA variate X takes value 2, 9, 3, 7, 5, 4, 3, 2, 10. What is the median?
01:01View SolutionThe mean of 10 observations is 5. If 2 is added to each observation and then multiplied by 3, then what will be the new mean?
01:42View SolutionThe arithmetic mean of first `n` odd natural numbers, is
00:35View SolutionThe arithmetic mean of numbers a, b, c, d, e is M. What is the value of `(a-M)+(n-M)+(n-M)+(d-M)+(e-M)`?
00:53View SolutionThe algebraic sum of the deviations of 20 observations measured from 30 is 2. What would be the mean of the observations?
01:28View SolutionThe median of 27 observations of a variable is 18. Three more observations are made and the values of these observations are 16, 18 and 50. What is the median of these 30 observations?
04:28View SolutionFrequency curve may be:
00:41View Solution
MCQs questions and complete solutions for chapter STATISTICS of NDA PREVIOUS YEARS of Class 12
