All Questions from RD SHARMA MATHS Chapter 12 STATISTICS for Class 10
| Class 10 | MATHS |
| Chapter | STATISTICS |
| RD SHARMA MATHS | All Questions |
| Medium | English |
| Academic Year | 2023-2024 |
Question 30
The frequency distribution of scores obtained by 230 candidates in a medical entrance test is as follows:
Scores: 400-450 450-500 500-550 550-600 600-650 650-700 700-750 750-800 No. of Candidates 20 35 40 32 24 27 18 24
Draw cumulative frequency curves by less than and more than method on the same axes. Also, draw the two types of cumulative frequency polygons.View SolutionQuestion 38
Find the mean marks of students from the following cumulative frequency distribution:
marks No. of Students Marks No. of Students 0 and above 10 and above 20 and above 30 and above 40 and above 50 and above 80 77 72 65 55 43 60 and above 70 and above 80 and above 90 and above 100 and above 28 16 10 8 0View SolutionQuestion 61
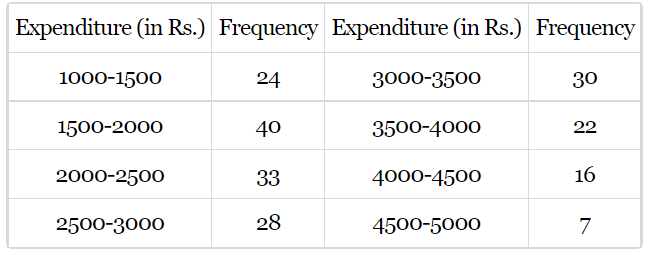
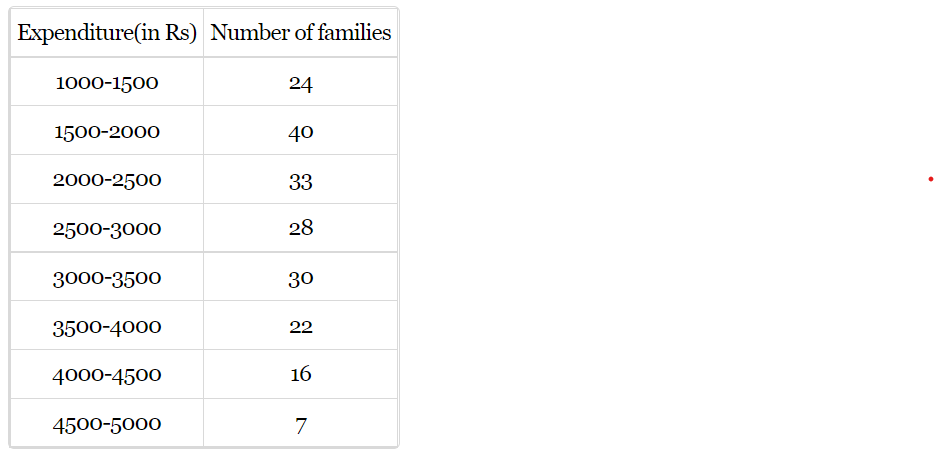
The following table gives the distribution of total household expenditure (in rupees) of manual workers in a city. Expenditure: (in Rs.) 100-150 150-200 200-250 250-300 300-350 350-400 400-450 450-500 Frequency: 24 40 33 28 30 22 16 7 Find the average expenditure (in Rs.) per household.View SolutionQuestion 62
A frequency distribution of the life times of 400 T.V. picture tubes tested in a tube company is given below. Find the average life of tube. Life Time (in hrs) Frequency Life time (in hrs) Frequency 300-399 400-499 500-599 600-699 700-799 14 46 58 76 68 800-899 900-999 1000-1099 1100-1199 62 48 22 6View SolutionQuestion 103
Five coins were simultaneously tossed 1000 times and at each toss the number of heads were observed. The number of tosses during which 0, 1, 2, 3, 4 and 5 heads were obtained are shown in the table below. Find the mean number of heads per toss. No. of heads per toss No. of tosses 0 38 1 144 2 342 3 287 4 164 5 25 Total 1000View SolutionQuestion 109
Five coins were simultaneously tossed 1000 times, and at each toss the number of heads was observed. The number of tosses during which 0, 1, 2, 3, 4 and 5 heads were obtained are shown in the table below. Find the mean number of heads per toss No. of heads per toss (x) : 0 1 2 3 4 5 No. of tosses (f) : 38 144 342 287 164 25View SolutionQuestion 117
The following table gives the distribution of total household expenditure (in rupees) of manual workers in a city. Expenditure (in rupees) (xi) Frequency (fi) 100-150 24 150-200 40 200-250 33 250-300 28 300-350 30 350-450 22 400-450 16 450-500 7 Find the average expenditure (in rupees) per household.View SolutionQuestion 118
A survey was conducted by a group of students as a part of their environment awareness programme, in which they collected the following data regarding the number of plants in 20 houses in a locality. Find the mean number of plants per house. Number of plants: 0-2 2-4 4-6 6-8 8-10 10-12 12-14 Number of houses: 1 2 1 5 6 2 3 Which method did you use for finding the mean, and why?View SolutionQuestion 120
Thirty women were examined in a hospital by a doctor and the number of heart beats per minute recorded and summarised as follows. Find the mean heart beats per minute for these women, choosing a suitable method. No. of heat 65-68 68-71 71-74 74-77 77-80 80-83 83-86 beats (per min.) No. of women: 2 4 3 8 7 4 2View SolutionQuestion 135
In a retail market, fruit vendors were selling mangoes kept in packing boxes. These boxes contained varying number of mangoes. The following was the distribution of mangoes according to the number of boxes. No. of mangoes: 50-52 53-55 56-58 59-61 62-64 No. of boxes: 15 110 135 115 25 Find the mean number of mangoes kept in a packing box. Which method of finding the mean did you choose?View SolutionQuestion 137
To find out the concentrations of SO2 in the air (in parts per million, i.e., ppm), the data was collected for 30 localities in a certain city and is presented below: Concentration of SO2 (in ppm) Frequency 0.00 - 0.04 4 0.04 - 0.08 9 0.08 - 0.12 9 0.12 - 0.16 2 0.16 - 0.20 4 0.20 - 0.24 2 Find the mean concentration of SO2 in the air.View SolutionQuestion 155
The following table gives the frequency distribution of married women by age at marriage: Age (in years) Frequency Age (in years) Frequency 15-19 53 40-44 9 20-24 140 45-49 5 25-29 98 50-54 3 30-34 32 55-59 3 35-39 12 60 and above 2 Calculate the median and interpret the resultsView SolutionQuestion 157
The median of the following data is 525. Find the missing frequency, if it is given that there are 100 observations in the data: Class interval Frequency Class interval Frequency 0 100 2 500 600 20 100 200 5 600 700 f2 200 300 f1 700 800 9 300 400 12 800 900 7 400 500 17 900 1000 4View SolutionQuestion 162
The lengths of 40 leaves of a plant are measured correct to the nearest millimetre, and the data obtained is represented in the following table: Length (in mm): 118-126 127-135 136-144 145-153 154-162 163-171 172-180 No. of leaves: 3 5 9 12 5 4 2 Find the mean length of leaf.View SolutionQuestion 178
100 surnames were randomly picked up from a local telephone directly and the frequency distribution of the number of letters in the English alphabets in the surnames was obtained as follows:

Determine the median number of letters in the surnames. Find the mean number of letters in the surnames. Also, find the modal size of the surnames.View SolutionQuestion 183
The marks scored by 750 students in an examination are given in the form of a frequency distribution table: Marks No. of students Marks No. of students 600-640 16 760-800 172 640-680 45 800-840 59 680-720 156 840-880 18 720-760 284 Prepare a cumulative frequency table by less than method and draw an ogive.View SolutionQuestion 187
The annual profits earned by 30 shops of a shopping complex in a locality give rise to the following distribution: Profit (in lakhs in Rs) Number of shops (frequency) More than or equal to 5 30 More than or equal to 10 28 More than or equal to 15 16 More than or equal to 20 14 More than or equal to 25 10 More than or equal to 30 7 More than or equal to 35 3 Draw both ogives for the above data and hence obtain the median.View SolutionQuestion 188
The following distribution gives the daily income of 50 workers of a factory: Daily income (in Rs): 100-120 120-140 140-160 160-180 180-200 Number of workers: 12 14 8 6 10 Convert the above distribution to a less than type cumulative frequency distribution and draw its ogive.View Solution




 2
2
