Given below is a table which shows the yearwise strength of a school. Represent this data by a bar graph

Step by step video & image solution for Given below is a table which shows the yearwise strength of a school. Represent this data by a bar graph by Maths experts to help you in doubts & scoring excellent marks in Class 7 exams.
Updated on:21/07/2023Topper's Solved these Questions
- BAR GRAPHSBOOK - RS AGGARWALCHAPTER - BAR GRAPHSEXERCISE - EXERCISE 22
22 Videos
- ALGEBRAIC EXPRESSION BOOK - RS AGGARWALCHAPTER - ALGEBRAIC EXPRESSION EXERCISE - EXERCISE 6D
31 Videos
- COLLECTION AND ORGANISATION OF DATA (MEAN, MEDIAN AND MODE)BOOK - RS AGGARWALCHAPTER - COLLECTION AND ORGANISATION OF DATA (MEAN, MEDIAN AND MODE)EXERCISE - EXERCISE 21C
5 Videos
Similar Questions
Knowledge Check
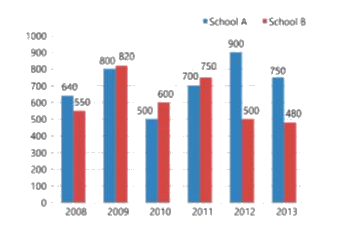
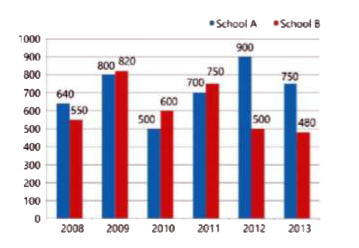
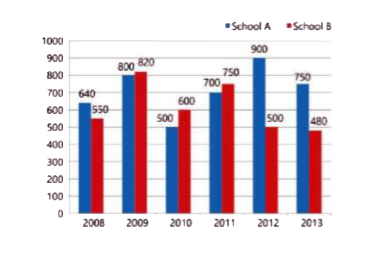
The given bar graph shows the number of students of two schools over a period of six years.

In the bar graph, what is the ratio of the average of the total students from school A to the average of the total students from school B ?A429:799B370:429C429:370D799:429
The following table shows the interest of students of a school in different games :

Represent the data by using a simple bar diagram.
View SolutionThe given bar graph shows the number of students of two schools over a period of six years.

In the bar graph, in which year is the absolme difference of the students from schools A to B taken together, the maximum?
View SolutionThe given bar graph shows the number of students of two schools over a period of six years.

In the bar graph, what is the ratio of the average of total students from school B to the average of total students from school A?
View SolutionThe strength of a school form 2014 to 2018 are given below :

View SolutionThe following data shows the number of students who attended the school on weekdays. Draw a bar graph to represent information by using appropriate scale.

View SolutionThe table below shows the yield of jowar per acre.Show the data by hiostogram

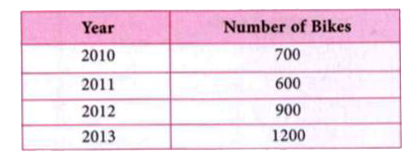
View SolutionDraw a bar graph using the data given in the following table, which shows the number of bikes manufactured in a factory during the years 2010 to 2013.

View Solution
