The following data shows India's total population (in millions) from 1961 to 2011. Year

Draw the bar graph of given data
Step by step video & image solution for The following data shows India's total population (in millions) from 1961 to 2011. Year Draw the bar graph of given data by Maths experts to help you in doubts & scoring excellent marks in Class 7 exams.
Updated on:21/07/2023Topper's Solved these Questions
- BAR GRAPHSBOOK - RS AGGARWALCHAPTER - BAR GRAPHSEXERCISE - EXERCISE 22
22 Videos
- ALGEBRAIC EXPRESSION BOOK - RS AGGARWALCHAPTER - ALGEBRAIC EXPRESSION EXERCISE - EXERCISE 6D
31 Videos
- COLLECTION AND ORGANISATION OF DATA (MEAN, MEDIAN AND MODE)BOOK - RS AGGARWALCHAPTER - COLLECTION AND ORGANISATION OF DATA (MEAN, MEDIAN AND MODE)EXERCISE - EXERCISE 21C
5 Videos
Similar Questions
Knowledge Check
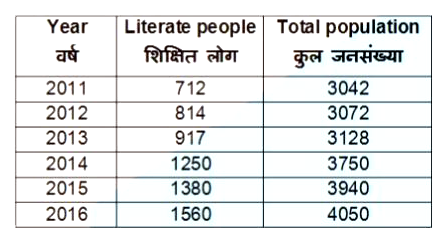
The table given below shows number of literate people and total population in a village from the year 2011 to 2016.

What is the average number of literate people from 2011 to 2016?A(a) 1370.6B(b) 980.5C(c) 1070.5D(d) 1105.5The table given below shows number of literate people and total population in a village from the year 2011 to 2016 .

What is the average number of literate people from 2011 to 2016?A1370.6B980.5C1070.5D1105.5The table given below shows number of literate people and total population in a village from the year 2011 to 2016.

What is the percentage of people who are literate in 2012?A26.49B27.92C29.14D22.74
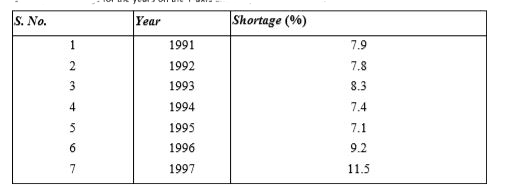
The following Table shows the total power shortage in India from 1991 - 1997. Show the data in the form of a graph. Plot shortage percentage for the years on the Y-axis and the year on the X-axis

View SolutionThe following table gives the average temperatures, during the year 2006 and 2007. Draw a double bar graph for the given data.

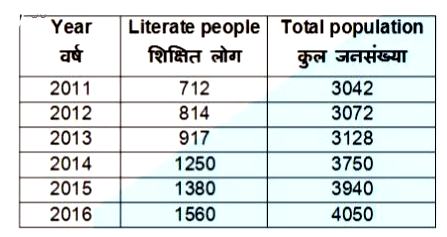
View SolutionThe table given below shows number of literate people and total population in a village from the year 2011 to 2016.

What is the percentage increase in the literate people in the year 2015 in comparison to year 2014?
View SolutionThe table given below shows number of literate people and total population in a village from the year 2011 to 2016 .

What is the percentage increase in the literate people in the year 2015 in comparison to year 2014?
View SolutionThe table given below shows number of literate people and total population in a village from the year 2011 to 2016.

What is the percentage of people who are literate in 2012?
View Solution

