Gold prices on 4 consecutive Tuesdays were as under
Draw a bar graph to show this information

Step by step video & image solution for Gold prices on 4 consecutive Tuesdays were as underDraw a bar graph to show this information by Maths experts to help you in doubts & scoring excellent marks in Class 7 exams.
Updated on:21/07/2023Topper's Solved these Questions
- BAR GRAPHSBOOK - RS AGGARWALCHAPTER - BAR GRAPHSEXERCISE - EXERCISE 22
22 Videos
- ALGEBRAIC EXPRESSION BOOK - RS AGGARWALCHAPTER - ALGEBRAIC EXPRESSION EXERCISE - EXERCISE 6D
31 Videos
- COLLECTION AND ORGANISATION OF DATA (MEAN, MEDIAN AND MODE)BOOK - RS AGGARWALCHAPTER - COLLECTION AND ORGANISATION OF DATA (MEAN, MEDIAN AND MODE)EXERCISE - EXERCISE 21C
5 Videos
Similar Questions
The number of Mathematics books sold by a shopkeeper on six consecutive days is shown below Draw a bar graph to represent the above information choosing the scale of your choice.
View SolutionThe number of Mathematics books sold by a shopkeeper on six consecutive days is shown below :
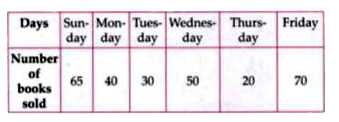
Draw a bar graph to represent the above information choosing the scale of your choice.
View SolutionThe following table shows the marks obtained by Sumit in the annual examination.

Draw a bar graph to show the above information.
View SolutionThe following data shows the number of students who attended the school on weekdays. Draw a bar graph to represent information by using appropriate scale.

View SolutionHome appliances sold by a shop in one month are given as below:
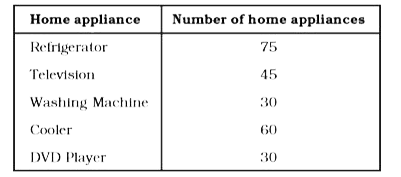
Draw a bar graph to represent the above information.
View SolutionNumber of mobile phone users in various age groups in a city is listed below:
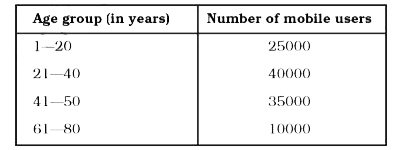
Draw a bar graph to represent the above information.
View SolutionThe given table shows the number of tourists who visited Taj Mahal during different months. Month

Draw a bar graph to represent the above information by using appropriate scale.
View SolutionGiven here is a bar graph showing the number of cycles produced in a factory during five consecutive weeks.
Observe the graph and answer the questions based on this graph.
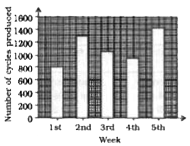
The number of cycles produced in the 5th week is
View SolutionThe following data shows the number of students born in different months of a particular year of class VI. Make the bar graph based on the given information.

View SolutionThe given bar graph shows the number of students of two schools over a period of six years.
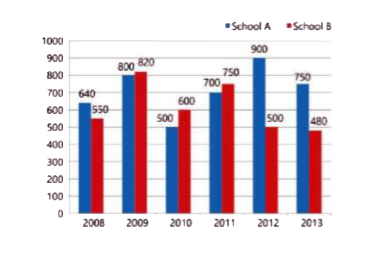
In the bar graph, what is the ratio of the average of total students from school B to the average of total students from school A?
View Solution
