The following table shows the interest paid by India (in thousand crore rupees) on external debts during the period 1998–99 to 2002-03. Represent the data by a bar graph

Step by step video & image solution for The following table shows the interest paid by India (in thousand crore rupees) on external debts during the period 1998–99 to 2002-03. Represent the data by a bar graph by Maths experts to help you in doubts & scoring excellent marks in Class 7 exams.
Updated on:21/07/2023Topper's Solved these Questions
- BAR GRAPHSBOOK - RS AGGARWALCHAPTER - BAR GRAPHSEXERCISE - EXERCISE 22
22 Videos
- ALGEBRAIC EXPRESSION BOOK - RS AGGARWALCHAPTER - ALGEBRAIC EXPRESSION EXERCISE - EXERCISE 6D
31 Videos
- COLLECTION AND ORGANISATION OF DATA (MEAN, MEDIAN AND MODE)BOOK - RS AGGARWALCHAPTER - COLLECTION AND ORGANISATION OF DATA (MEAN, MEDIAN AND MODE)EXERCISE - EXERCISE 21C
5 Videos
Similar Questions
Following table shows the number of bicycles manufactured in a factory during the years 1998 to 2002. Illustrate this data using a bar graph. Choose a scale of your choice
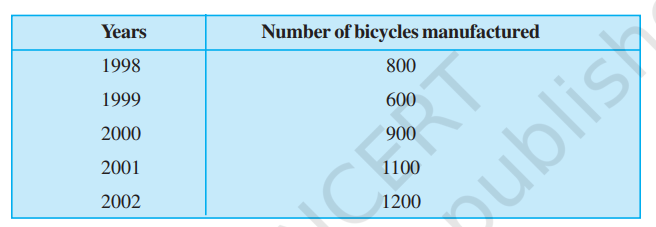
View SolutionFollowing table shows the number of bicycles manufactured in a factory during the years 1998 to 2002. Illustrate this data using a bar graph. Choose a scale of your choice.
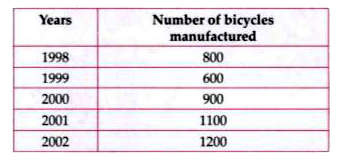
In which year were the maximum number of bicycles manufactured ?
View SolutionFollowing table shows the number of bicycles manufactured in a factory during the years 1998 to 2002. Illustrate this data using a bar graph. Choose a scale of your choice.
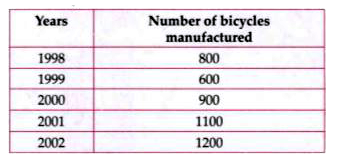
In which year were the minimum number of bicycles manufactured ?
View SolutionThe following table shows the number of fruits in a fruit shop. Represent the above data by a bar graph
View SolutionThe following table shows the estimated sectoral real growth rates (percentage change over the previous year) in GDP at factor cost.
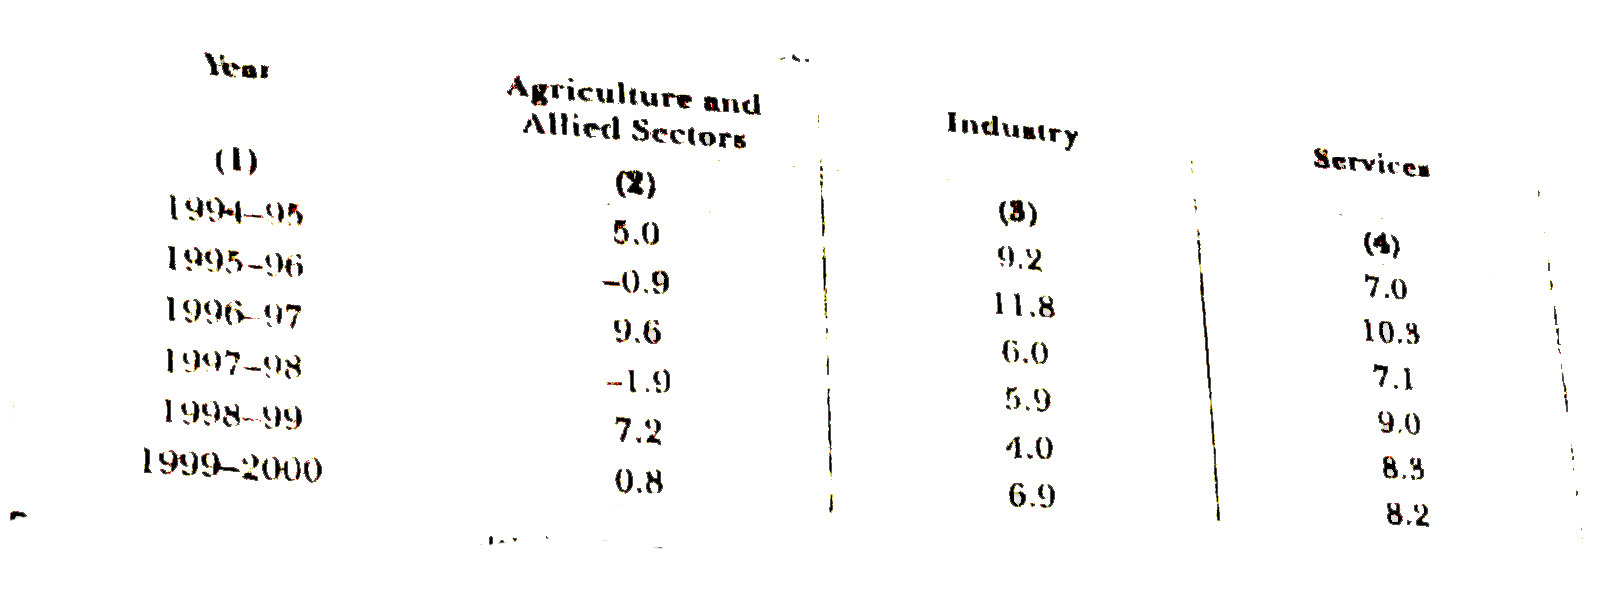
Represent the data as multiple time series graph.
View SolutionThe following table shows the interest of students of a school in different games :

Represent the data by using a simple bar diagram.
View Solution. The following data shows the year wise strength of a school.Represent the the above data by bar graph:
View SolutionThe following table shows birth and death rate in India according to the Census Reports between 1931 - 40 to 2016-17 (hypothetical figures). Present the data in te form of a multiple bar diagram.

View SolutionThe following data on the number of girls (to the nearest ten) per thousand boys in different sections of Indian society is given below
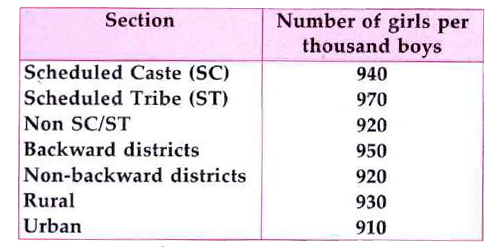
Represent the information above by a bar graph.
View SolutionThe following table shows the average intake of nutrients in calories by rural and urban groups in a particular year. Using a suitable scale for the given data, draw a double bar graph to compare the data.
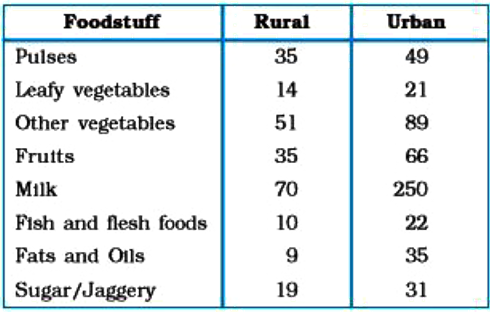
View Solution
