The following table shows the life expectancy (average age to which people live) in various countries in a particular year. Represent this data by a bar grap

Step by step video & image solution for The following table shows the life expectancy (average age to which people live) in various countries in a particular year. Represent this data by a bar grap by Maths experts to help you in doubts & scoring excellent marks in Class 7 exams.
Updated on:21/07/2023Topper's Solved these Questions
- BAR GRAPHSBOOK - RS AGGARWALCHAPTER - BAR GRAPHSEXERCISE - EXERCISE 22
22 Videos
- ALGEBRAIC EXPRESSION BOOK - RS AGGARWALCHAPTER - ALGEBRAIC EXPRESSION EXERCISE - EXERCISE 6D
31 Videos
- COLLECTION AND ORGANISATION OF DATA (MEAN, MEDIAN AND MODE)BOOK - RS AGGARWALCHAPTER - COLLECTION AND ORGANISATION OF DATA (MEAN, MEDIAN AND MODE)EXERCISE - EXERCISE 21C
5 Videos
Similar Questions
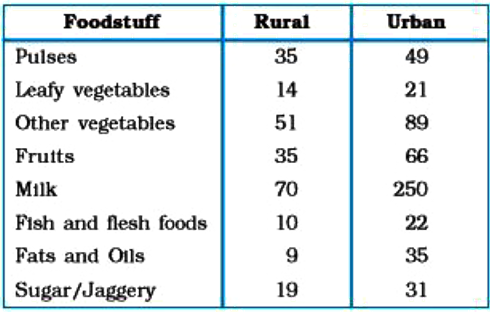
The following table shows the average intake of nutrients in calories by rural and urban groups in a particular year. Using a suitable scale for the given data, draw a double bar graph to compare the data.

View SolutionThe following data shows the average age of men in varicus countries in a certain year: Country, India, Nepal, China, Pakistan, U.K., U.S.A Average age (in years), 55, 52, 60, 50, 70, 75 Represent the above information by a bar graph.
View SolutionThe following table shows the number of fruits in a fruit shop. Represent the above data by a bar graph
View SolutionThe following table shows the number of illitrate persons in the age group (10-58 Years) in a town. Represents the given data by means of a histogram.

View SolutionFollowing data gives total marks (out of 600) obtained by six children ofa particular class. Represent the data on a bar graph.
View SolutionThe following table shows the percentage of people having different blood groups. Draw a pie chart to represent the given data.
Blood groupABCDPercentage of people20452015
View SolutionThe following table shows the monthly expenditure of different families on different items :

Represent the data in the form of a sub-divided bar diagram.
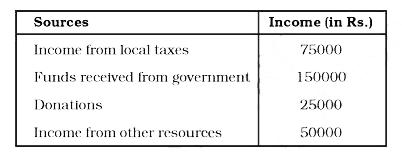
View SolutionThe following table represents income of a Gram Panchayat from different sources in a particular year:

Draw a bar graph to represent the above information
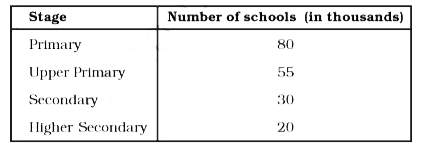
View SolutionThe following table gives the data of number of schools (stage-wise) of a country in the year 2002.

Draw a bar graph to represent the above data:
View SolutionThe following table shows ages of 200 patients (in years) and the number of patients getting medical tretment on a particular day in a hospital in a day.

Find the median age of a patient.
View Solution
