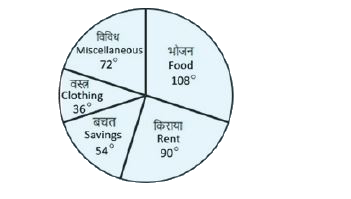
The given pie chart shows percentage, distribution of various expense of a family in a given month.
Study the graph carefully and answer the following questions.
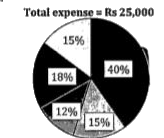
If monthly saving of the family is 30% of the monthly income, then find the ratio of the expense on the Clothes to Savings of the family.
320
720
1120
920
The correct Answer is:B
Topper's Solved these Questions
- DATA INTERPRETATIONBOOK - ADDA247CHAPTER - DATA INTERPRETATIONEXERCISE - Prelims Questions (Level-1)
54 Videos
- DATA INTERPRETATIONBOOK - ADDA247CHAPTER - DATA INTERPRETATIONEXERCISE - Prelims Questions (Level-2)
59 Videos
- DATA INTERPRETATIONBOOK - ADDA247CHAPTER - DATA INTERPRETATIONEXERCISE - Previous Year Questions
56 Videos
- BOAT AND STREAM BOOK - ADDA247CHAPTER - BOAT AND STREAM EXERCISE - Previous Year Question
22 Videos
- DATA SUFFICIENCY BOOK - ADDA247CHAPTER - DATA SUFFICIENCY EXERCISE - PREVIOUS YEAR QUESTIONS
25 Videos
Similar Questions
The pie chart given below shows the expenditure on various items and savings of a family during the year 2009. Study the pie chart and answer these questions.
 The percentage of the income which was spent on clothing, education of children and transport together is-
View SolutionThe pie chart, given here shows monthly expenses on various heads and savings of the family of Mr. Rao. Study the chart and answer the questions based on it.
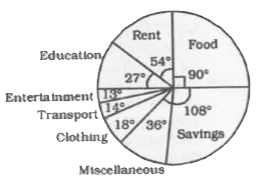
If the total income of Mr. Rao is Rs. 72000, how much house rent does he pay?
View Solution
Knowledge Check
The pie chart given below shows the spending of a family on various heads during a month. Study the graph and answer the following questions.
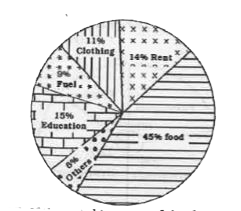
If the total income of the family is Rs 25,000, then the amount spent on Rent and Food together isARs 17,250BRs 14,750CRs 11,250DRs 8,500The pie chart given below shows the spending of a family on various heads during a month. Study the graph and answer the following questions.
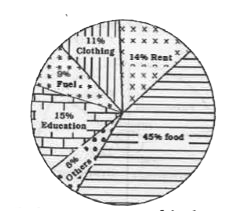
What is the ratio of the expenses on Education to the expenses on Food?A1:3B3:1C3:5D5:3The pie chart given below shows the spendings of a family on various heads during a month. Study the graph and answer the questions
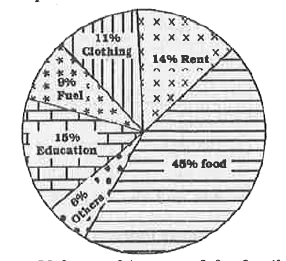
If the total income of the family is Rs . 25,000, then the amount spent on Rent and Food together isARs. 17,250BRs. 14,750CRs. 11,250DRs. 8,500
The bar graph given below shows the spending of a family income on various items and savings during 1993. Observe the graph and answer the following questions :
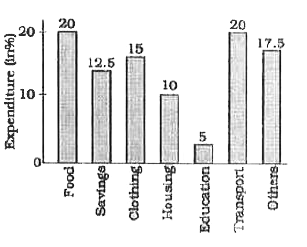
The savings of the family is more than that of expenditure incurred on:
View SolutionThe pie chart given below shows the spendings of a family on various heads during a month. Study the graph and answer the questions
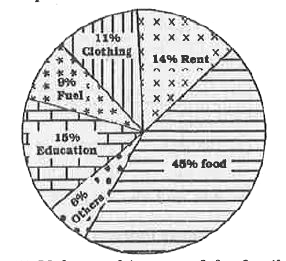
What is the ratio of the expenses on Education to the expenses on Food?
View SolutionThe Expenditure of a family in a month is represented by a Pie-chart. Read it carefully to answer the questions.
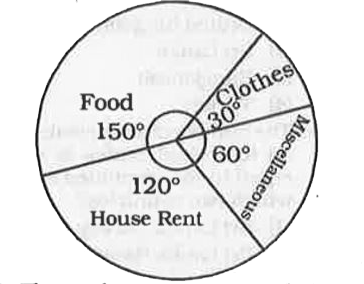
The ratio of the amount spent on food and clothes is
View SolutionThe following pie-chart shows the monthly expenditure of a family on various items. If the family spends Rs. 825 on clothing, answer the question
What is the total monthly income of the family?
View SolutionThe following pie-chart shows the monthly expenditure of a family on various items. If the family spends Rs. 825 on clothing, answer the question
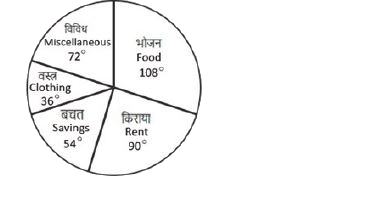
What percent of the total income does the family save ?
View Solution
