The given pie chart shows percentage, distribution of various expense of a family in a given month.
Study the graph carefully and answer the following questions.
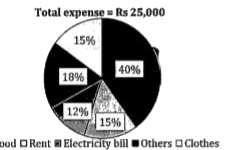
If expense on Food is 1254% of monthly family income, then find the total monthly income of family.
Rs 28000
Rs 42000
Rs 35000
Rs 32000
The correct Answer is:D
Topper's Solved these Questions
- DATA INTERPRETATIONBOOK - ADDA247CHAPTER - DATA INTERPRETATIONEXERCISE - Prelims Questions (Level-1)
54 Videos
- DATA INTERPRETATIONBOOK - ADDA247CHAPTER - DATA INTERPRETATIONEXERCISE - Prelims Questions (Level-2)
59 Videos
- DATA INTERPRETATIONBOOK - ADDA247CHAPTER - DATA INTERPRETATIONEXERCISE - Previous Year Questions
56 Videos
- BOAT AND STREAM BOOK - ADDA247CHAPTER - BOAT AND STREAM EXERCISE - Previous Year Question
22 Videos
- DATA SUFFICIENCY BOOK - ADDA247CHAPTER - DATA SUFFICIENCY EXERCISE - PREVIOUS YEAR QUESTIONS
25 Videos
Similar Questions
The following pie-chart shows the monthly expenditure of a man on various items. If he spends Rs. 16,000 per month, answer the following questions.
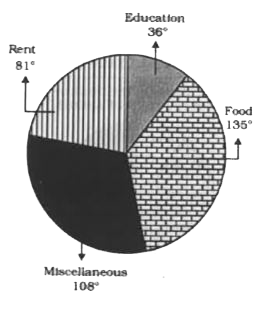
The ratio of expenses on food and rent is :
View SolutionThe following diagram show the expenditure of a family on various Items A ,B,C, D and E .
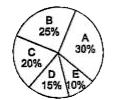
Study the diagram carefully and answer the following questions .
If the income of the family is Rs 3000 per month then expenditure on item C will be
View Solution
Knowledge Check
The pie chart given below shows the spending of a family on various heads during a month. Study the graph and answer the following questions.
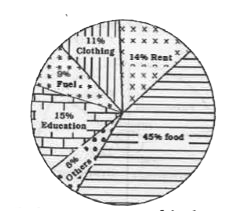
What is the ratio of the expenses on Education to the expenses on Food?A1:3B3:1C3:5D5:3The pie chart given below shows the spending of a family on various heads during a month. Study the graph and answer the following questions.
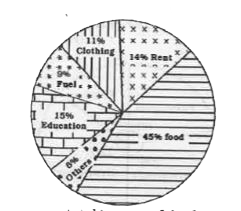
Expenditure on Rent is what percent of expenditure on Fuel?A135%B156%C167%D172%The pie chart given below shows the spending of a family on various heads during a month. Study the graph and answer the following questions.
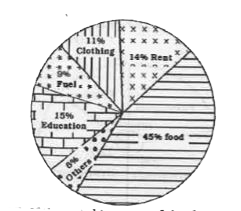
If the total income of the family is Rs 25,000, then the amount spent on Rent and Food together isARs 17,250BRs 14,750CRs 11,250DRs 8,500
The pie chart given below shows the spendings of a family on various heads during a month. Study the graph and answer the questions
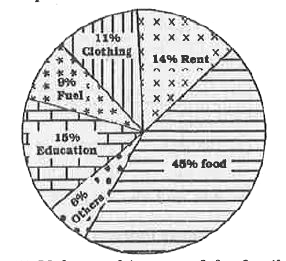
What is the ratio of the expenses on Education to the expenses on Food?
View SolutionThe following diagram show the expenditure of a family on various Items A ,B,C, D and E .

Study the diagram carefully and answer the following questions .
If the income of the family is Rs 3000 per month then expenditure on item C will be
View SolutionThe pie chart given below shows the spending of a family on various heads during a month. Study the graph and answer the following questions.
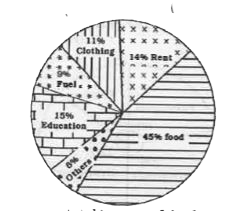
Which three expenditures together have a central angle of 108∘?
View SolutionThe bar graph given below shows the spending of a family income on various items and savings during 1993. Observe the graph and answer the following questions :
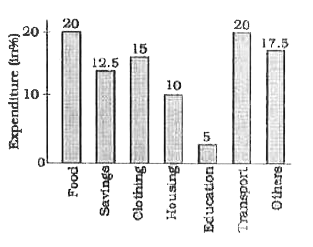
The percent of income spent on food is :
View SolutionThe pie chart given below shows the spendings of a family on various heads during a month. Study the graph and answer the questions
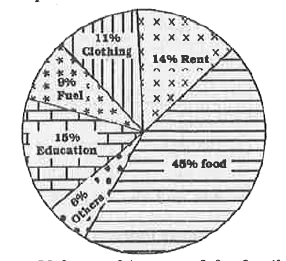
If the total income of the family is Rs . 25,000, then the amount spent on Rent and Food together is
View Solution
