Study the double bar graph shown below and answer the questions that follow:
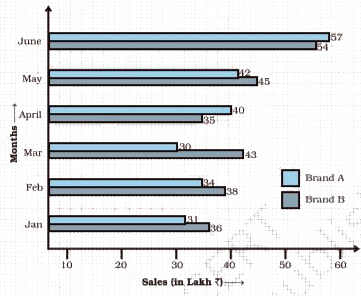
(a) What information is represented by the above double bar graph?
(b) In which month sales of Brand A decreased as compared to the previous month?
(c) What is the difference in sales of both the Brands for the month of June?
(d) Find the average sales of Brand B for the six months.
(e) List all months for which the sales of Brand B was less than that of Brand A.
(f) Find the ratio of sales of Brand A as compared to Brand B for the month of January.
Step by step video & image solution for Study the double bar graph shown below and answer the questions that follow: (a) What information is represented by the above double bar graph? (b) In which month sales of Brand A decreased as compared to the previous month? (c) What is the difference in sales of both the Brands for the month of June? (d) Find the average sales of Brand B for the six months. (e) List all months for which the sales of Brand B was less than that of Brand A. (f) Find the ratio of sales of Brand A as compared to Brand B for the month of January. by Maths experts to help you in doubts & scoring excellent marks in Class 7 exams.
Topper's Solved these Questions
- BOOK - NCERT EXEMPLARCHAPTER - DATA HANDLINGEXERCISE - THINK AND DISCUSS3videos
DATA HANDLING
- BOOK - NCERT EXEMPLARCHAPTER - DATA HANDLINGEXERCISE - EXERCISE(TRUE OR FALSE)18videos
DATA HANDLING
- BOOK - NCERT EXEMPLARCHAPTER - COMPARING QUANTITIESEXERCISE - THINK AND DISCUSS24videos
COMPARING QUANTITIES
- BOOK - NCERT EXEMPLARCHAPTER - EXPONENTS AND POWERSEXERCISE - EXERCISE136videos
EXPONENTS AND POWERS
Similar Questions
Read the following bar graph shown in Figure and answer the following questions: What is the information given by the bar graph? In which month was the sale of the book maximum? In which month was the sale of the book minimum? What is the total sale of the book during these five months?
View SolutionStudy the double bar graph given below and answer the questions that follow:
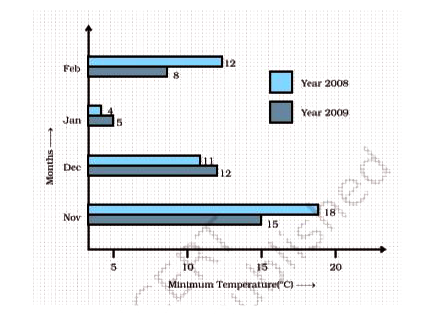
(a) What information is compared in the above given double bar graph?
(b) Calculate the ratio of minimum temperatures in the year 2008 to the year 2009 for the month of November.
(c) For how many months was the minimum temperature in the year 2008 greater than that of year 2009? Name those months.
(d) Find the average minimum temperature for the year 2008 for the four months.
(e) In which month is the variation in the two temperatures maximum?View Solution
Knowledge Check
- Question 1 - Select One
Study the following graph carefully and answer the question given below-----
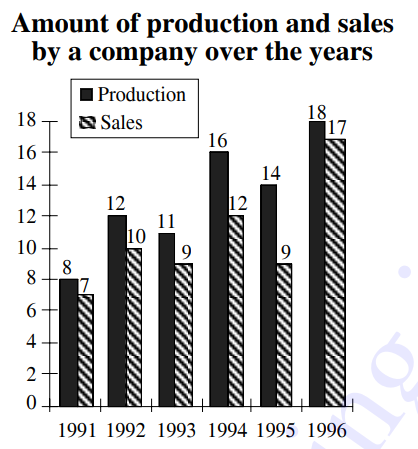
What was the difference between the sales of 1992 and 1995 ?A10 lakh tonnesB50 thousand tonnesC1 lakh tonnesD75 thousand tonnes - Question 2 - Select One
The line chart given blow represents the sales (in 00) of trousers ans shirts for five months.
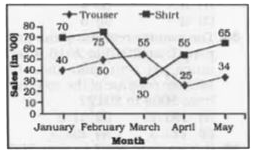
What is the difference between sales of shirts for months January and April?A2700B1500C2000D2200 - Question 3 - Select One
Study the graph and answer the questions.
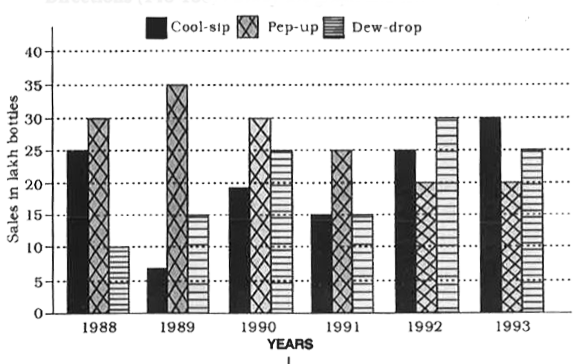
What was the approximater percent drop in the sale of Prep-up in 1990 over its sale in 1989 ?A5B14C12D20
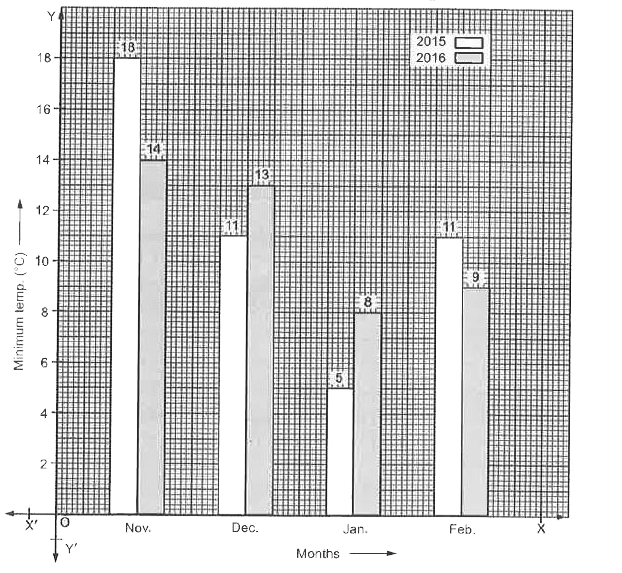
Study the double bar graph given below and answer the questions that follow
Q(i) What has been compared in the given double bar graph
(ii) What is the ratio of minimum temperatures in the year 2015 to the year 2016 in the month of November
(iii) Name the months in which the minimum temperature in 2015 was greater than that in 2016
(iv) Find the average minimum temperature for the year 2016 for the given four months
(v) In which month is the variation in two temperatures maximum
 View Solution
The graph given below gives the actual and expected sales of cars of a company for 6 months. Study the graph and answer the questions that follow.
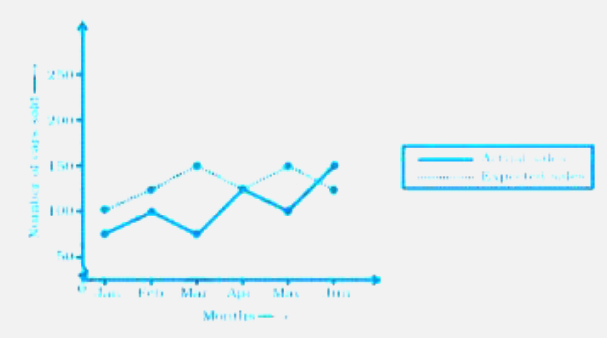
(a) In which month was the actual sales same as the expected sales?
(b) For which month(s) was (were) the difference in actual and expected sales the maximum?
(c) For which month(s) was (were) the difference in actual and expected sales the least?
(d) What was the total sales of cars in the months–Jan, Feb. and March?
(e) What is the average sales of cars in the last three months?
(f) Find the ratio of sales in the first three months to the last three months.View SolutionThe line chart given below represents the sales (in 00) of trousers and shirts for five months .
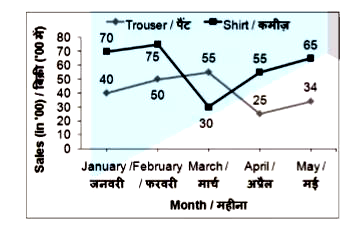
What is the difference between sales of shirts for months January and March?View SolutionStudy the graph and answer the questions.

What was the approximater percent drop in the sale of Prep-up in 1990 over its sale in 1989 ?View SolutionStudy the graph and answer the questions.
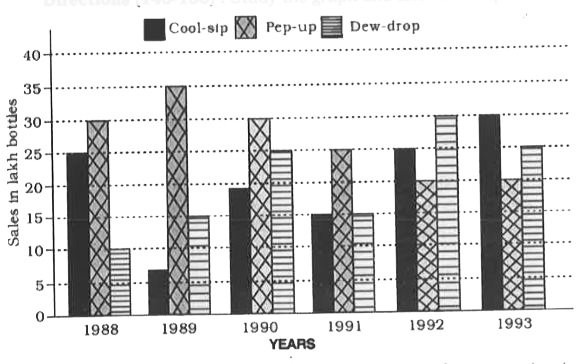
What was the approximate percent increase in sales of Cool - sip in 1990 over its sales in 1989 ? iView Solution

