The data given below shows the average rainfall in Udaipur from June to November of a certain year. Draw a bar graph to represent this information

Step by step video & image solution for The data given below shows the average rainfall in Udaipur from June to November of a certain year. Draw a bar graph to represent this information by Maths experts to help you in doubts & scoring excellent marks in Class 7 exams.
Updated on:21/07/2023Topper's Solved these Questions
- BAR GRAPHSBOOK - RS AGGARWALCHAPTER - BAR GRAPHSEXERCISE - EXERCISE 22
22 Videos
- ALGEBRAIC EXPRESSION BOOK - RS AGGARWALCHAPTER - ALGEBRAIC EXPRESSION EXERCISE - EXERCISE 6D
31 Videos
- COLLECTION AND ORGANISATION OF DATA (MEAN, MEDIAN AND MODE)BOOK - RS AGGARWALCHAPTER - COLLECTION AND ORGANISATION OF DATA (MEAN, MEDIAN AND MODE)EXERCISE - EXERCISE 21C
5 Videos
Similar Questions
Draw a pictograph to represent the data given below :

View SolutionThe approximate speeds of some objects are given below. Draw a bar graph to represent them:

View SolutionHome appliances sold by a shop in one month are given as below:
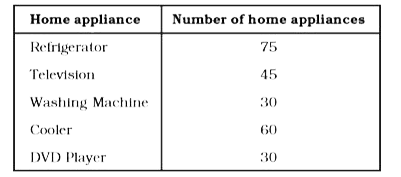
Draw a bar graph to represent the above information.
View SolutionThe given table shows the number of tourists who visited Taj Mahal during different months. Month

Draw a bar graph to represent the above information by using appropriate scale.
View SolutionThe following table represents income of a Gram Panchayat from different sources in a particular year:
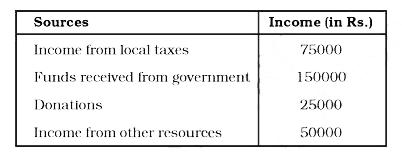
Draw a bar graph to represent the above information
View SolutionThe income of a family i different year are as follows. Draw a bar graph to represent the data
View SolutionThe lengths in km (rounded to nearest hundred) of some major rivers of India is given below:
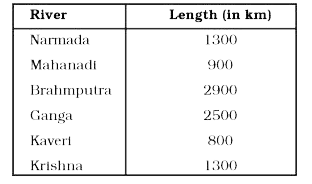
Draw a bar graph to represent the above information.
View SolutionThe following table gives the data of number of schools (stage-wise) of a country in the year 2002.
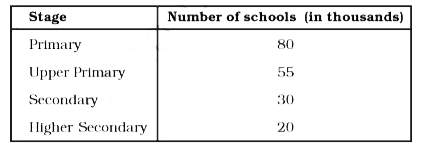
Draw a bar graph to represent the above data:
View SolutionNumber of mobile phone users in various age groups in a city is listed below:
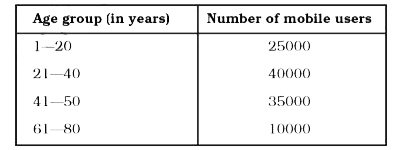
Draw a bar graph to represent the above information.
View SolutionThe following table shows the marks obtained by Sumit in the annual examination.

Draw a bar graph to show the above information.
View Solution
