The following table shows the imports (in thousand crore rupees) made by India over the last five years. Draw a bar graph to represent this data

Step by step video & image solution for The following table shows the imports (in thousand crore rupees) made by India over the last five years. Draw a bar graph to represent this data by Maths experts to help you in doubts & scoring excellent marks in Class 7 exams.
Updated on:21/07/2023Topper's Solved these Questions
- BAR GRAPHSBOOK - RS AGGARWALCHAPTER - BAR GRAPHSEXERCISE - EXERCISE 22
22 Videos
- ALGEBRAIC EXPRESSION BOOK - RS AGGARWALCHAPTER - ALGEBRAIC EXPRESSION EXERCISE - EXERCISE 6D
31 Videos
- COLLECTION AND ORGANISATION OF DATA (MEAN, MEDIAN AND MODE)BOOK - RS AGGARWALCHAPTER - COLLECTION AND ORGANISATION OF DATA (MEAN, MEDIAN AND MODE)EXERCISE - EXERCISE 21C
5 Videos
Similar Questions
The income of a family i different year are as follows. Draw a bar graph to represent the data
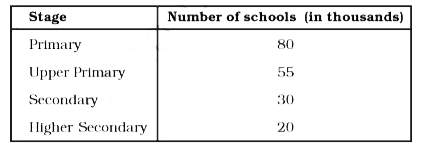
View SolutionThe following table gives the data of number of schools (stage-wise) of a country in the year 2002.

Draw a bar graph to represent the above data:
View SolutionThe following data shows the number of students who attended the school on weekdays. Draw a bar graph to represent information by using appropriate scale.

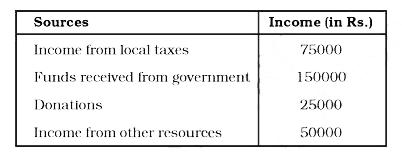
View SolutionThe following table represents income of a Gram Panchayat from different sources in a particular year:

Draw a bar graph to represent the above information
View SolutionThe following table shows the number of fruits in a fruit shop. Represent the above data by a bar graph
View SolutionThe following table shows the marks obtained by Sumit in the annual examination.

Draw a bar graph to show the above information.
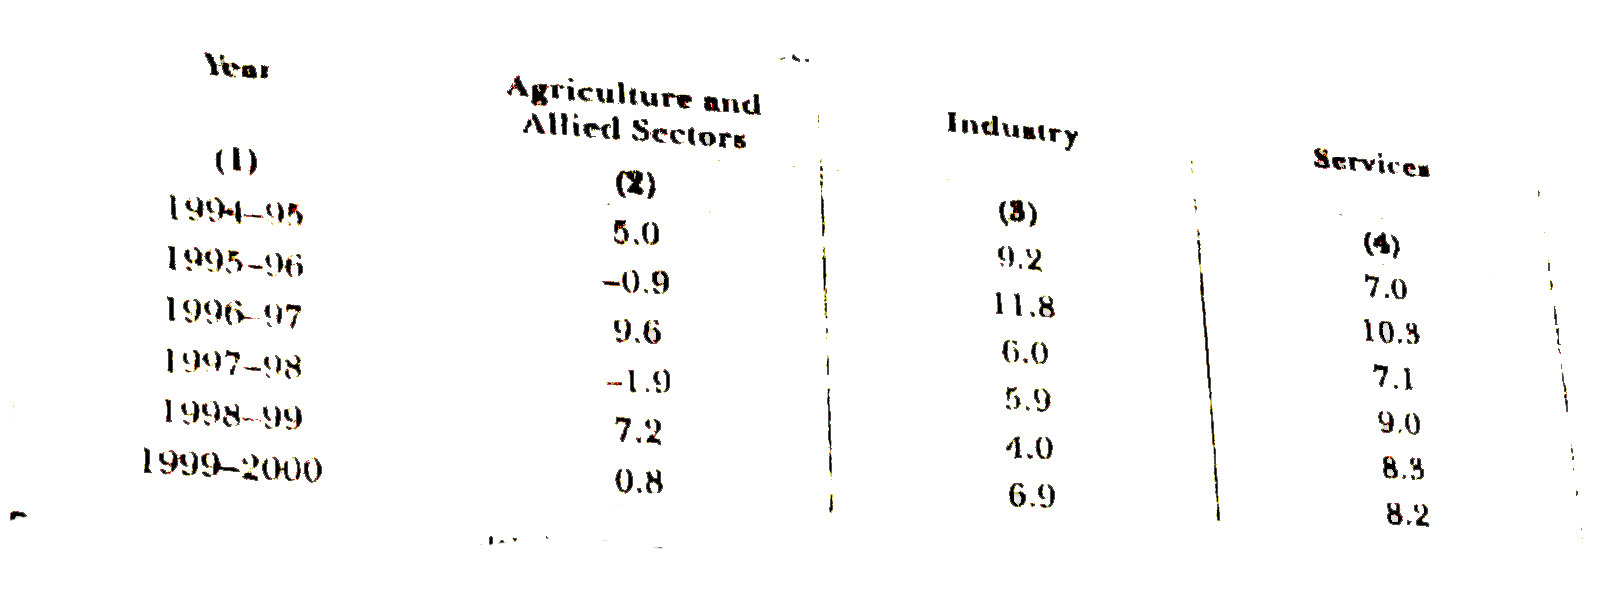
View SolutionThe following table shows the estimated sectoral real growth rates (percentage change over the previous year) in GDP at factor cost.

Represent the data as multiple time series graph.
View SolutionThe expenditure of a family of different heads in a month is given below

Draw a bar graph to represent the data above.
View SolutionThe following table gives the GDP in rupees (crore) by the three sectors

What conclusions can we draw from the bar graph?
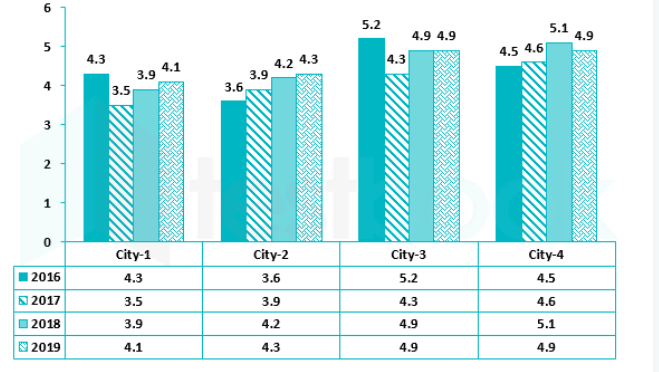
View SolutionThe following graph shows the sales of cars (in thousands) in four cities in 4 years. Study the graph and answer the question

In which year. the sales are highest?
View Solution
