Complete Solutions to Chemical Equilibrium of chapter GRAPHICAL INTERPRETATION of Class 12 book with complete answers and questions
| Class 12 | CHEMISTRY |
| Chapter | GRAPHICAL INTERPRETATION |
| GRB PUBLICATION | Chemical Equilibrium |
| Number Of Questions | 36 |
| Academic Year | 2023-24 |
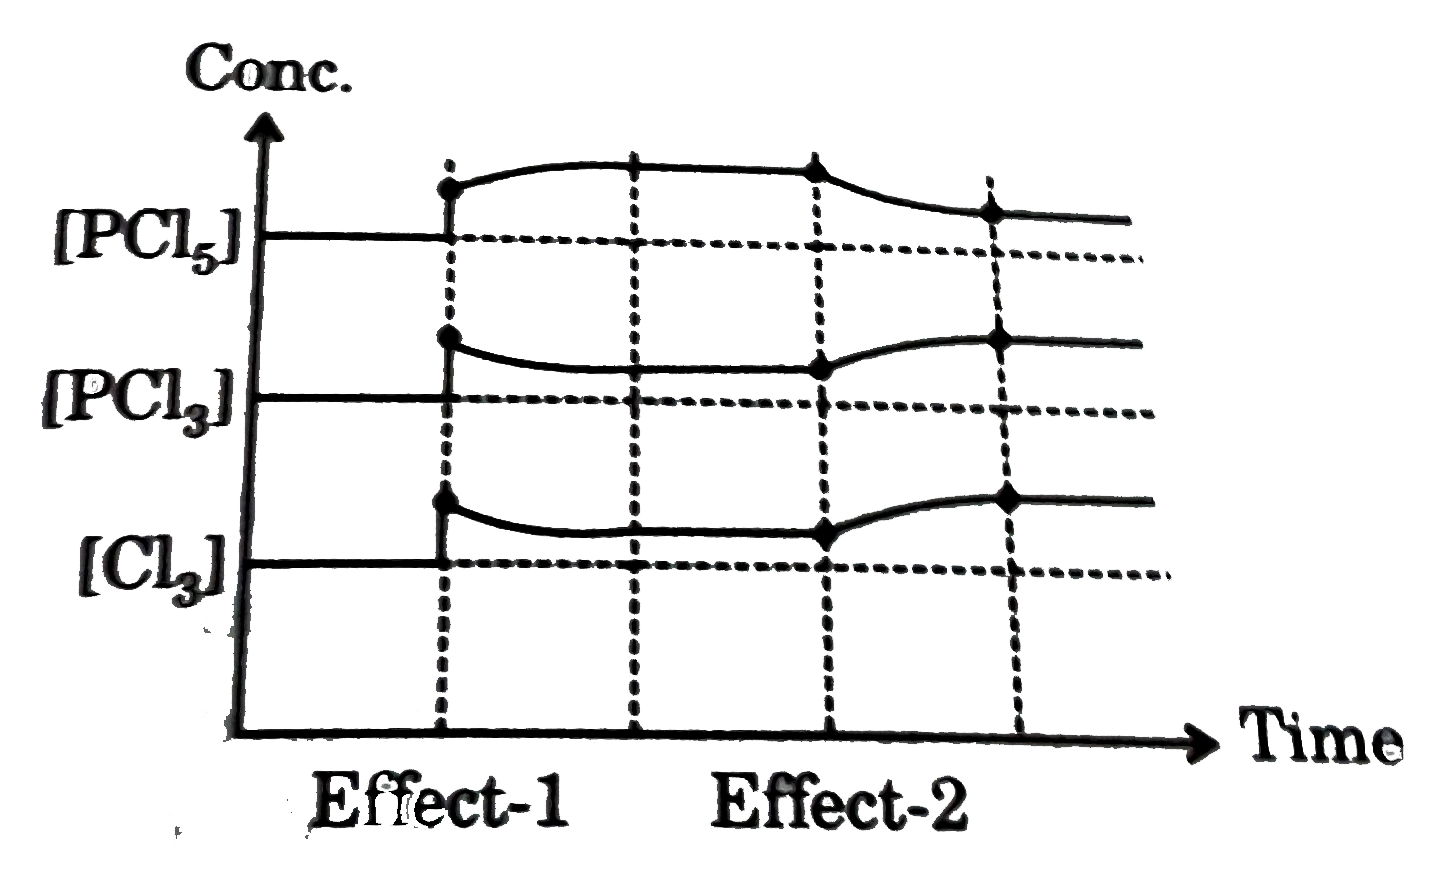
Consider given endothermic reaction at equilibrium, `PCI_(5)(g) hArr PCI_(3)(g)+CI_(2)(g)`. A graph is ploted between concentration and time as shown. Effect-1 and Effect-2 is due to respectively are :
View SolutionIn two different experiments, equilibrium `A(g) hArr B(g)` is established by initially taking reactant only. In first experiment, reaction is carried out in absence of catalyst and in second experiment reaction is carried out in presence of catalyst, then, which of the following curve of rate us time for forward and backward reaction hold true in these two experiments ?
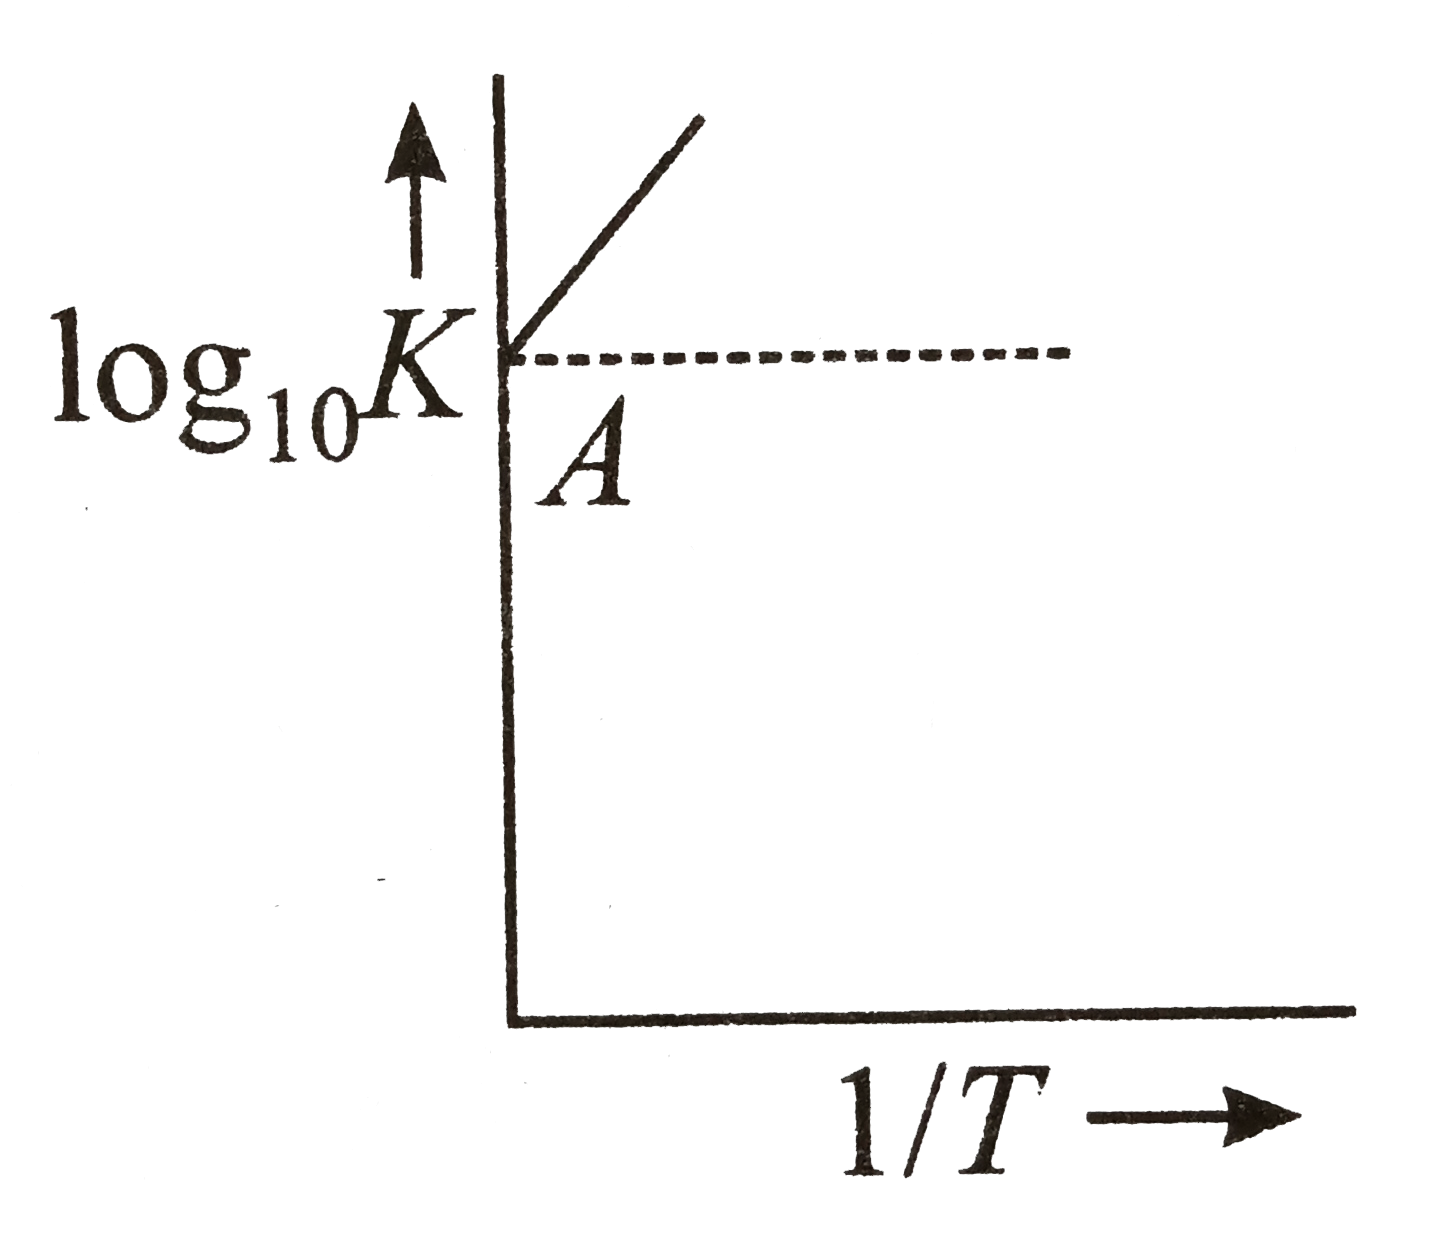
View SolutionVariation of `log_(10)K` with `(1)/(T)` is shown by the following graph in which straight line is at `45^(@)` , hence `Delta H^(@)` is:
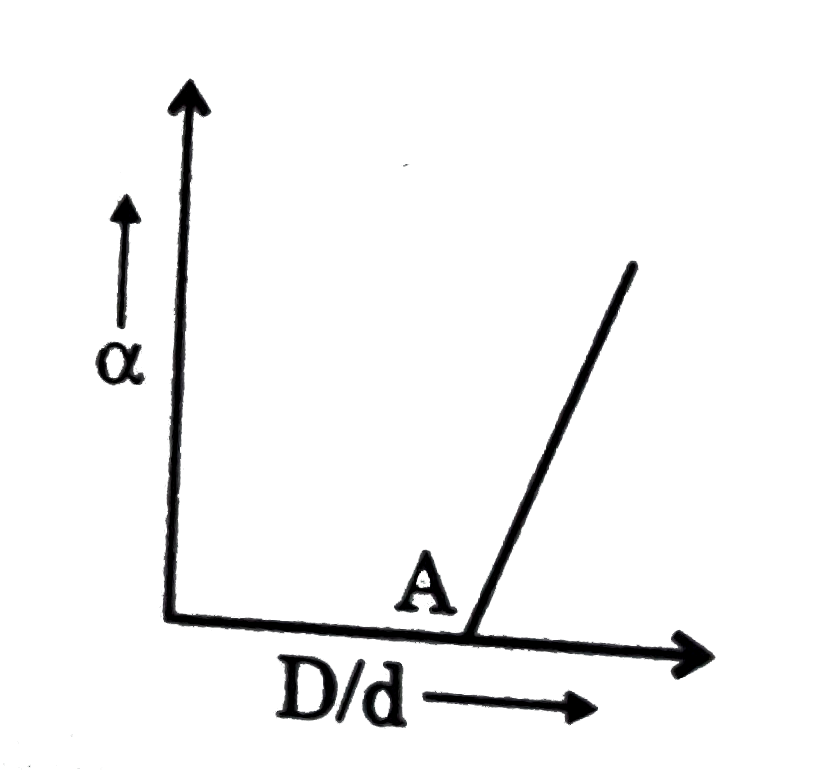
View SolutionBefore equilibrium is set-up the chemical reaction `N_(2)O_(4)(g) hArr 2NO_(2)(g)`, vapour density d of the gaseous mixture was measured. If D is the theoretica value of vapour density, variation of `alpha` with `D//d` is given by the graph below. What is value `D//d` at point A` ?
View SolutionIn the dissociation of `N_(2)O_(4)` into `NO_(2). (1+x)` values with the vapour densities ratio `((D)/(d))` is given by `:`
View SolutionIn the dissociation of `N_(2)O_(4)` into `NO_(2)O_(4)` into `NO_(2), alpha` varies with `((D)/(d))` according to: [`alpha` degree of dissociation, D-vapour density before dissociation, d-vapour density after dissociation]
View SolutionFor the chemical equilibrium,
`CaCO_(3)(s) hArr CaO(s)+CO_(2)(g)`
`Delta_(r)H^(ɵ)` can be determined from which one of the following plots?
View SolutionRate of reaction curve for equilibrium can be like: `[r_(f)=` forward rate, `r_(b) =` backward rate]
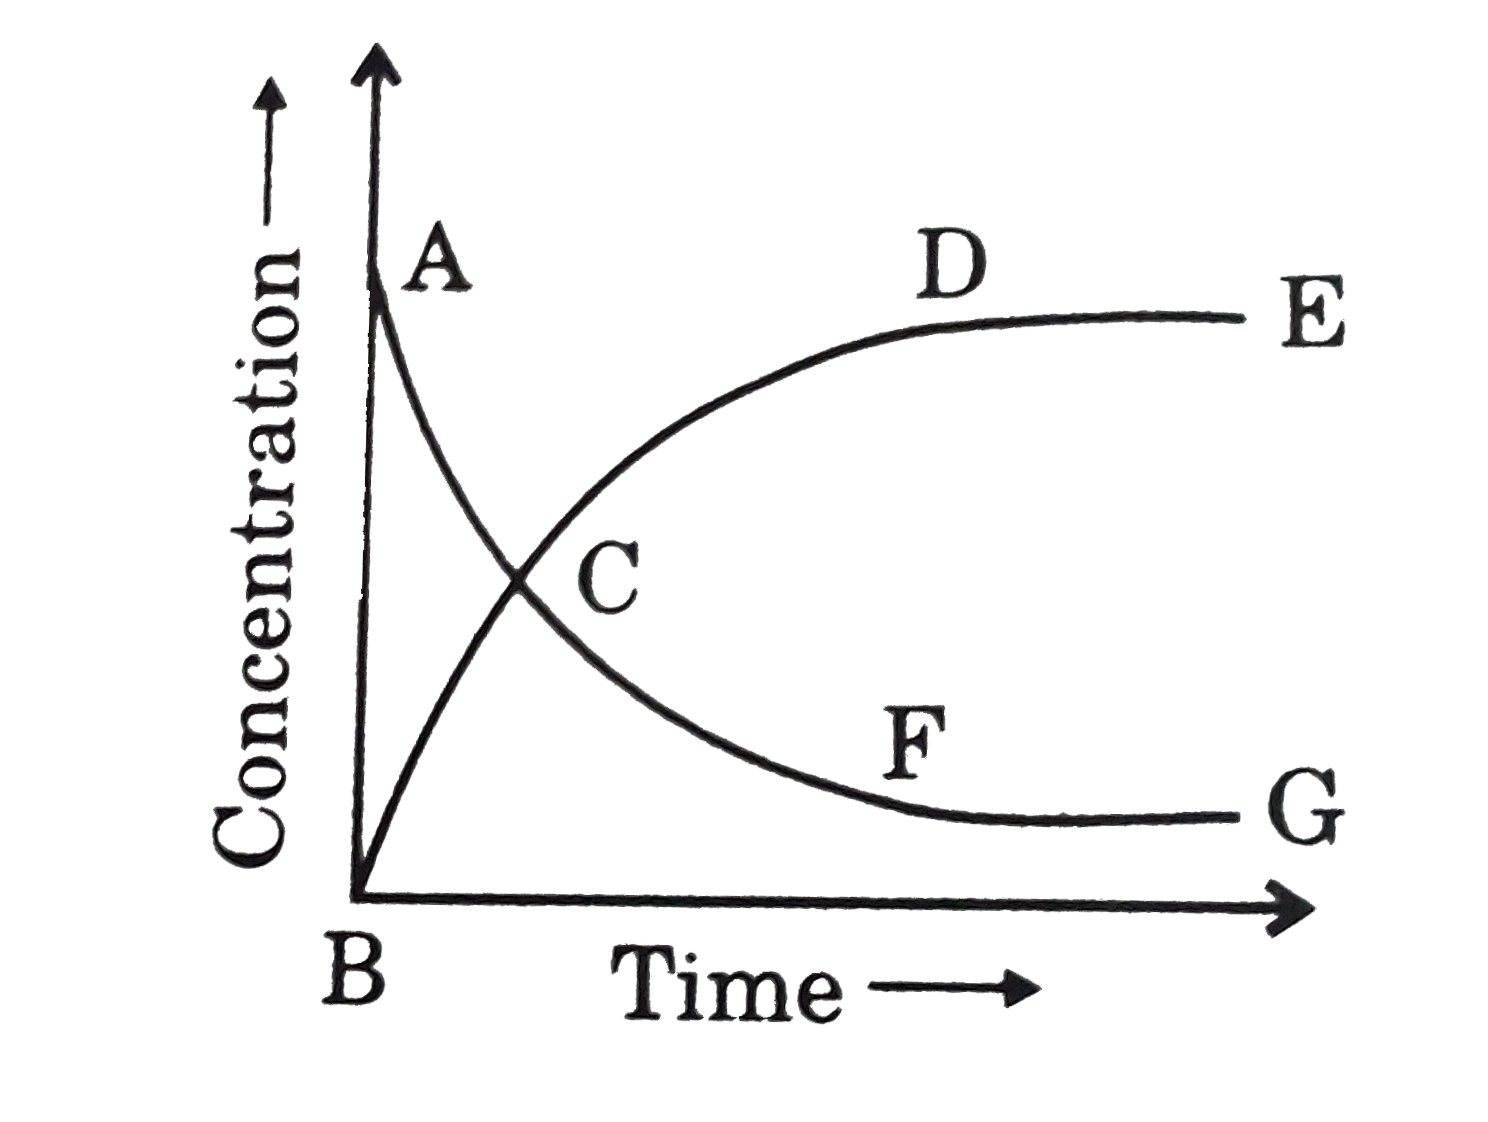
View Solution`N_(2)O_(4)(g) hArr 2NO_(2)(g), K_(c) = 4`. This reversible reaction is studied graphically as shown in figure. Select the correct statements out of P,Q and R.
(P) Reaction quotient has maximum value at point A
(Q) Reaction proceeds left to right at a point when `[N_(2)O_(4)] = [NO_(2)] = 0.1M`
(R) `K_(c) = Q` when point D or F is reached
View SolutionFor the equilibrium,
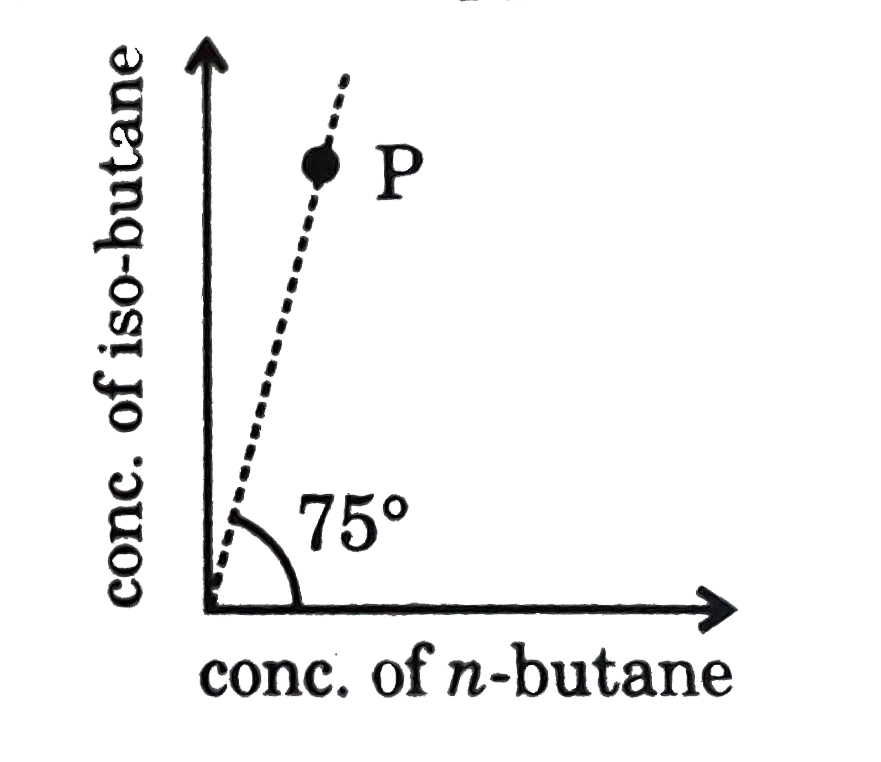
`CH_(3)-CH_(2)-CH_(2)-CH_(3)(g) hArr CH_(3)-overset(CH_(3))overset(|)underset(H)underset(|)(C)-CH_(3)(g)`
equilibrium constant is found to be `1.732` at 298 K. Now if in a vessel at 298K, a mixture of these two gases be taken as represented by the point P in the figure, predict what will happen:
View SolutionFor the given endothermic reaction, `A(g) hArr 2B(g)` The variation in concentration due to different changes is plotted. Neglect the slope of change in concentration. Changes are carried out very fast. Given the correct order of initials T (true) of F (false) for following statements.
(P) Effect-I is decrease in temperature at constant volume
(Q) Effect-II is decrease in total equilibrium pressure by changing volume.
(R) Effect-III is addition of B only at constant volume
View SolutionA particular reversible reaction shifts towards reactant side if temperature is increased. Which of the following is true for the reaction ?
View SolutionWhich plot involving vapour pressure (VP) and absolute temperature results in a straight line ?
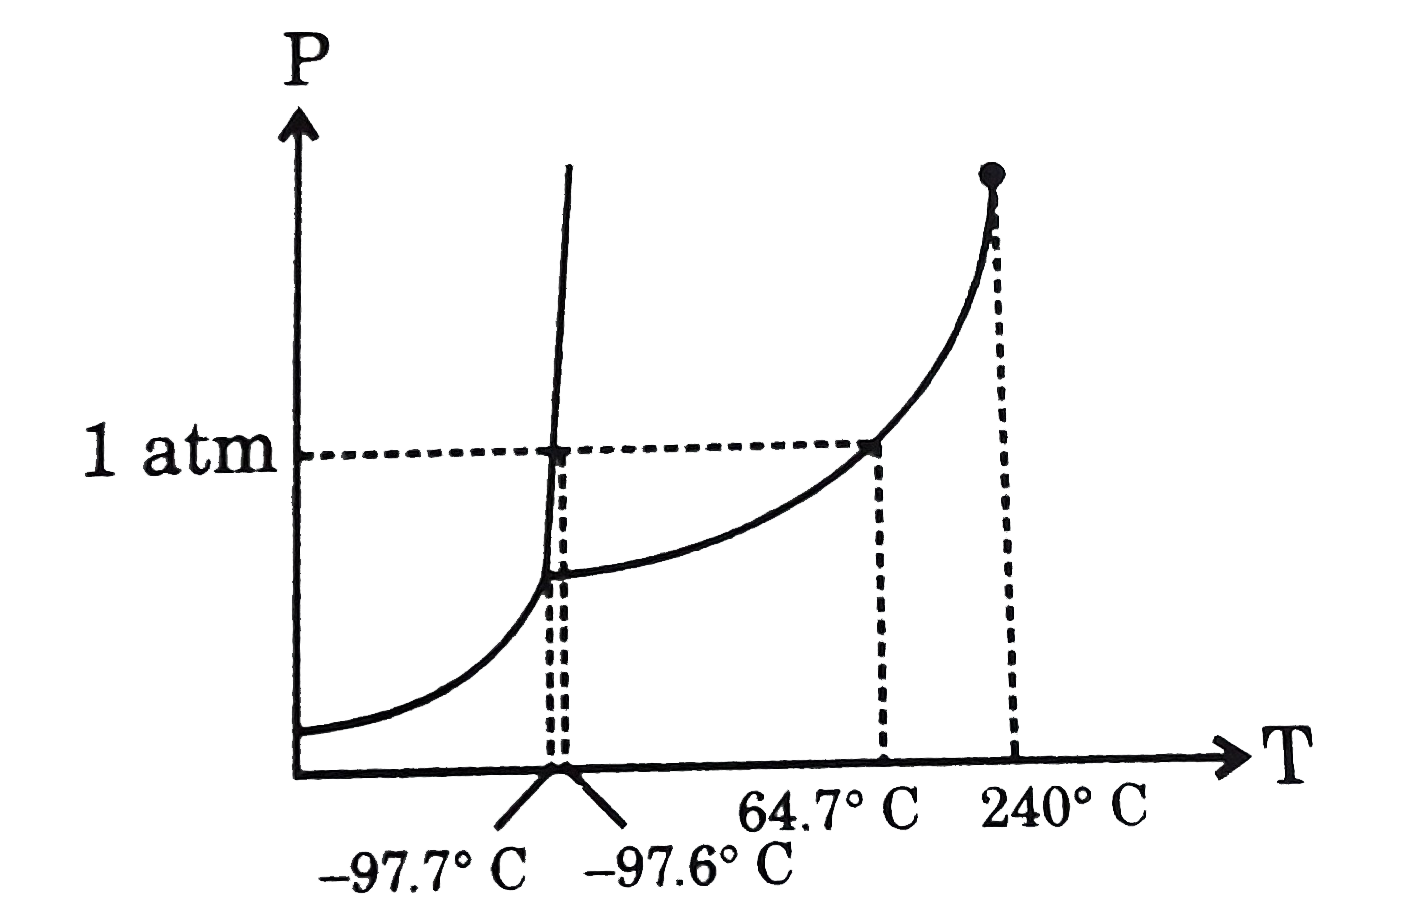
View SolutionAccording to the phase diagram of methanol shown below, which statement is correct ?
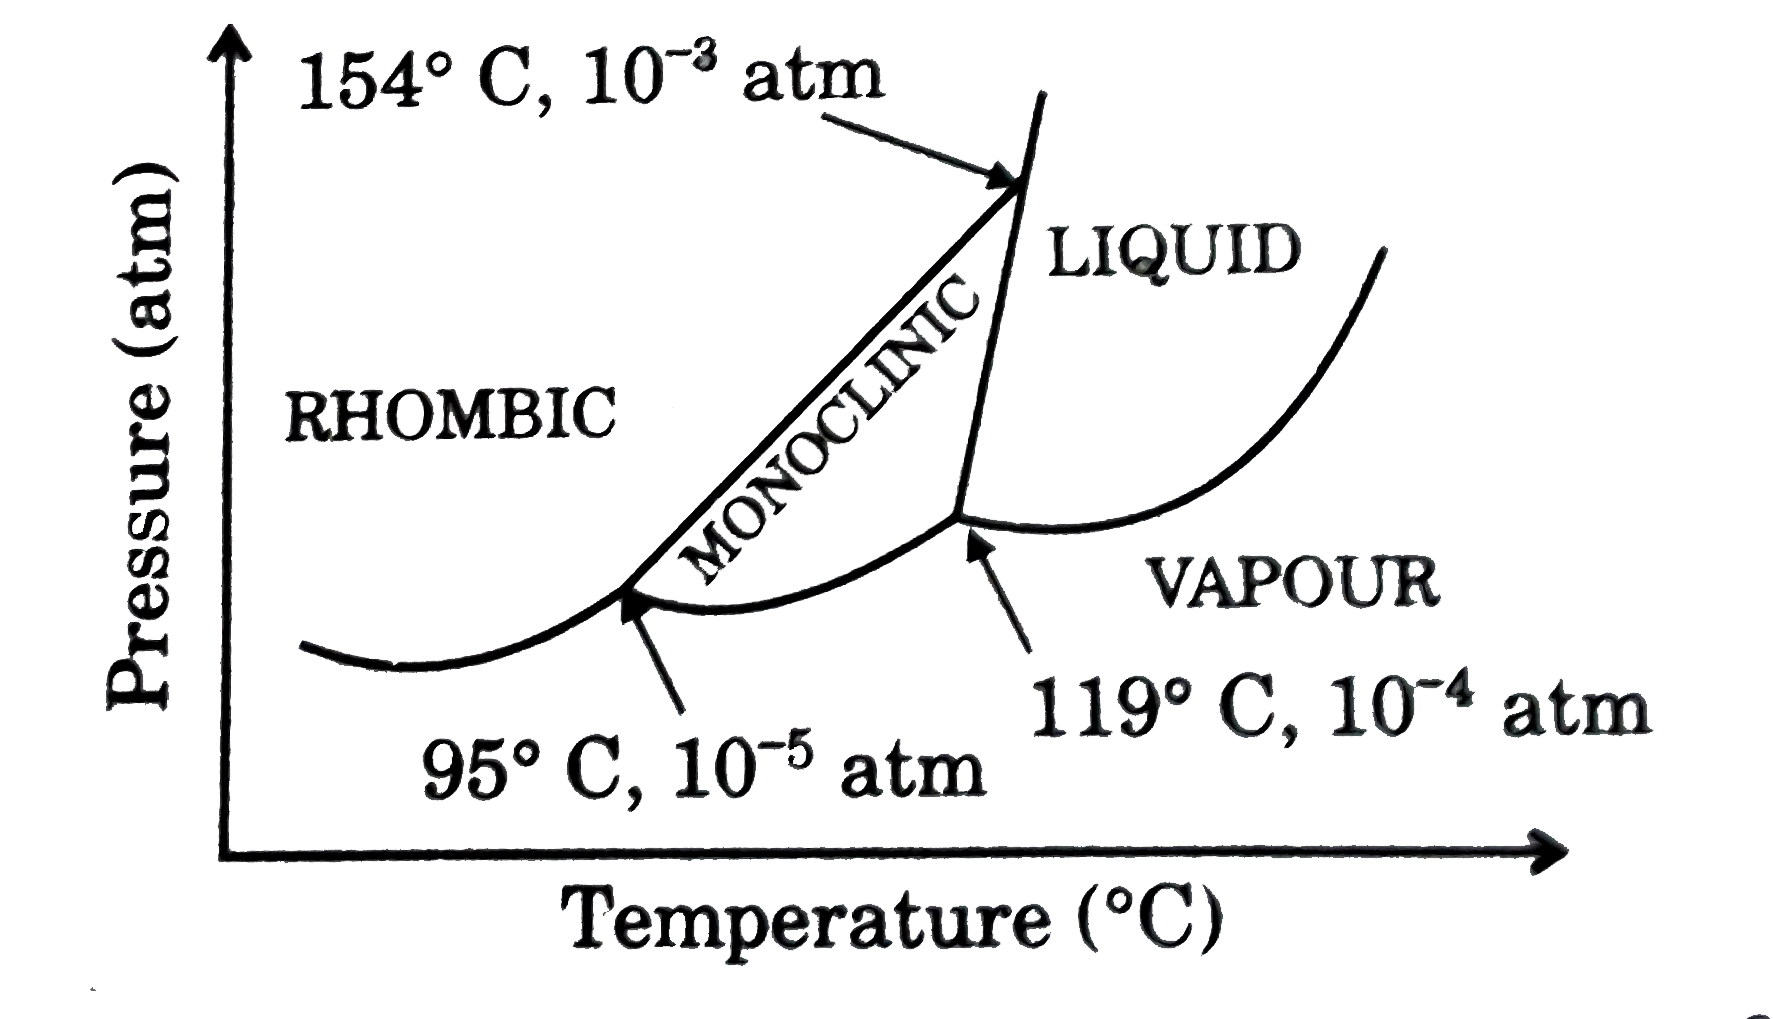
View SolutionThe phase diagram for sulphur is shown below. Which statement about this diagram is correct ?
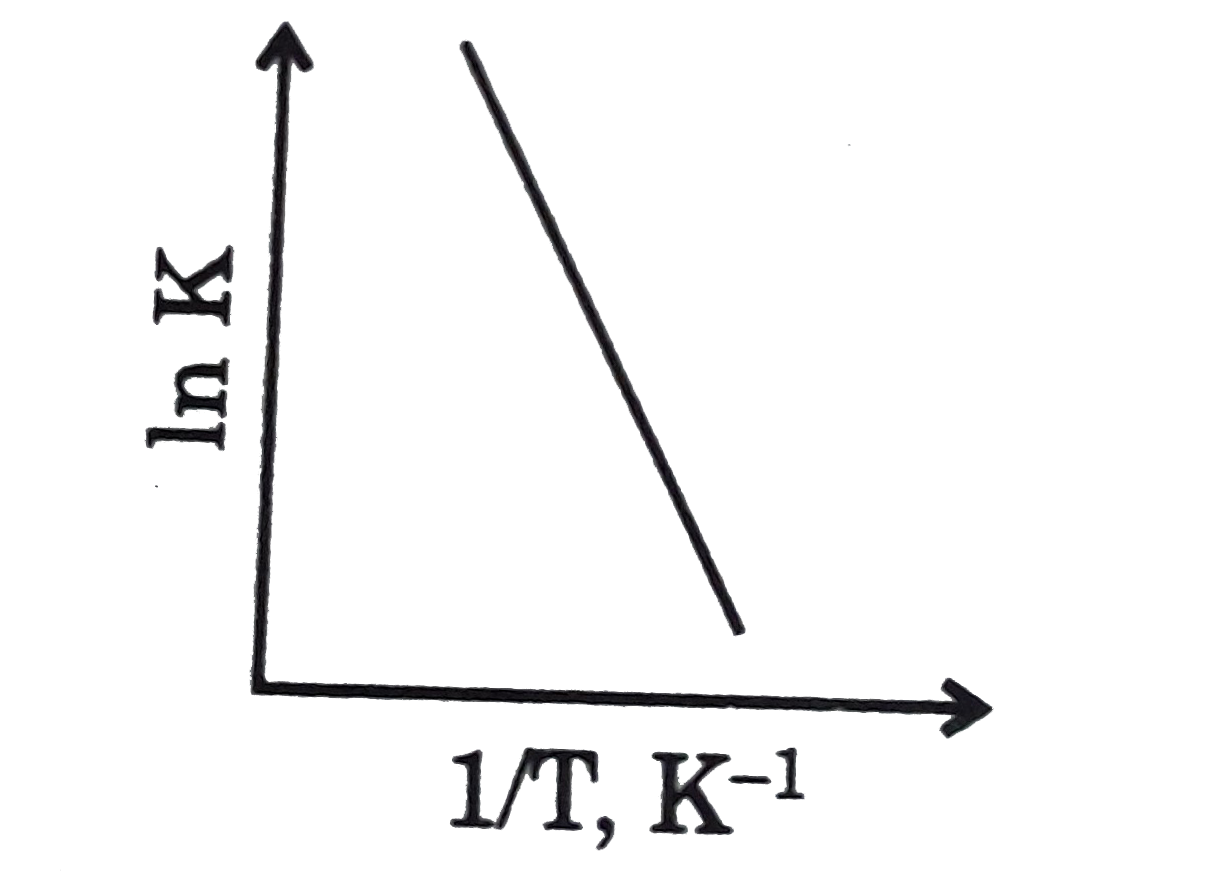
View SolutionWhat quantity is represented by the slope of the line in this graph of the temperature dependence of the natural log of an equilibrium constant ?
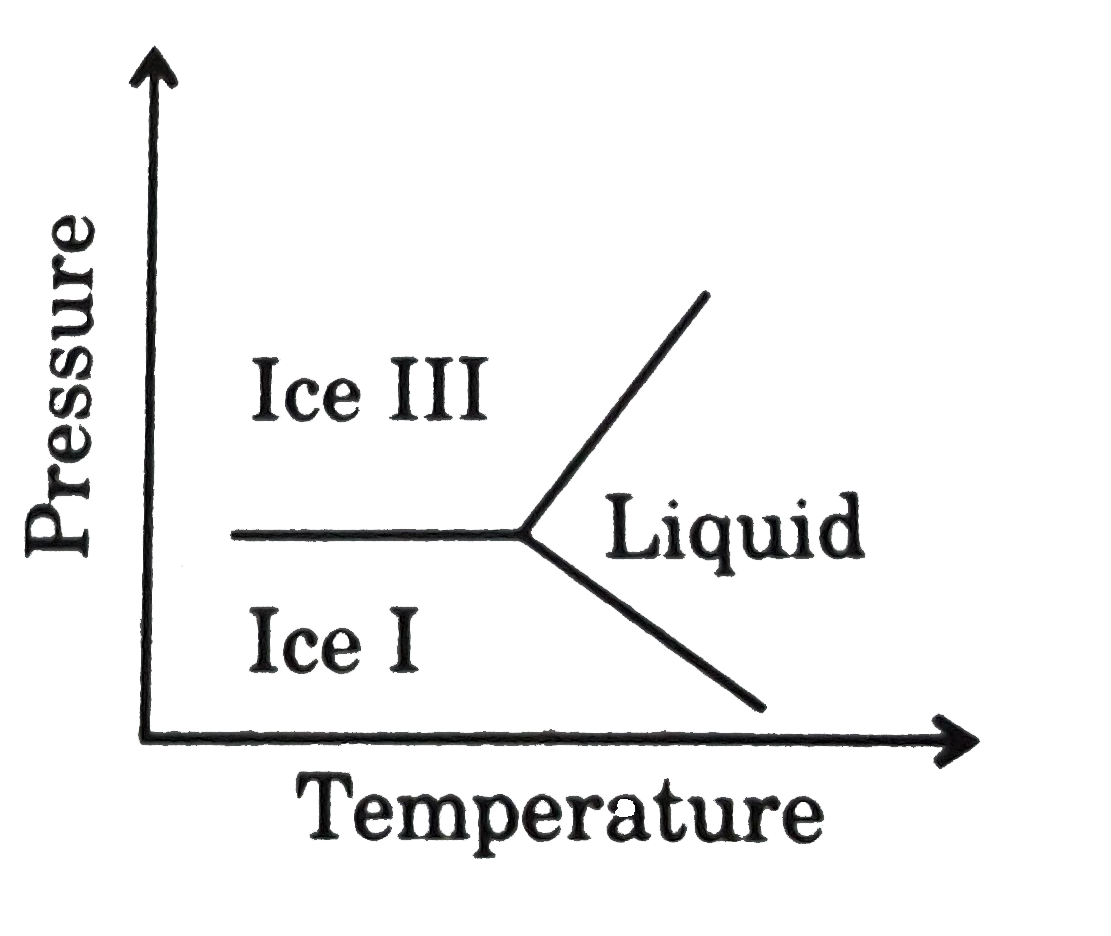
View SolutionWater ice exists in several different form depending on the pressure and temperature. A proton of the phase diagram for ice I, ice III and liquid water is shown below. Which statement about the densities of these three phases is correct ?
View SolutionUnder certain conditions, `CO_(2)` melts rather than sublimes, `CO_(2)` which transition in the phase diagram does this change correspond ?
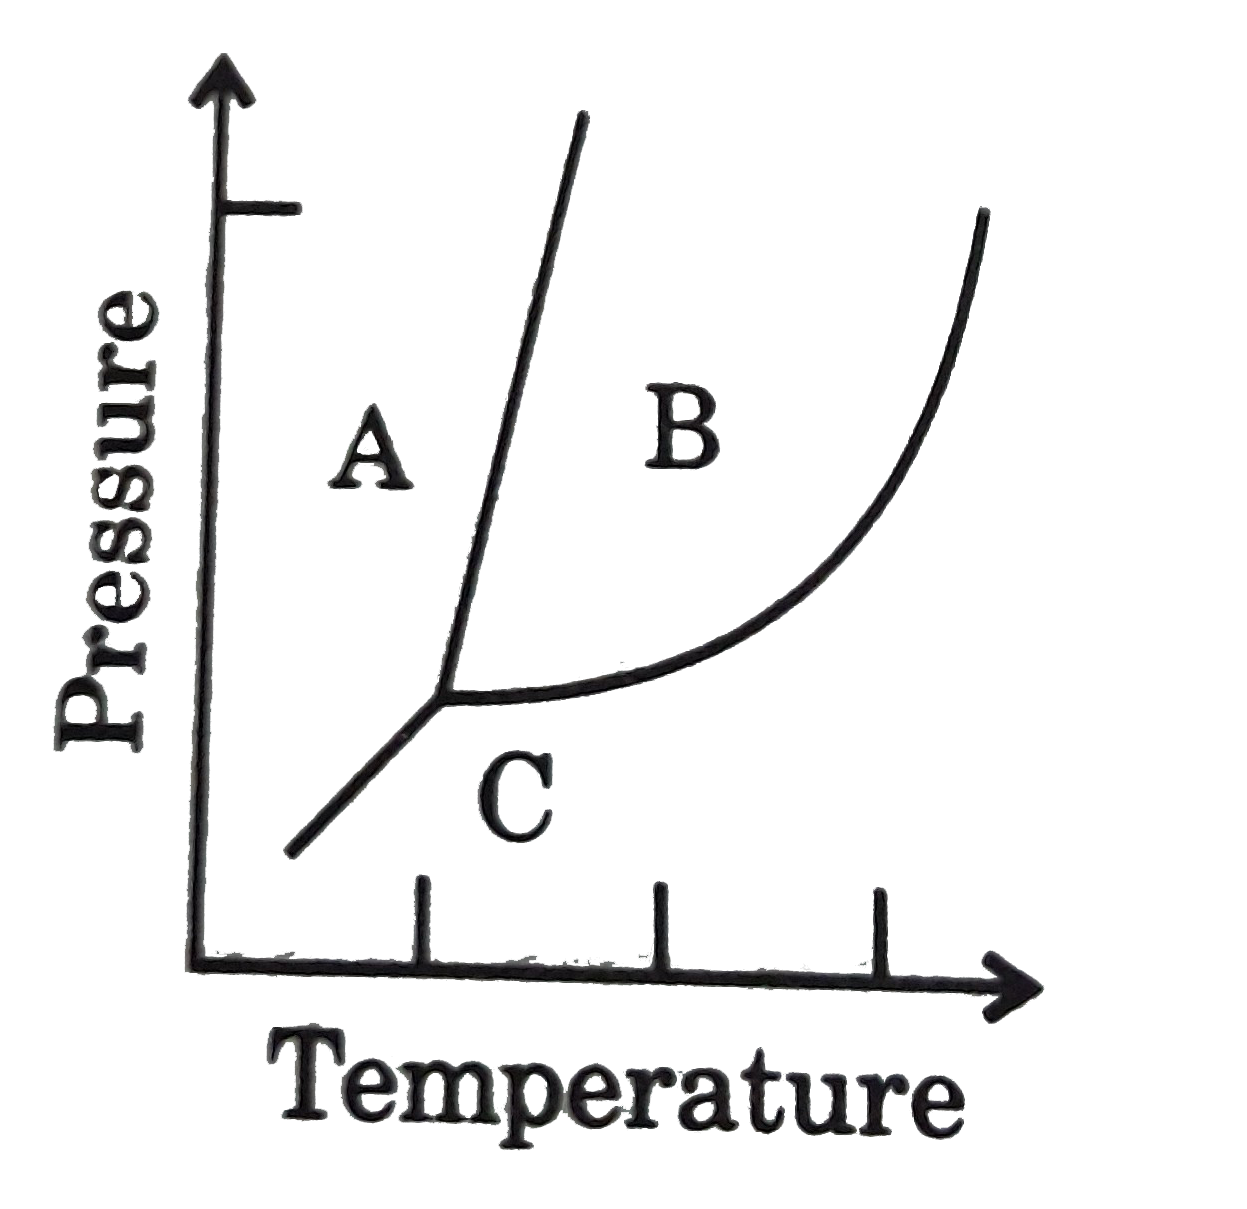
View SolutionWhich of the following graphs is the correct phase diagram of a substance whose melting point increases with pressure ?
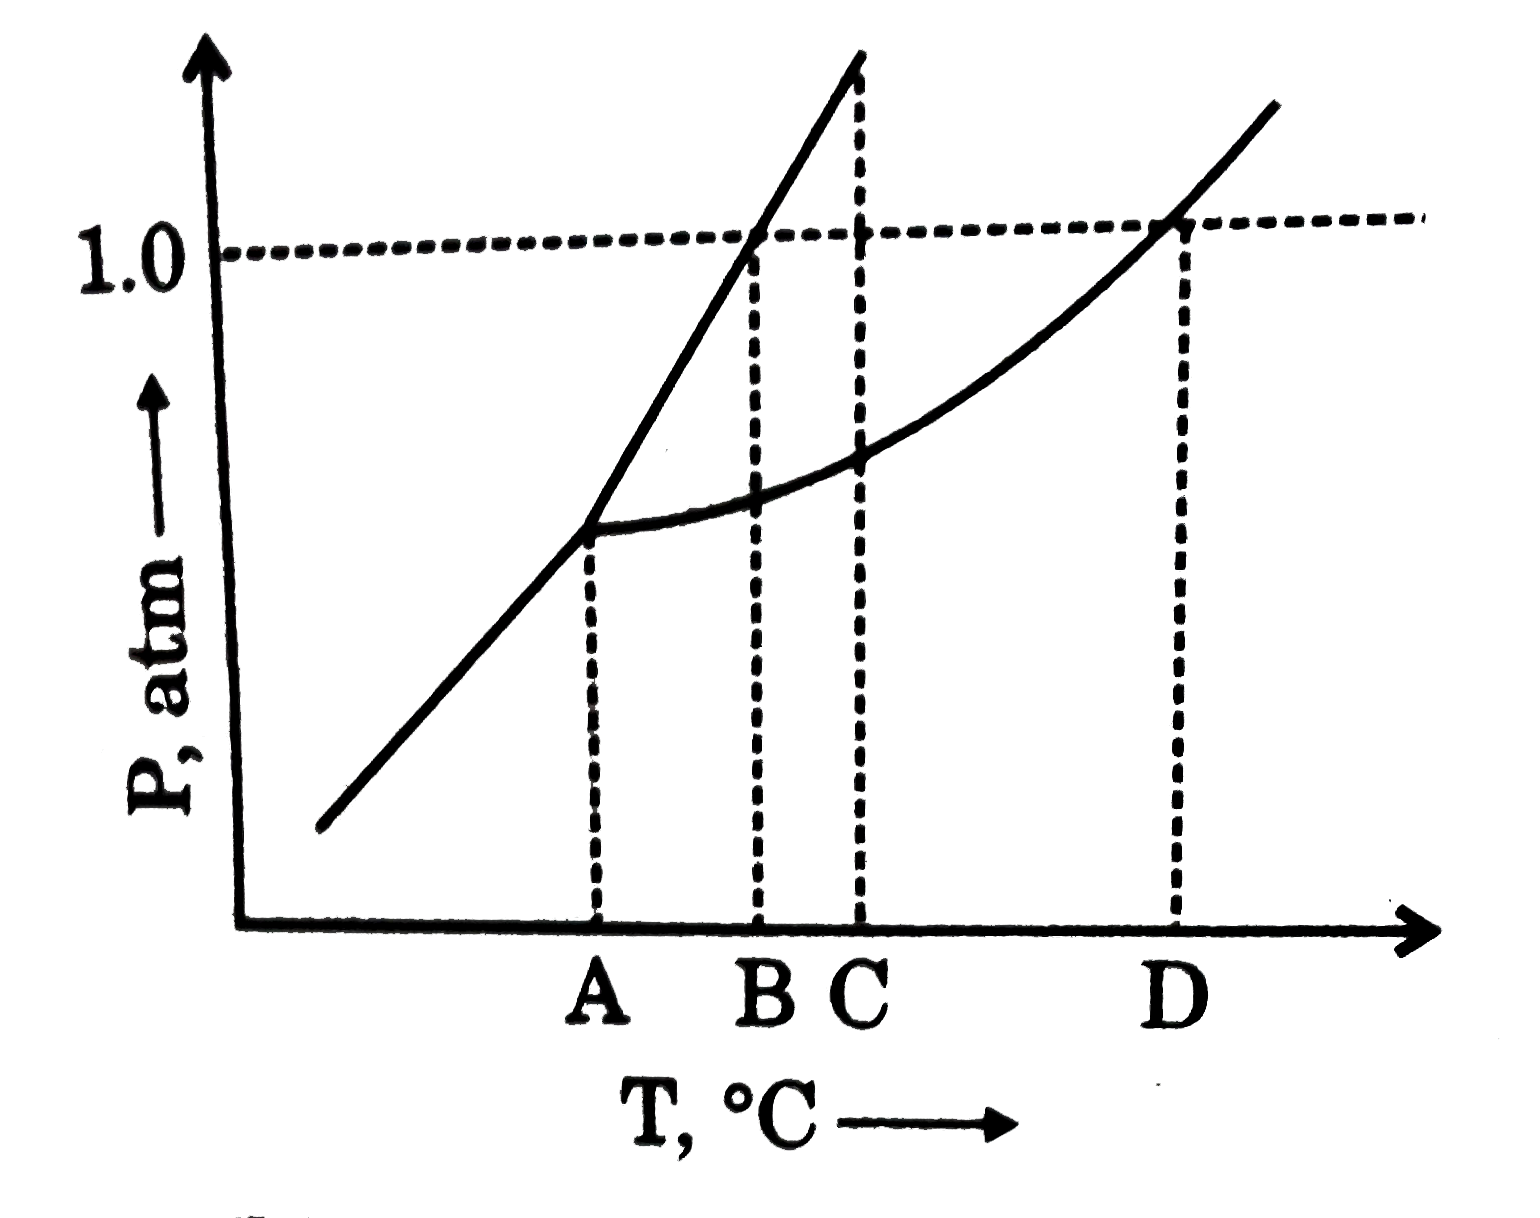
View SolutionWhat is the normal melting point of the substance represented by the phase diagram ?
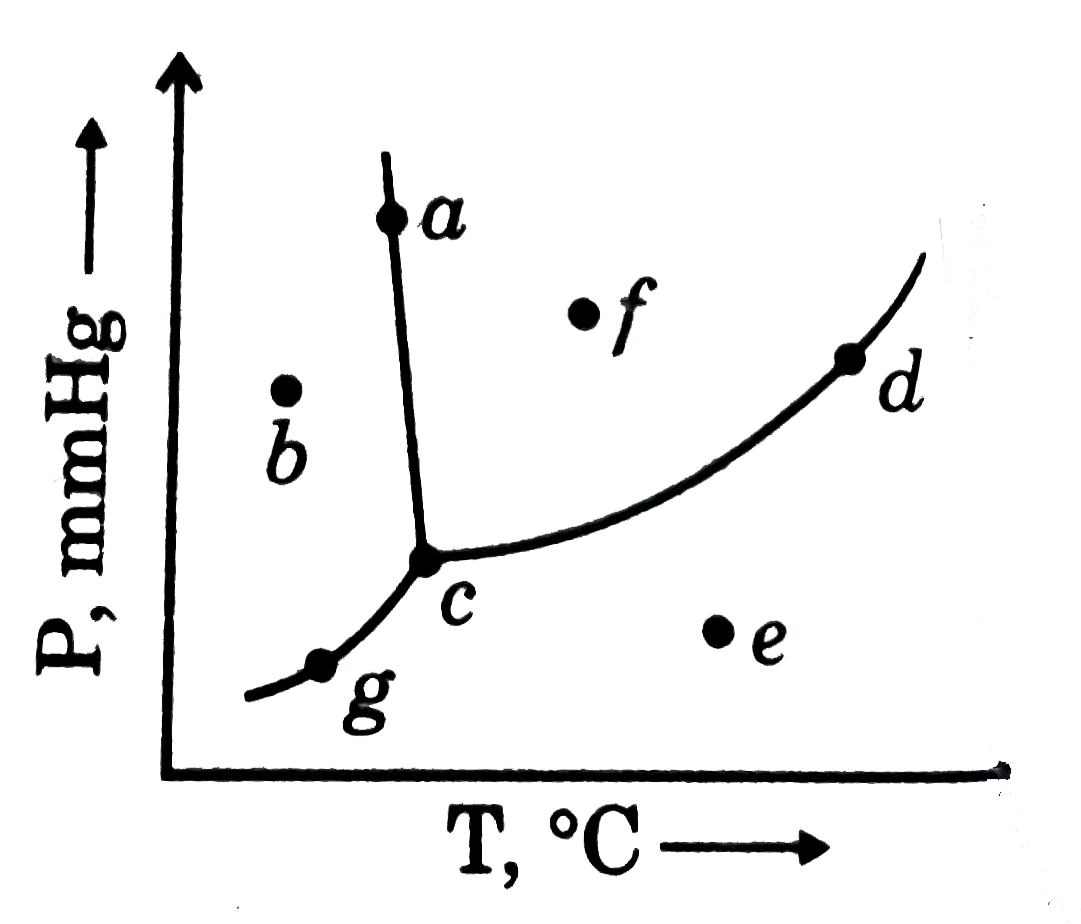
View SolutionWhich points in this phase diagram represent conditions of temperature and pressure where liquid will be present ?
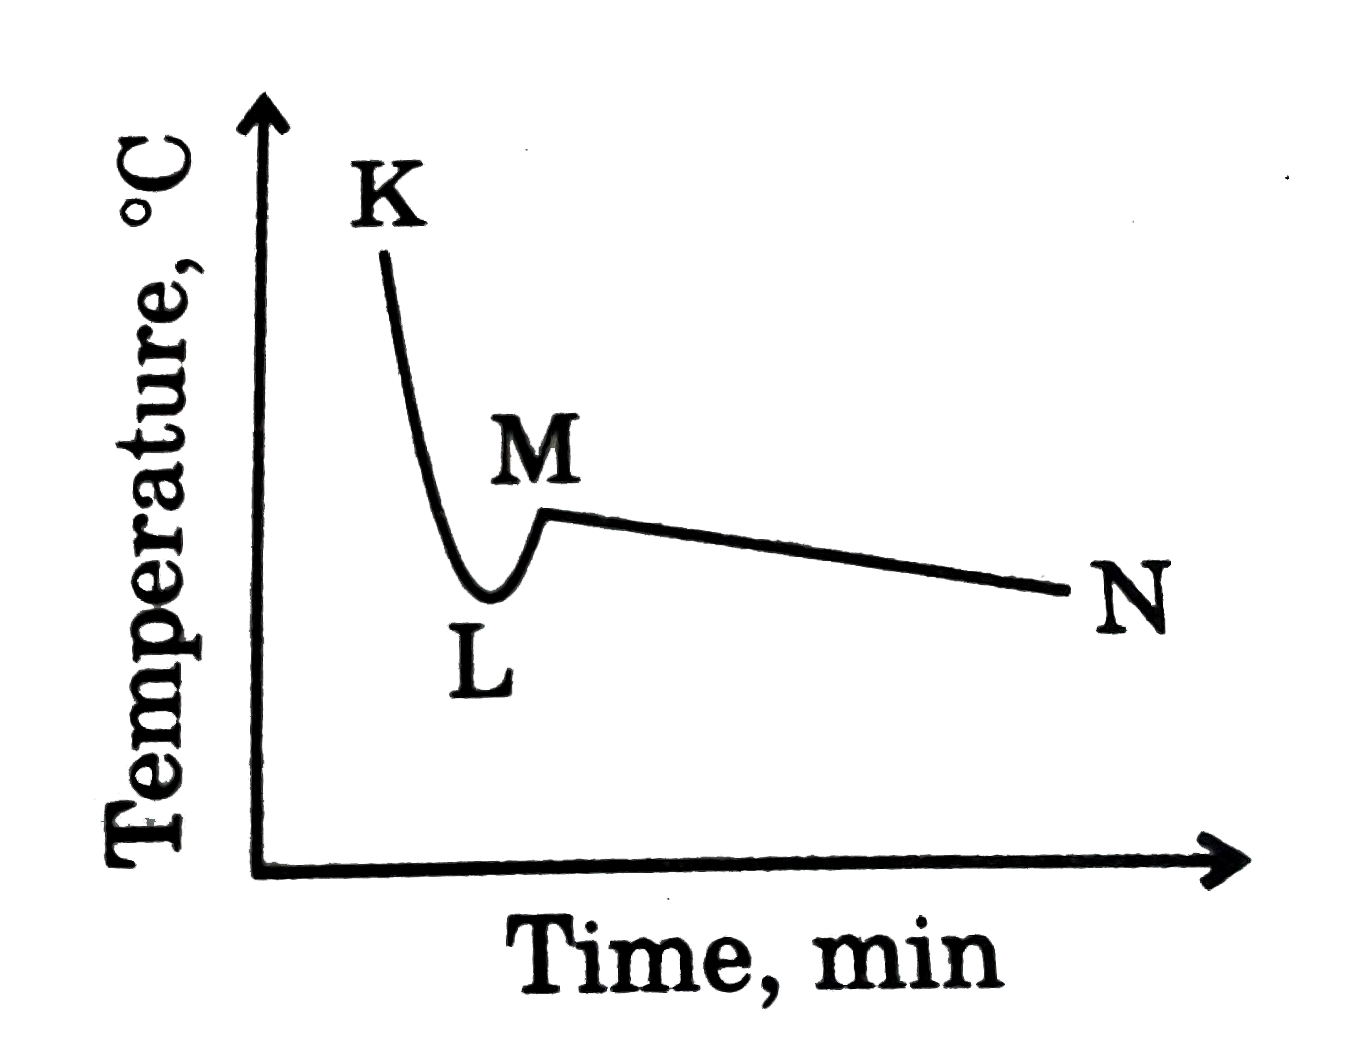
View SolutionThe curve shown results when a liquid is cooled. What temperature is closest to the freezing point of the liquid ?
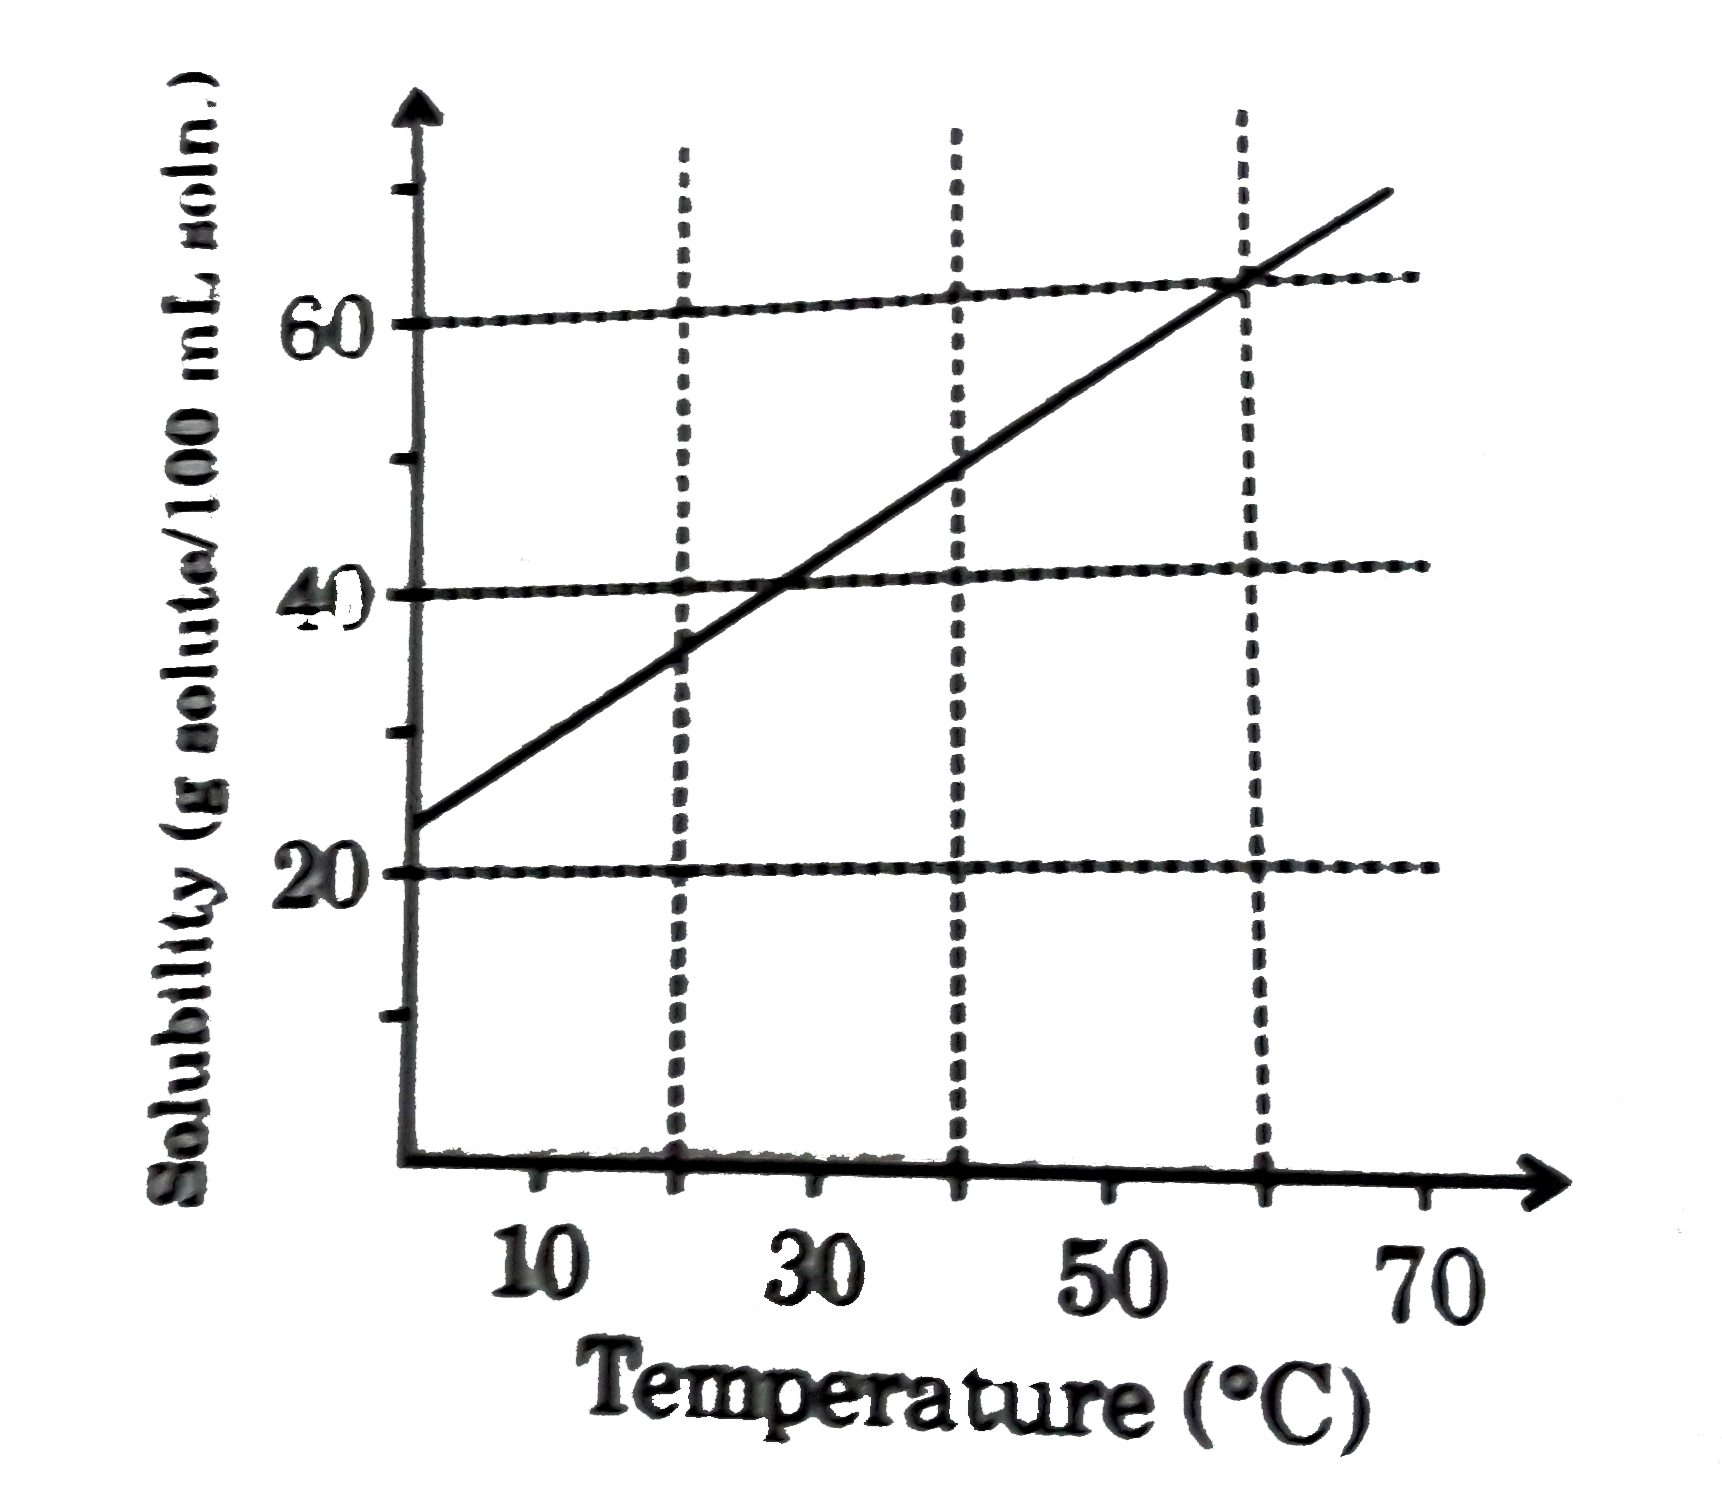
View SolutionAccording to the solubility curve shown, how many grams of solute can be recrystallized when 20 mL of a saturated solution at `60^(@)C` are cooled to `0^(@)C` ?
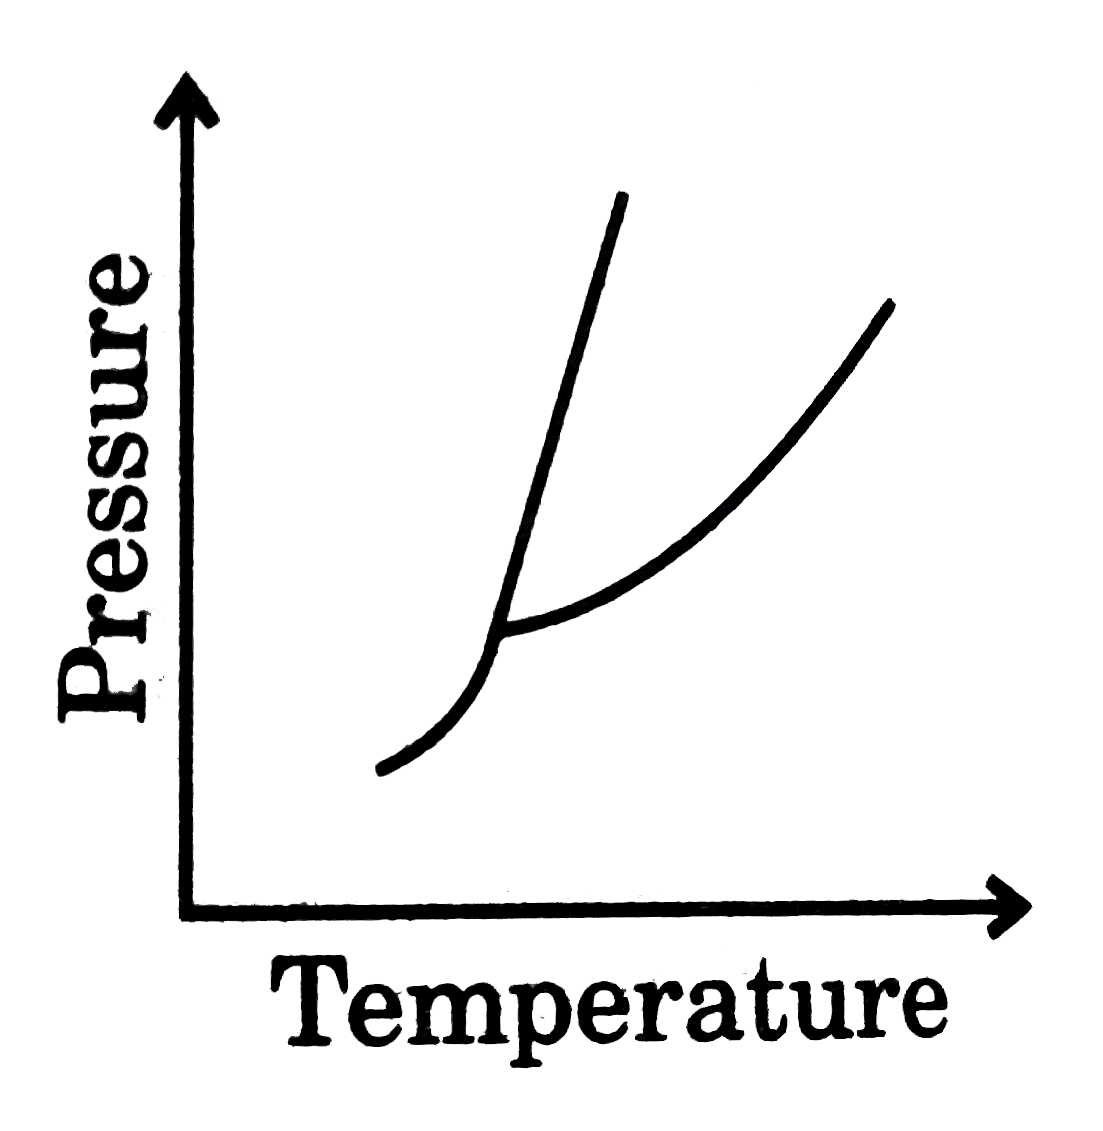
View SolutionAccording to the phase diagram, what would be the effect of increasing the pressure on this substance ?
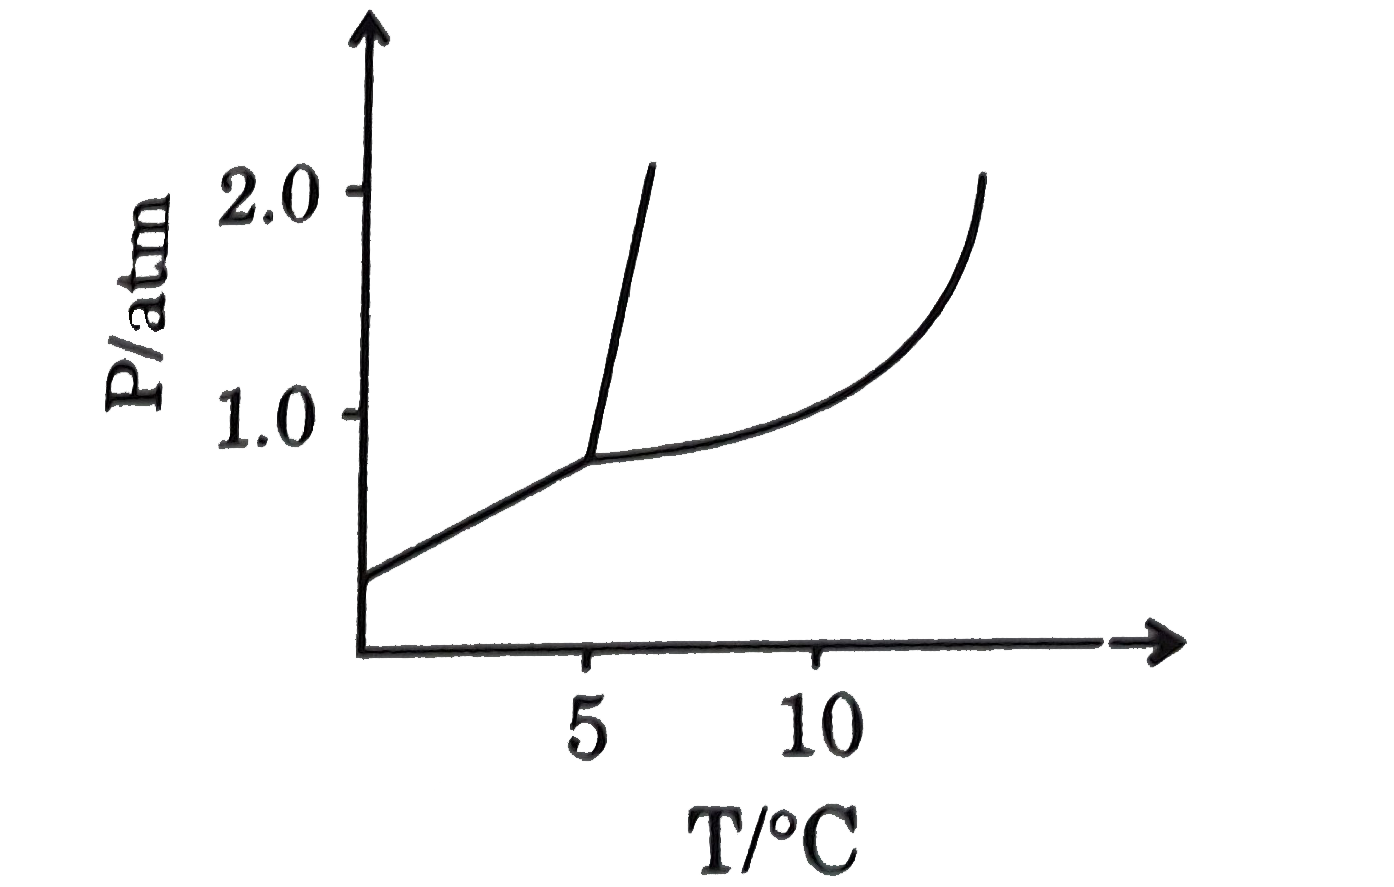
View SolutionAccording to the phase diagram shown, in what state does not represented substance exist at `1.0` atm and `0.0^(@)C` ?
View SolutionWhich statement is correct about the substance represented by this phase diagram ?
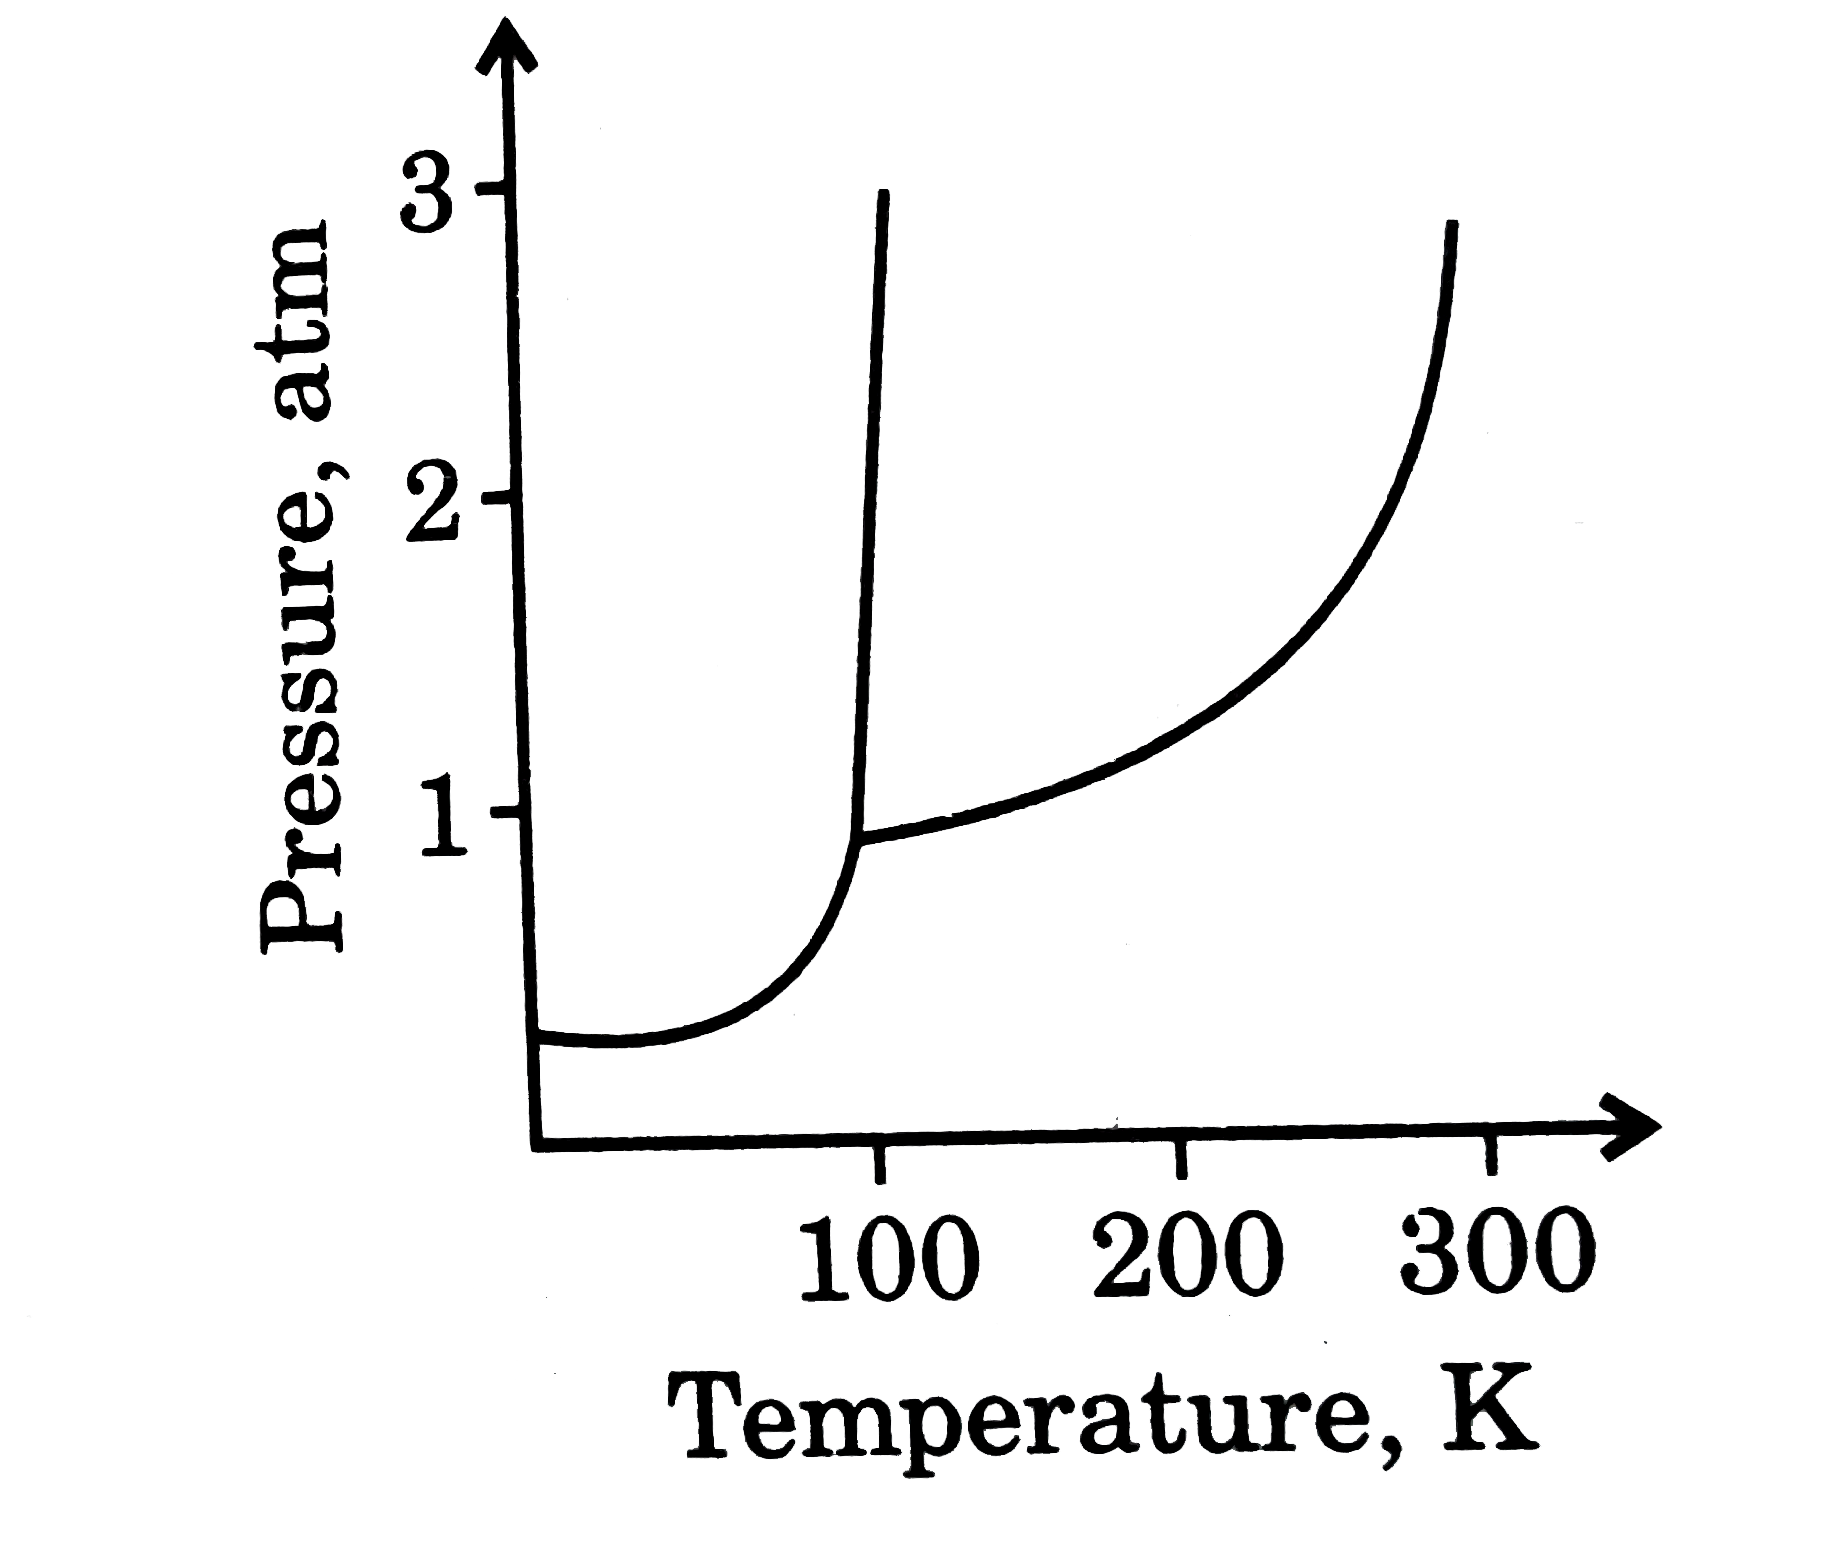
View SolutionAccording to this phase diagram, which phases can exist at pressure lower than the triple point pressure ?
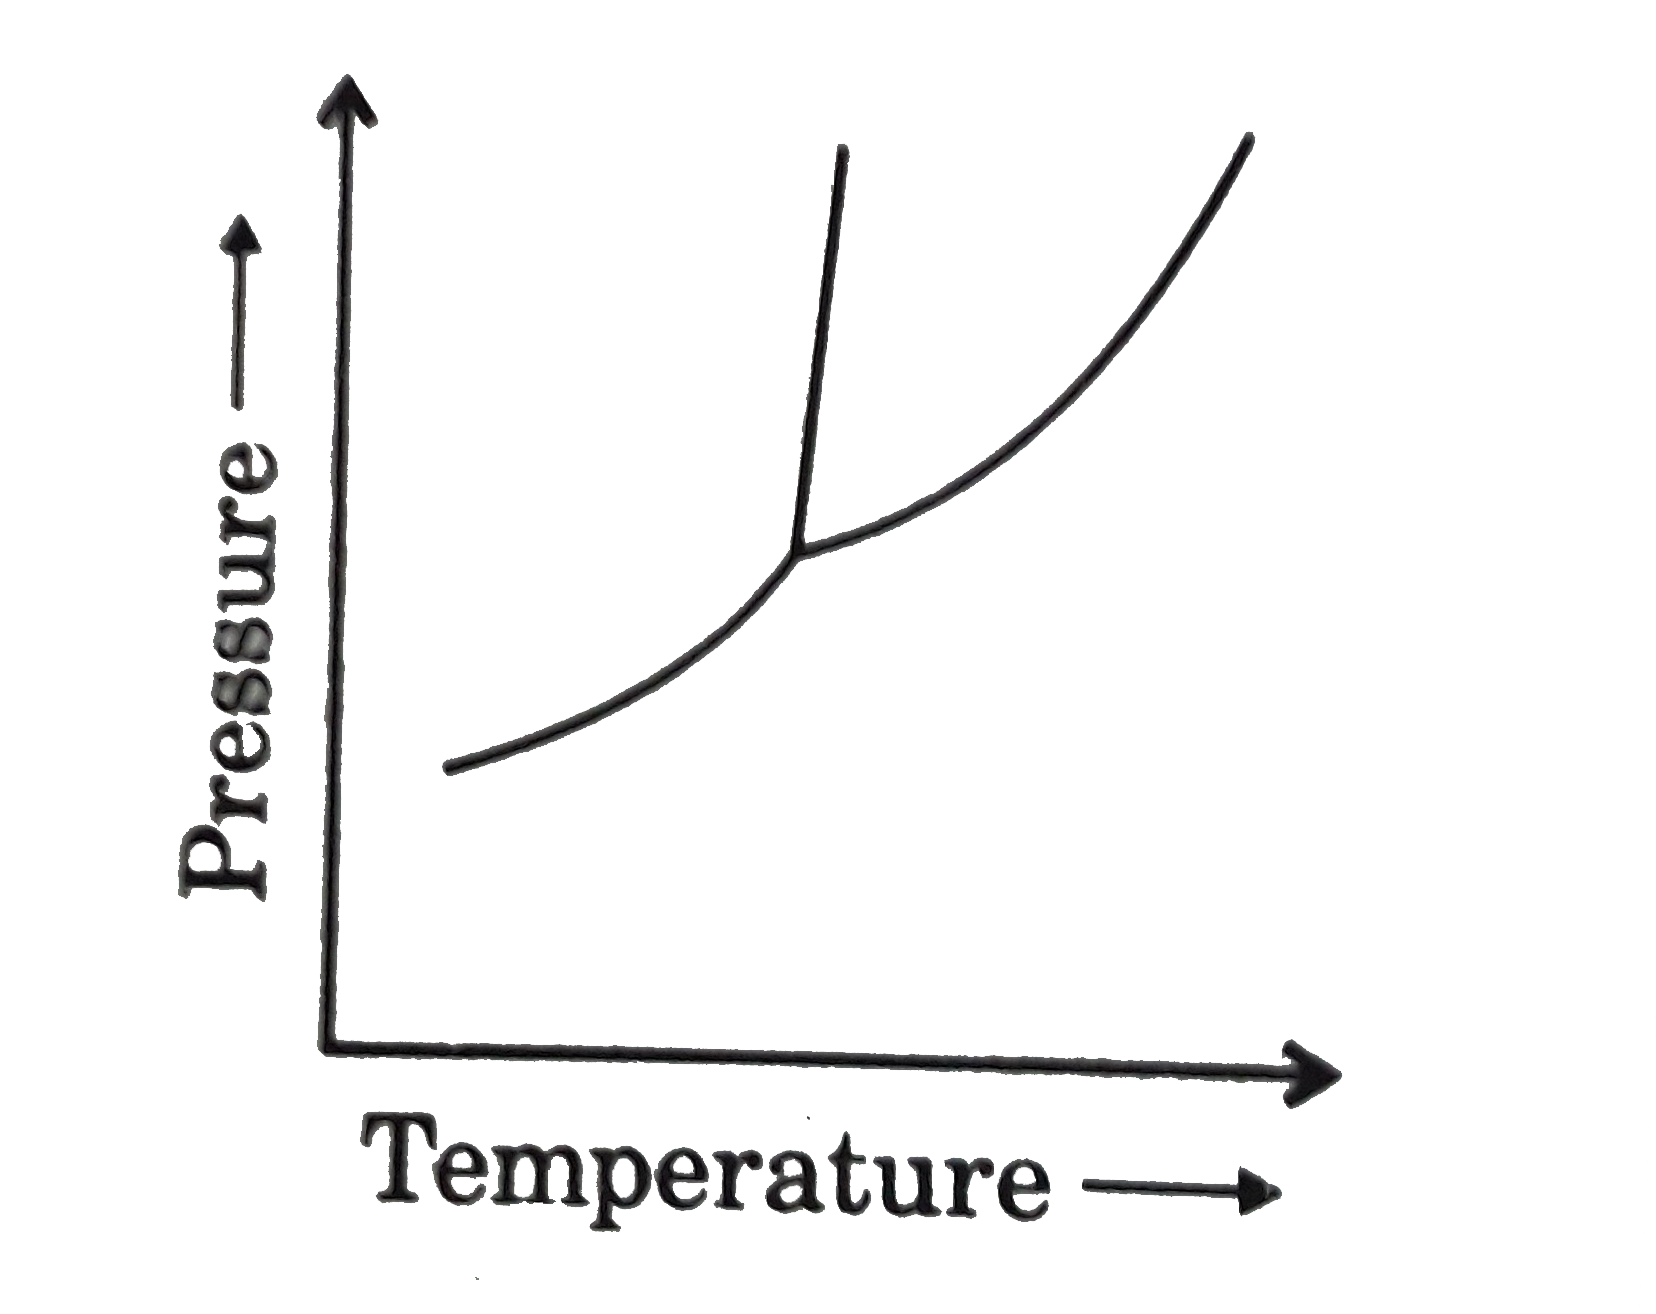
View SolutionAccording to the phase diagram shown, where does a mixture of solid and liquid exist at equilibrium ?
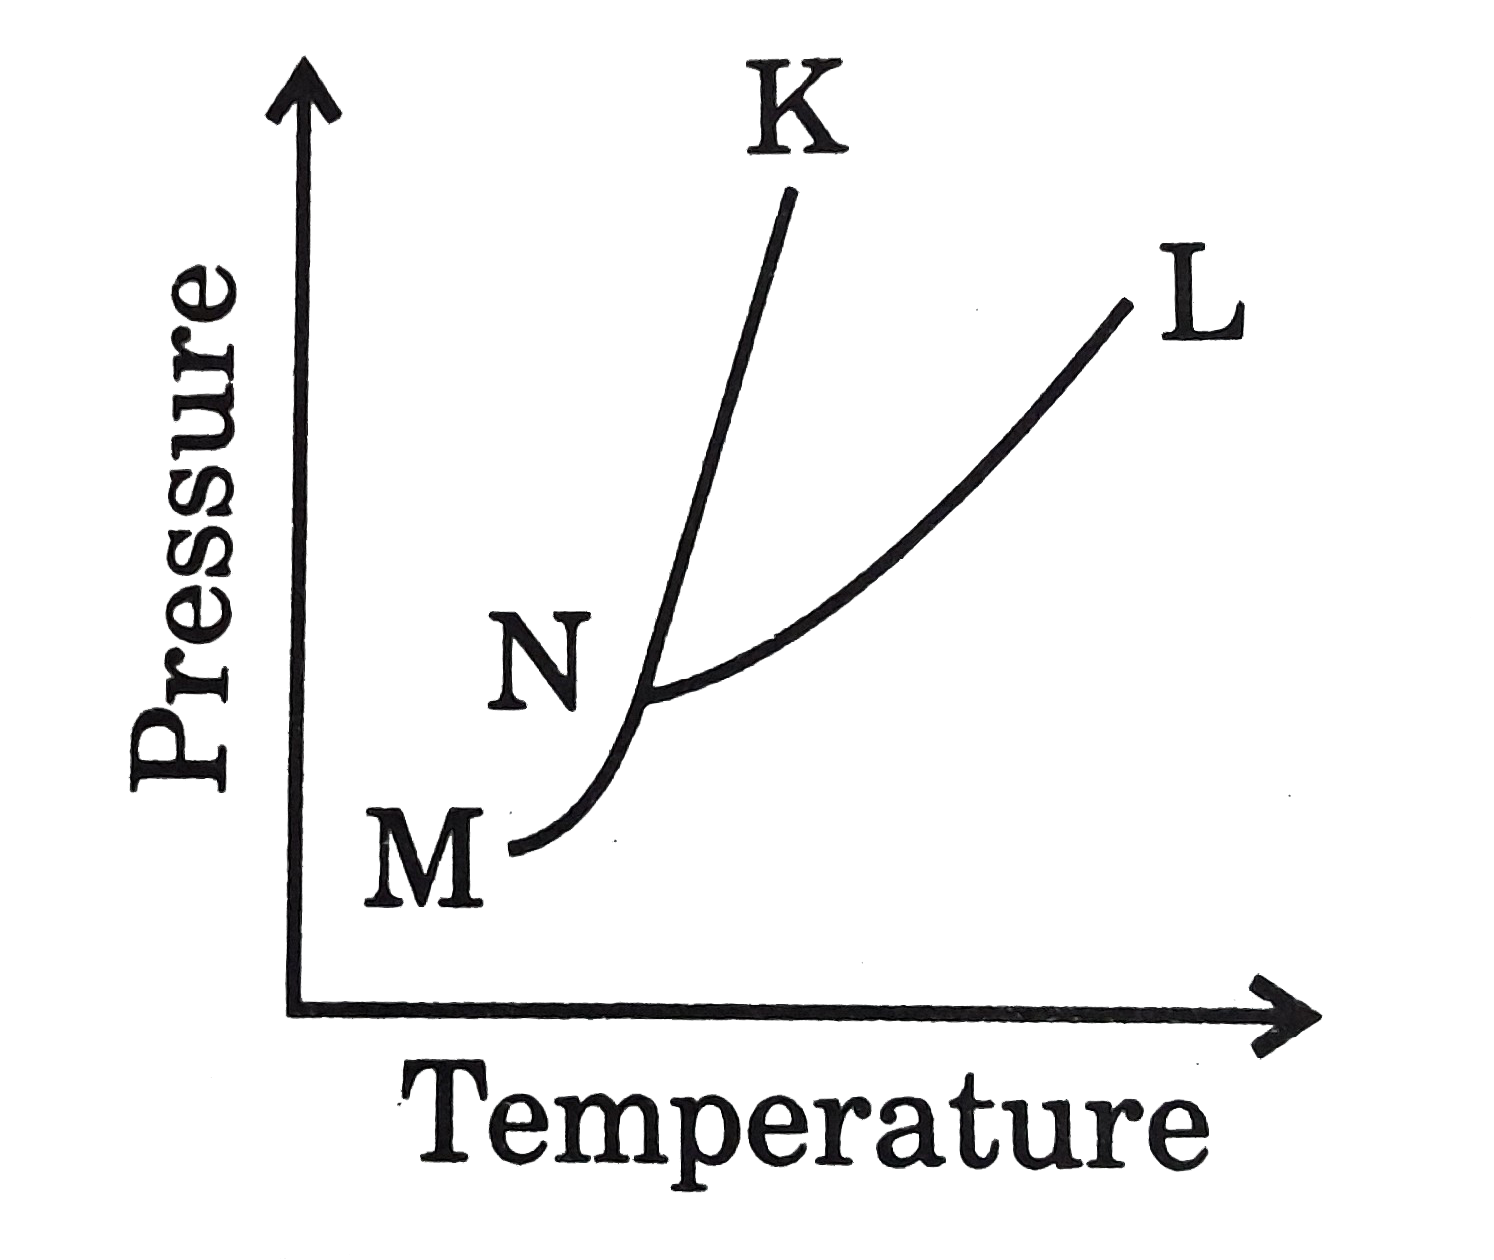
View SolutionSupercritical carbon dioxide exists at which point on the accompanying phase diagram ?
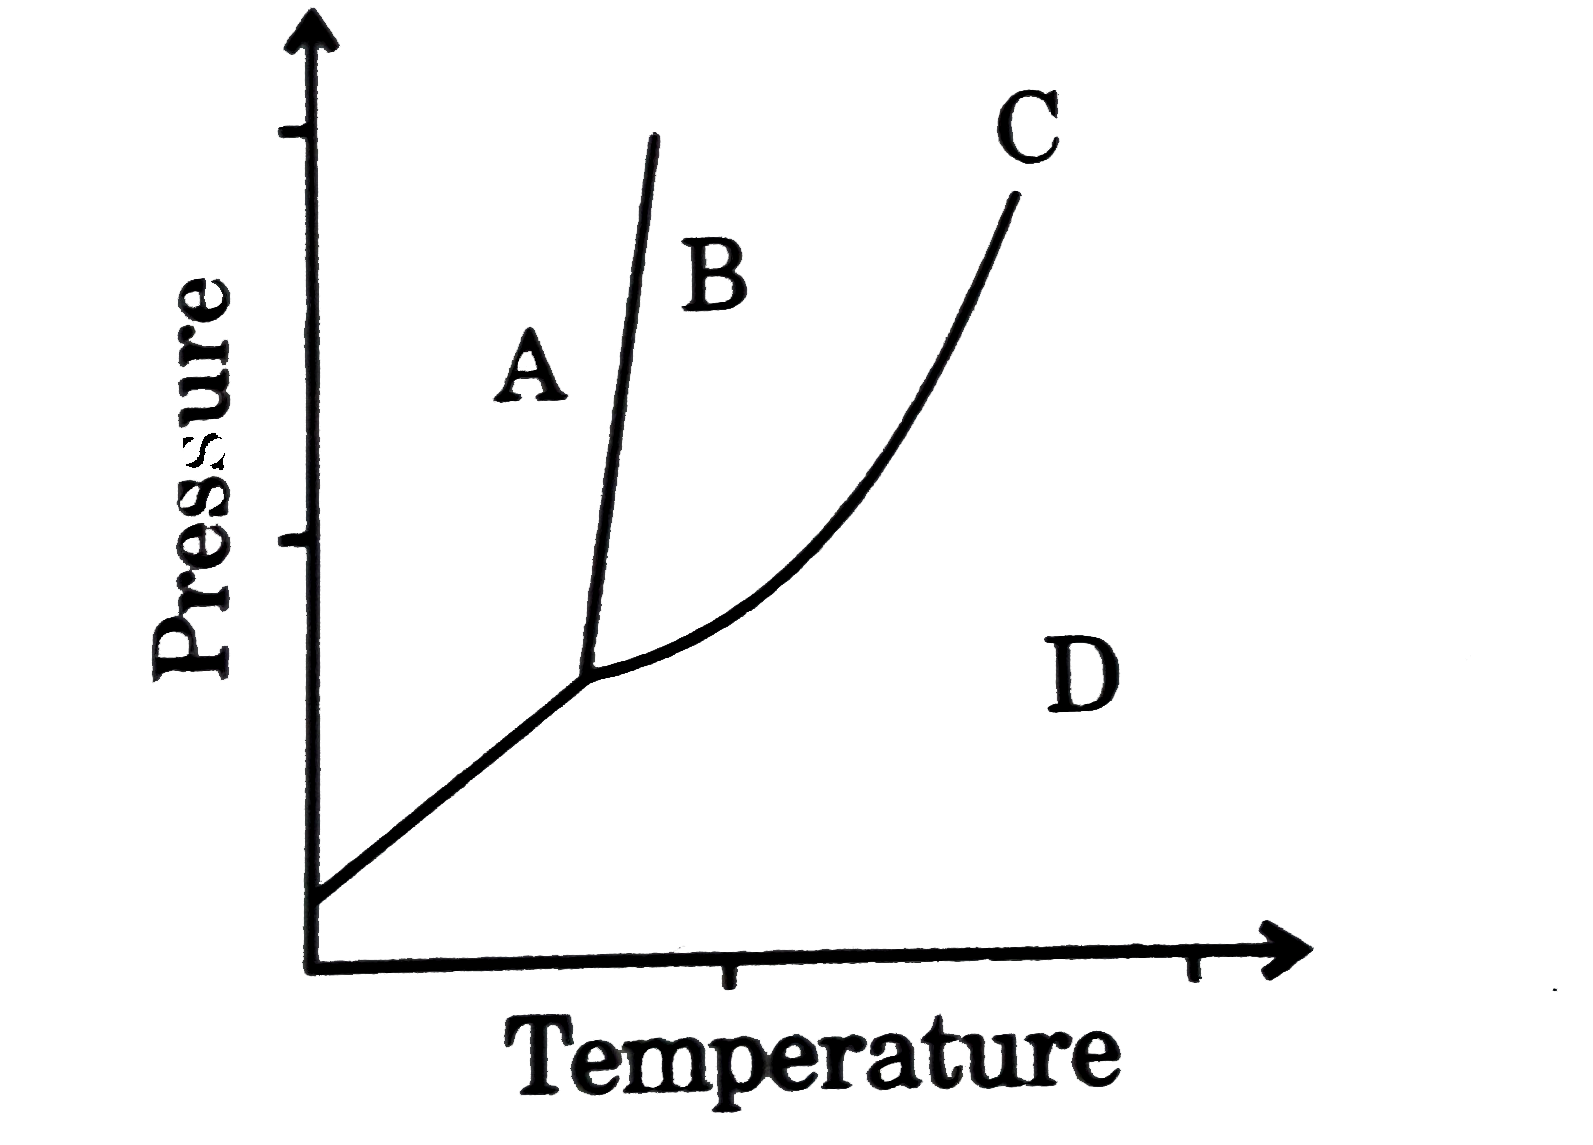
View SolutionWhich point on the phase diagram represents the normal boiling point?
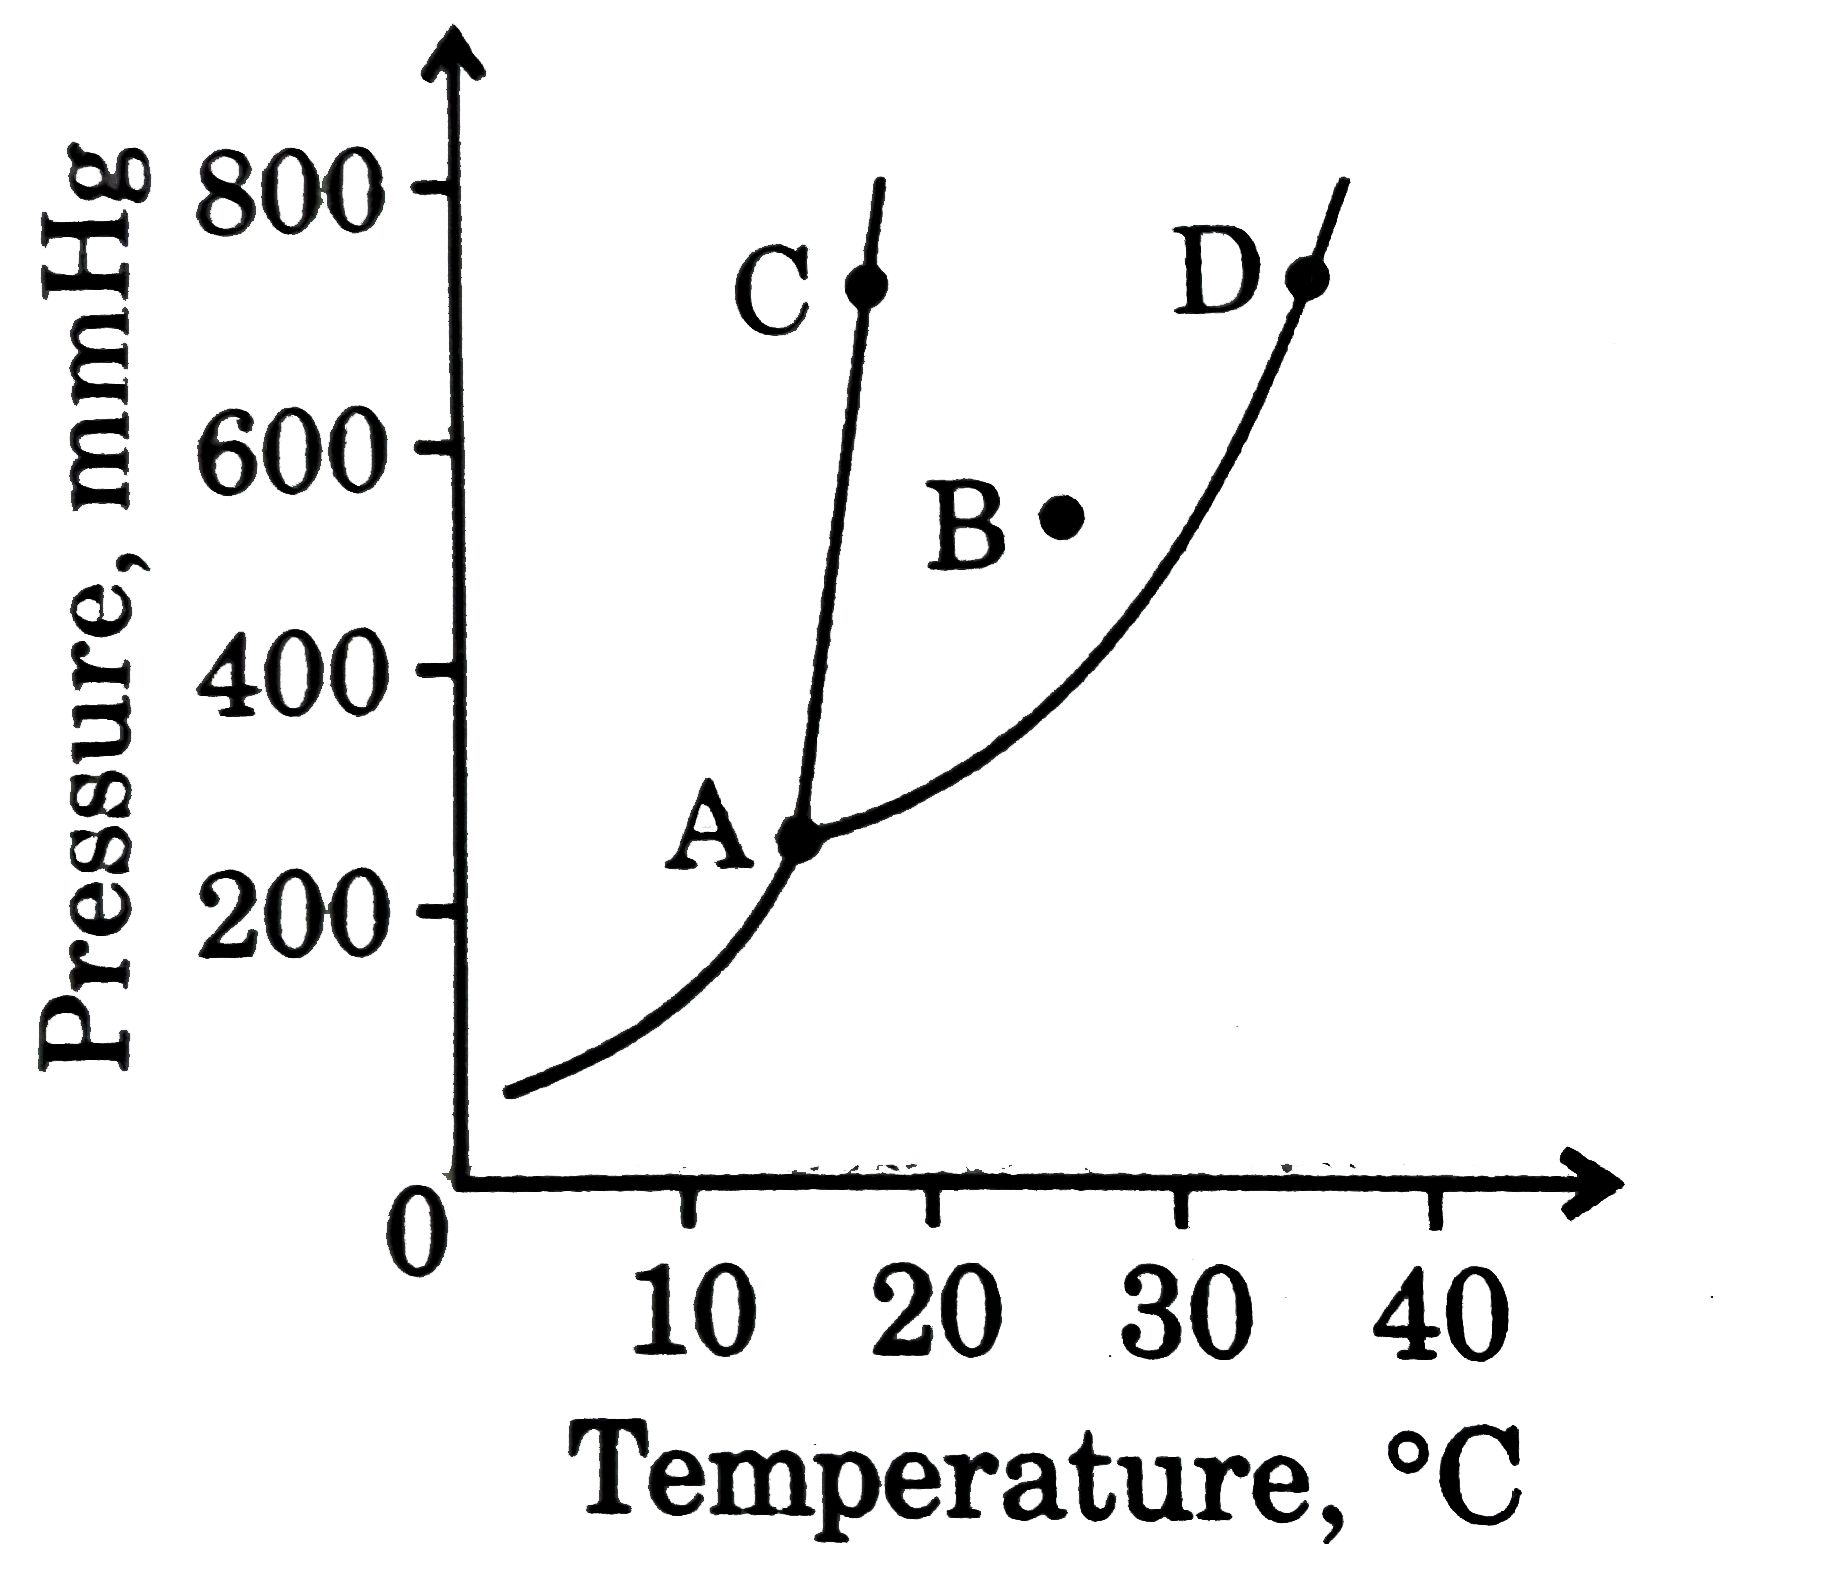
View SolutionWhat can be concluded about the substance represented by this phase diagram ?
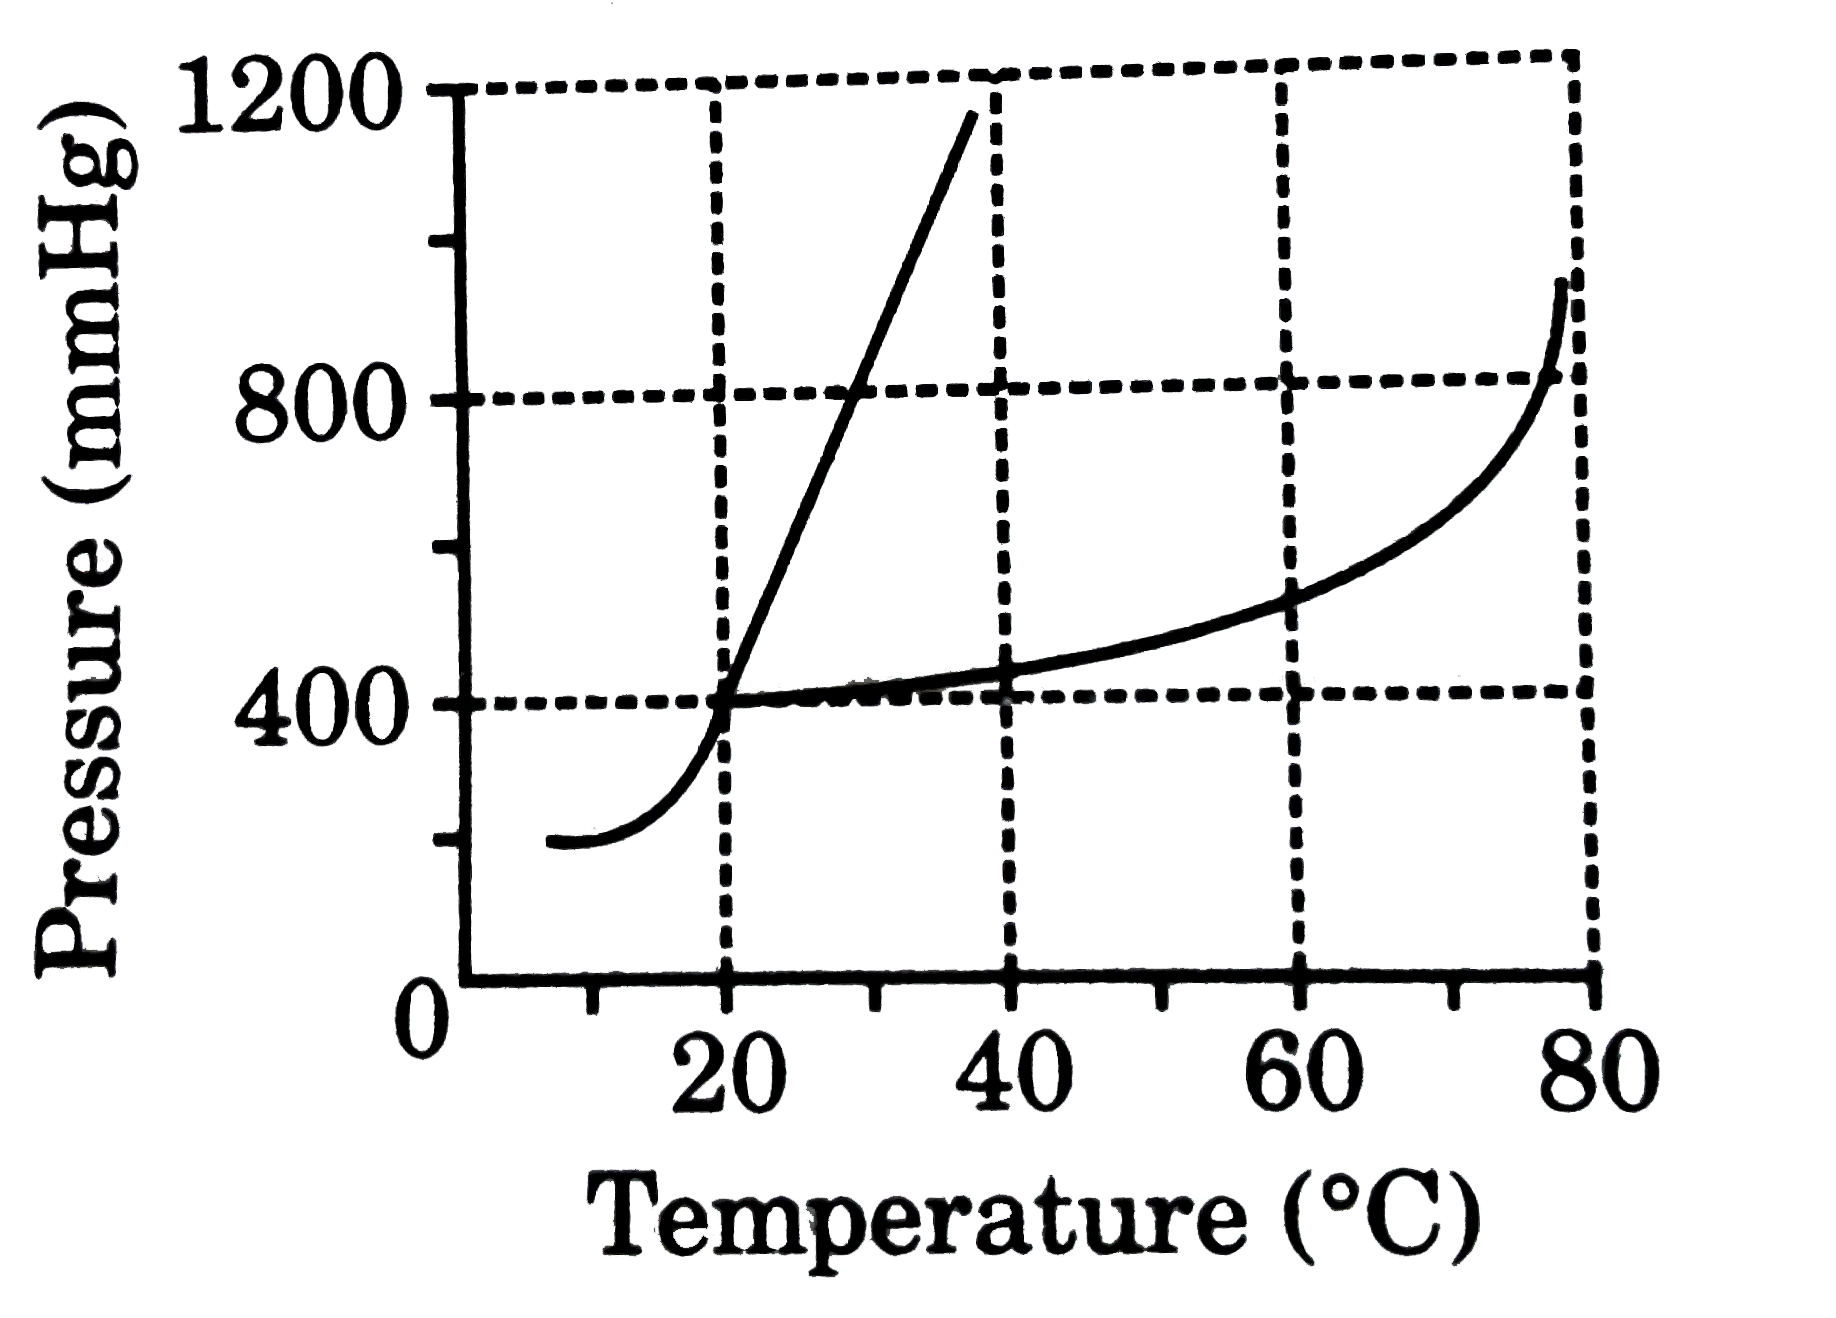
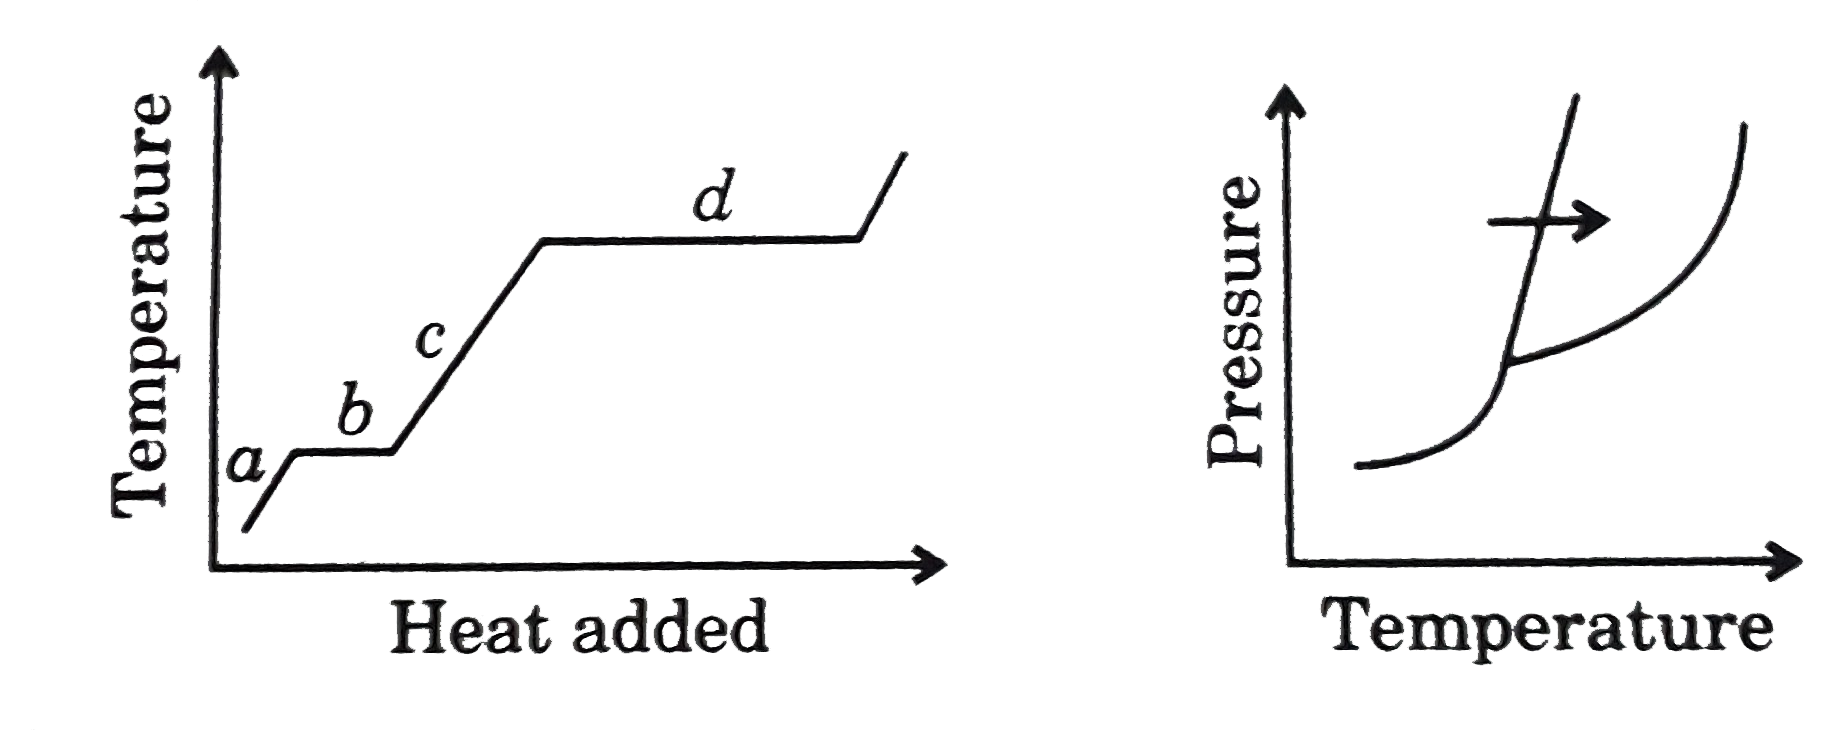
View SolutionWhich segment of the heating curve obtained at constant pressure corresponds to the transition denoted by the arrow in the phase diagram ?
View SolutionWhich graph best represents the vapour pressure of water as a function of temperature from `0^(@)C` to `100^(@)C` ?
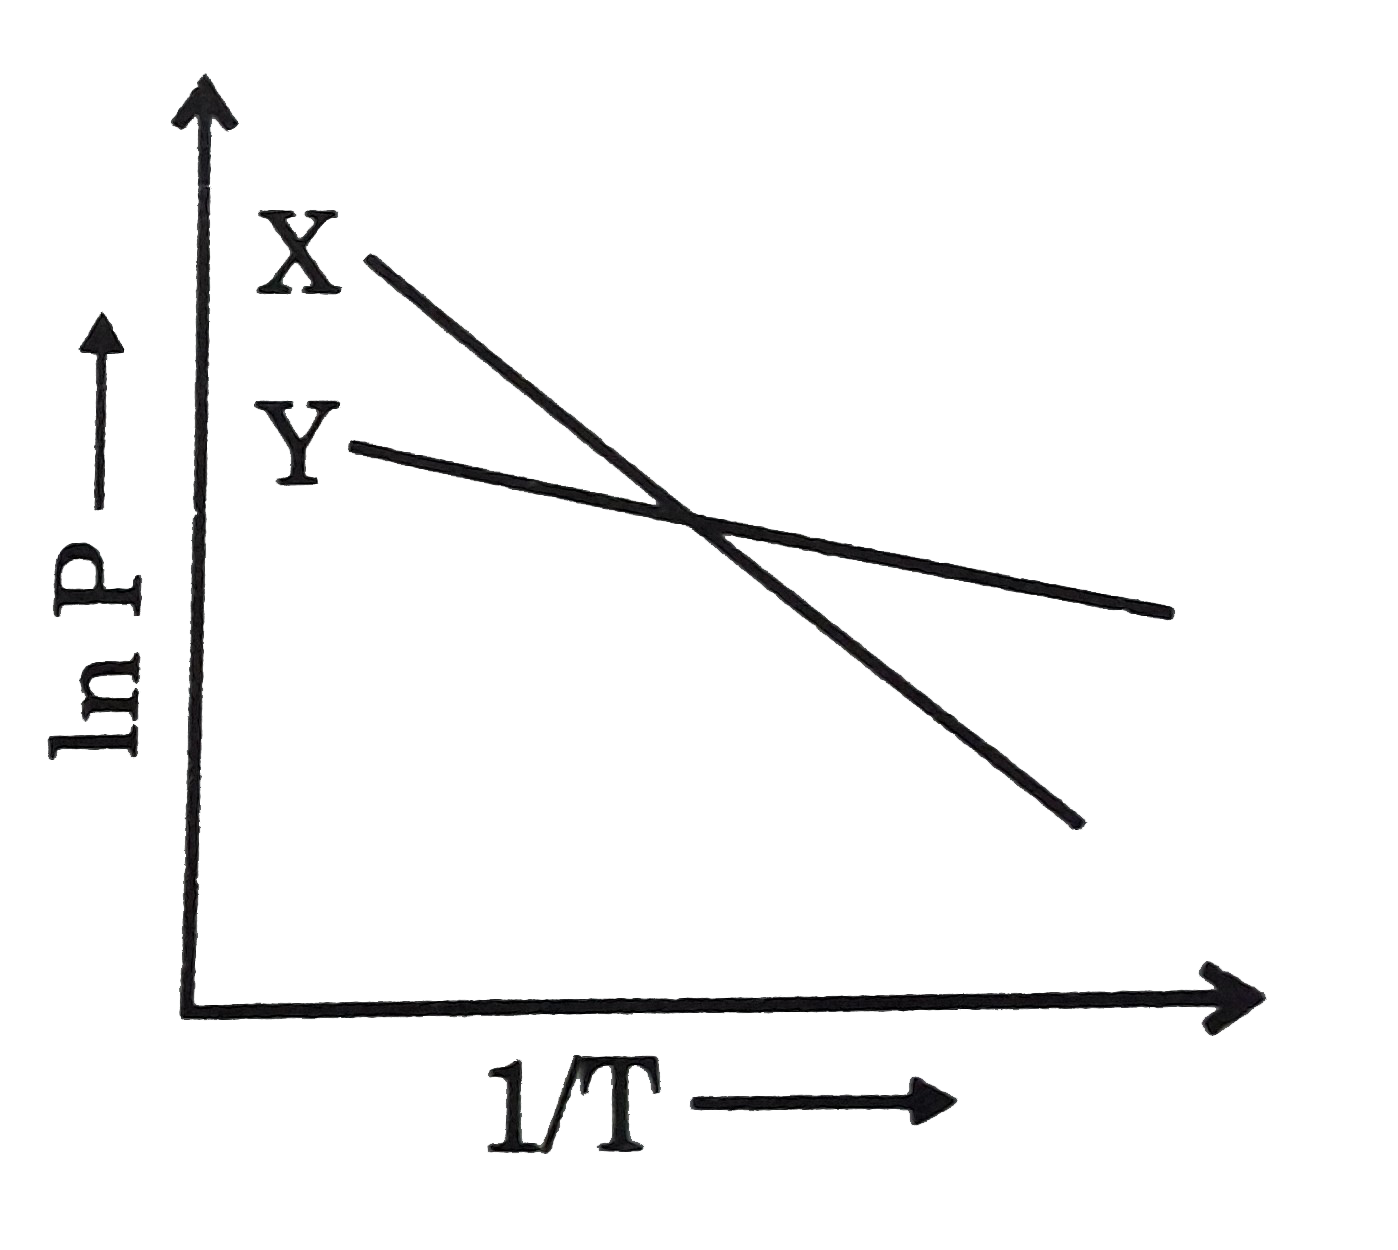
View SolutionAccording to the graph (ln vapour pressure us `1//T)` what can be concluded about the enthalpies of vaporization `(DeltaH_(vap))` of liquids X and Y ?
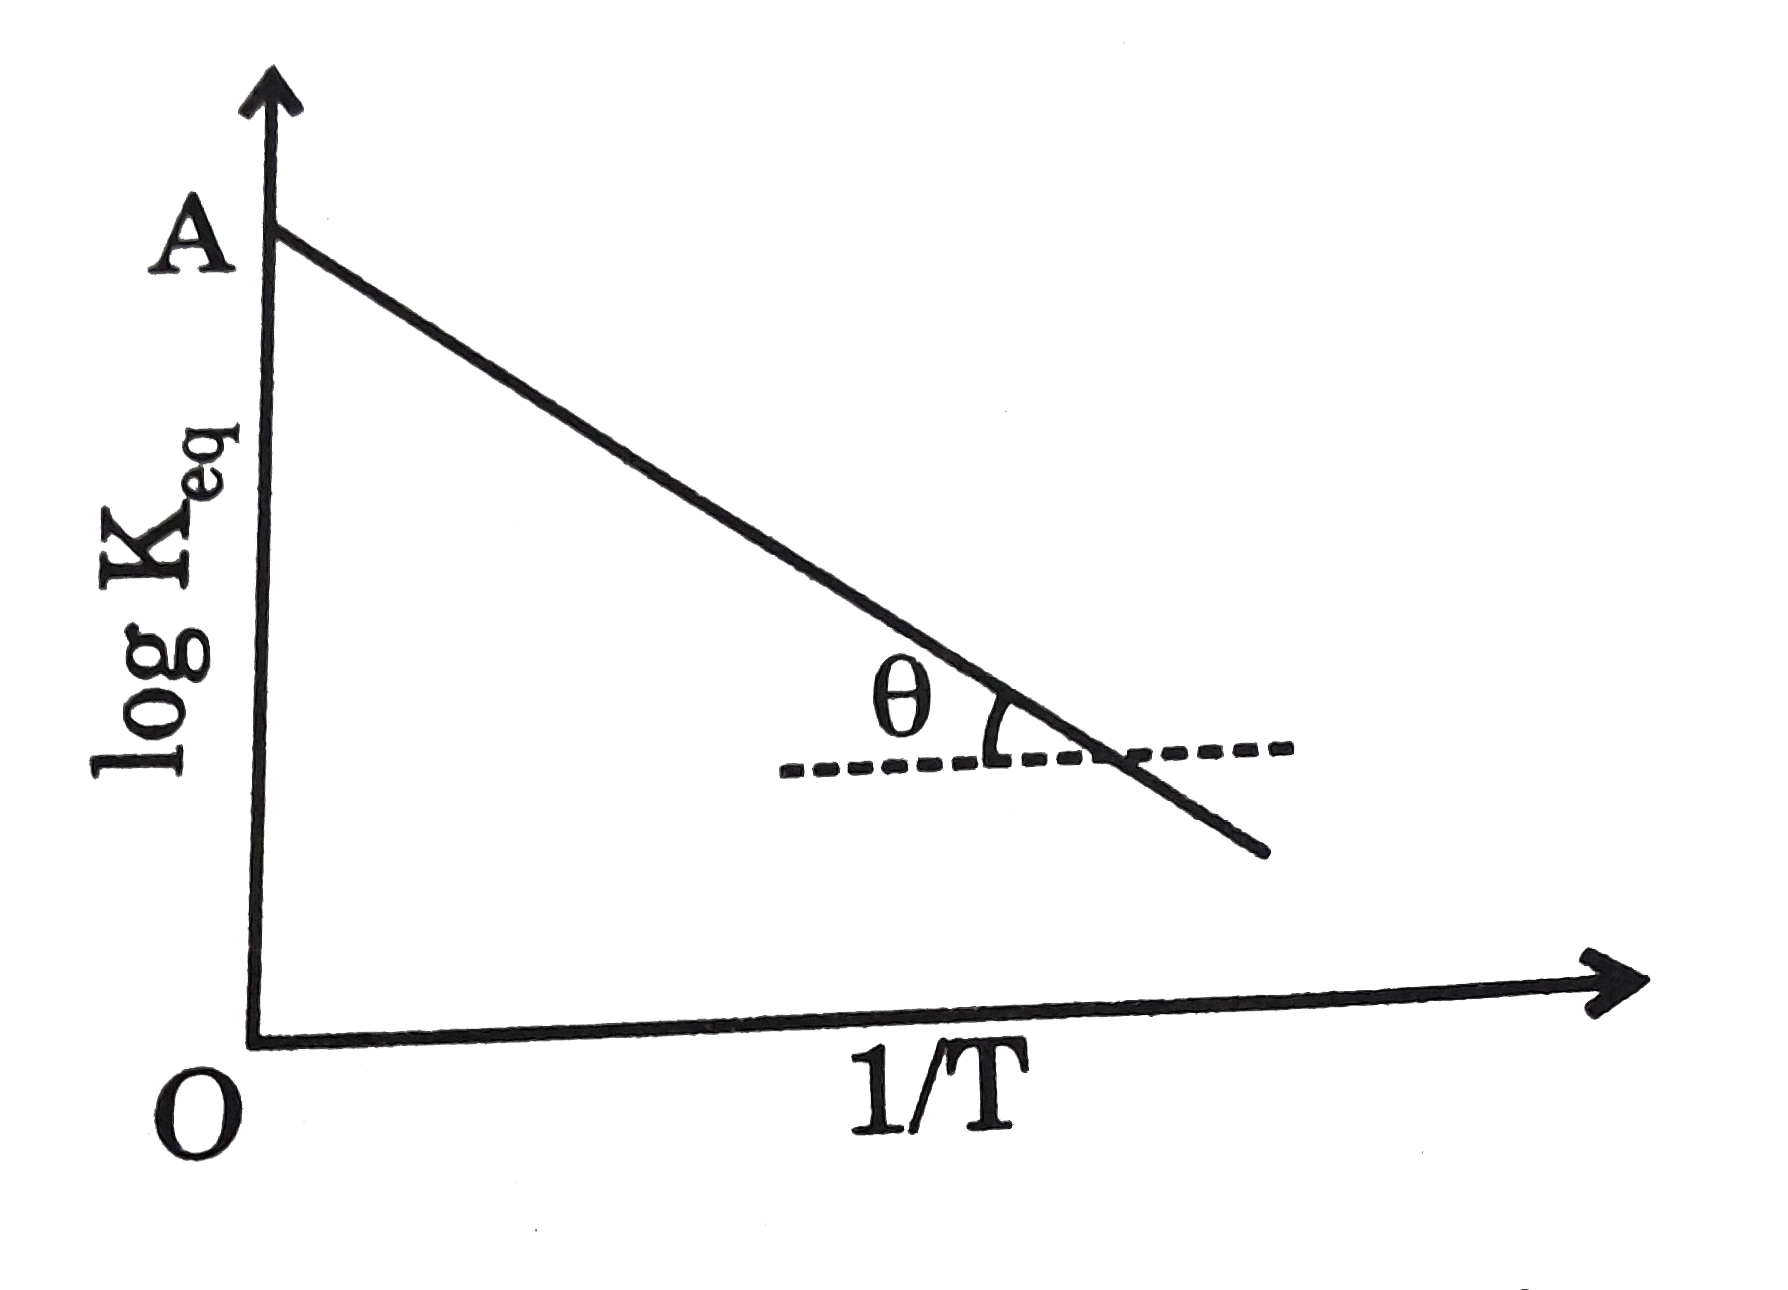
View SolutionFor a hypothetical reaction: `A(g) +B(g) hArr C(g) +D(g)` a graph between log `K_(eq)` and `T^(-)` is striaght line as follows, where `theta = tan^(-1) 0.5` and `OA = 1.0` (S.I. units) Assuming `DeltaH^(@)` is independent of temperature, the equilibrium constant at 298 K will be:
View SolutionWhich graph will show equilibrium, `R = P` ?
View Solution
Chemical Equilibrium questions and complete solutions for chapter GRAPHICAL INTERPRETATION of GRB CHEMISTRY (HINGLISH) of Class 12
All Exercises from GRB PUBLICATION Class 12 CHEMISTRY GRAPHICAL INTERPRETATION
- A. Thermodynamics
- Atomic Sturcture
- B. Gaseous State
- C. Atomic Sturcture
- Chemical Equilibrium
- Chemical Kinetics
- Comprehension
- Comprehension 1
- Comprehension 10
- Comprehension 11
- Comprehension 12
- Comprehension 13
- Comprehension 14
- Comprehension 15
- Comprehension 16
- Comprehension 17
- Comprehension 18
- Comprehension 19
- Comprehension 2
- Comprehension 20
- Comprehension 21
- Comprehension 22
- Comprehension 23
- Comprehension 24
- Comprehension 25
- Comprehension 26
- Comprehension 27
- Comprehension 28
- Comprehension 29
- Comprehension 3
- Comprehension 4
- Comprehension 5
- Comprehension 6
- Comprehension 7
- Comprehension 8
- Comprehension 9
- D. Liquid Solutions
- E. Surface Chemistry
- Electrochemistry
- F. Ionic Equilibrium
- G. Chemical Equilibrium
- Gaseous State
- H. Chemical Kinetics
- I.Electrochemistry
- Ionic Equilibrium
- Liquid Solutions
- Match The Column Type
- Multiple Objective Type
- Subjective Type
- Surface Chemistry
- Thermodynamics