Complete Solutions to Multiple Objective Type of chapter GRAPHICAL INTERPRETATION of Class 12 book with complete answers and questions
| Class 12 | CHEMISTRY |
| Chapter | GRAPHICAL INTERPRETATION |
| GRB PUBLICATION | Multiple Objective Type |
| Number Of Questions | 68 |
| Academic Year | 2023-24 |
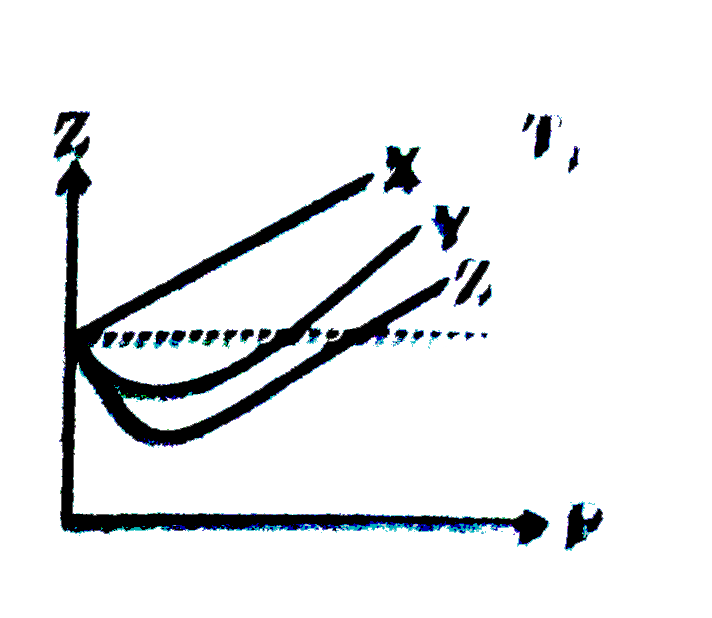
Z vs P is plotted for 1 mole of three different gases X,Y and Z at temperature `T_(1)`. Then which of the following may be correct if the above plot is made for 1 mole of each gas at `T_(2)(T_(2) gt T_(1))` ?
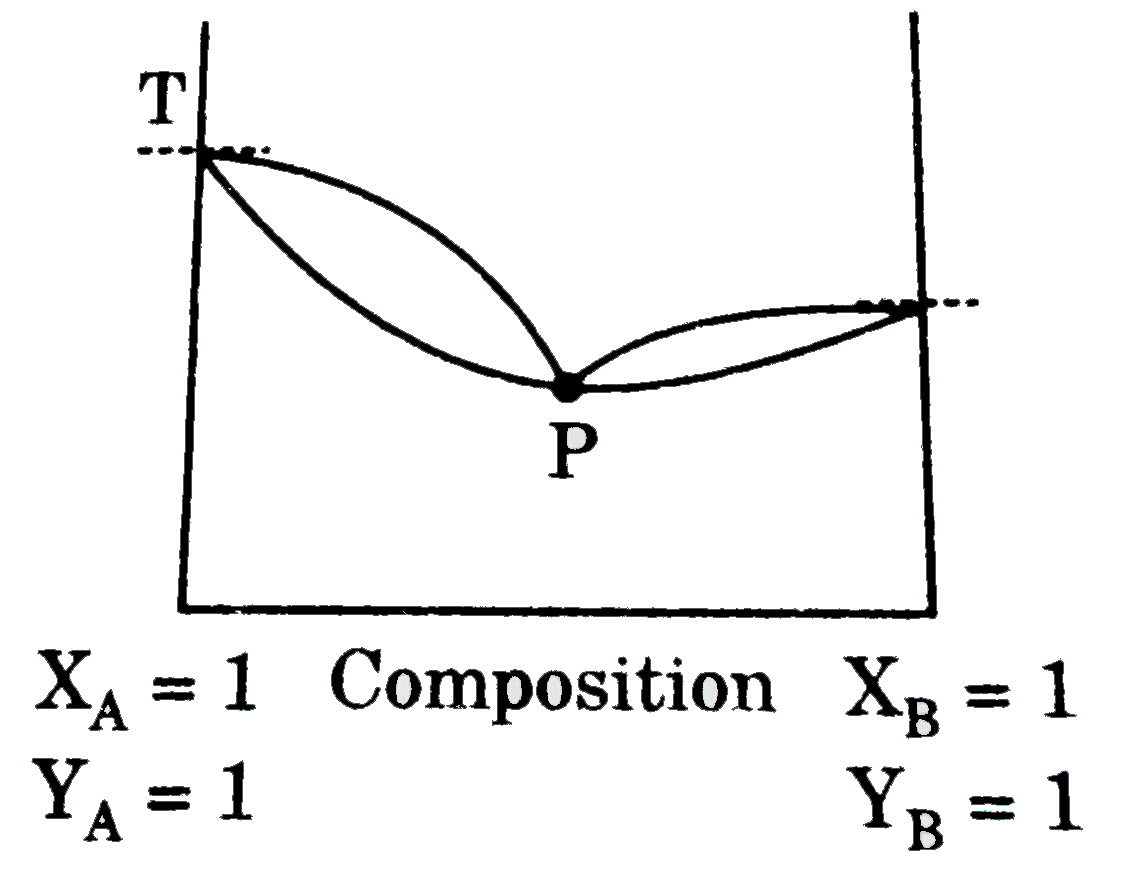
View SolutionA liqud mixture of two volatile liquids has composition corresponding to point P in the temperature vs composition graph and is subjected to distillation from the composition P. Which of the following statements is incorrect?
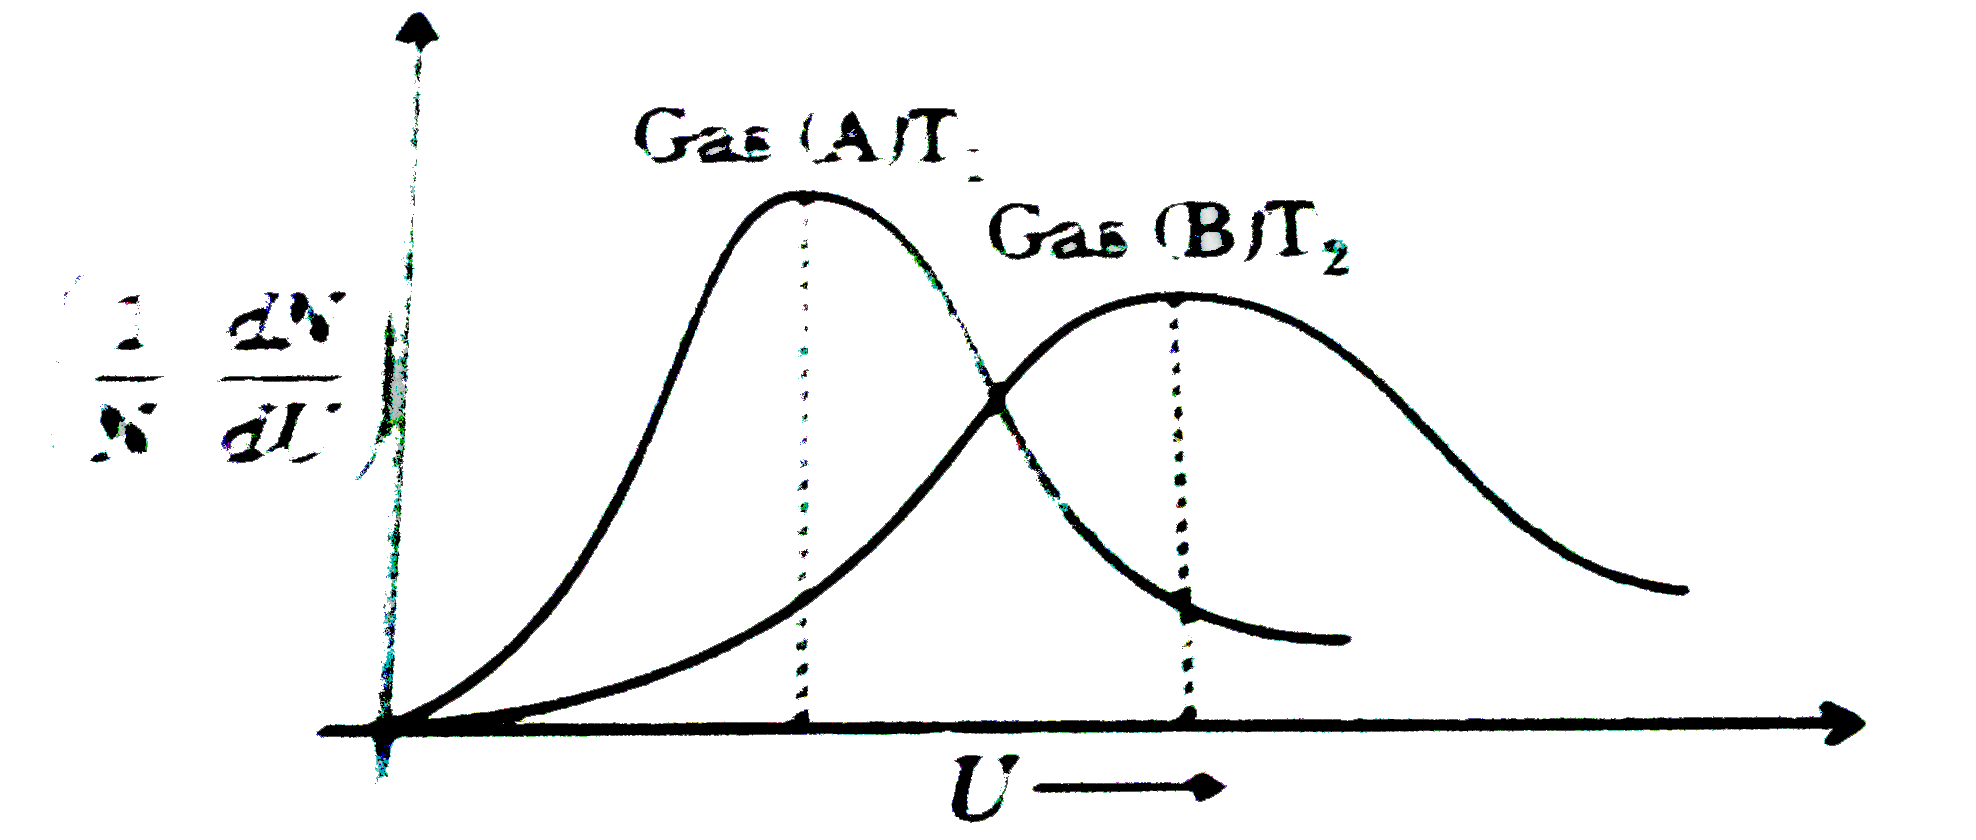
View SolutionFor the following graph, drawn from two different samples of gases at two different temperatures `T_(1) and T_(2)`, which of the following statements is/are necessarily true?
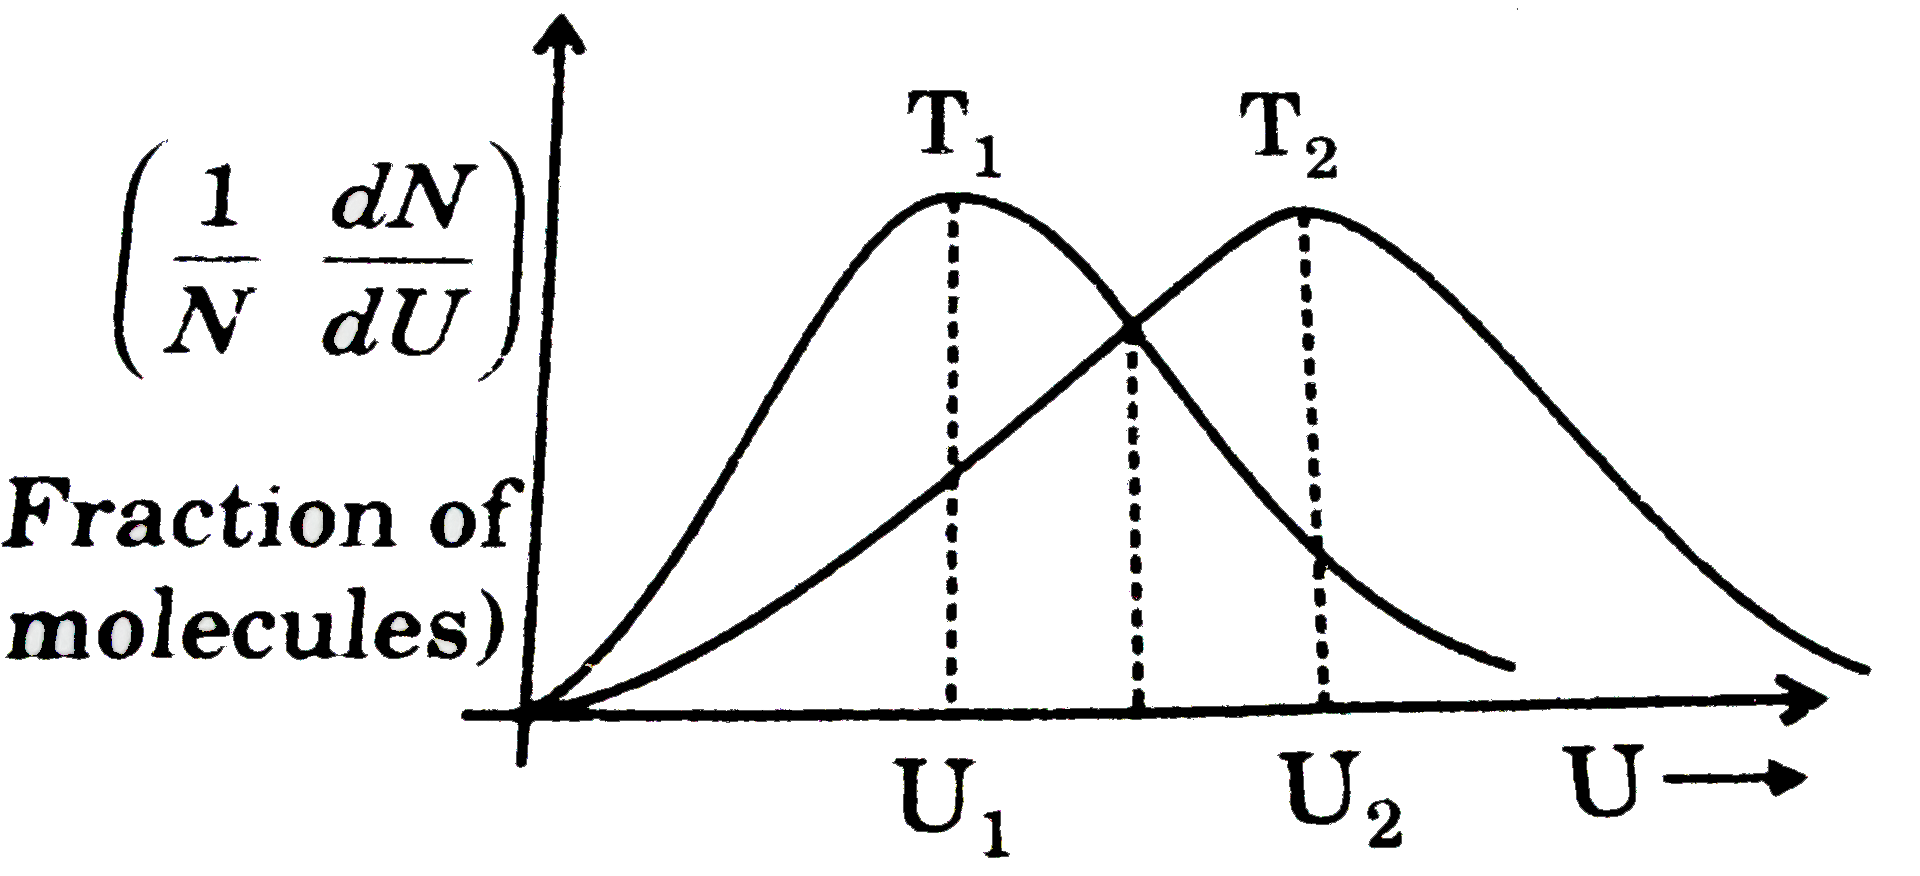
View SolutionIn the above Maxwellian plot at two different temperatures which of the following statements may be true?
View SolutionFigure displays the plot of the compression factor Z versus P for a few gases which of the following statements is/are correct for a van der Waals' gas?
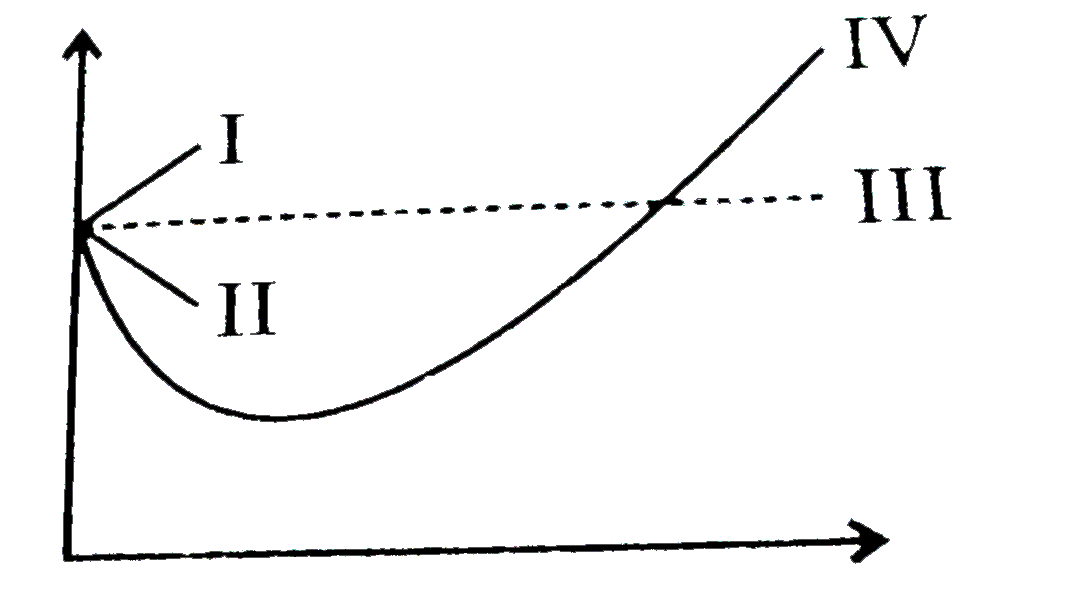
View SolutionFor gaseous state at constant temperature which of the following plot is correct?
View SolutionTitration curves for 0.1 M solutions of three weak acids `HA_(1),HA_(2) and HA_(3)` with ionization constant `K_(1),K_(2),K_(3)` respectively are plotted as shown in the following figure. Which of the following is/are true.?
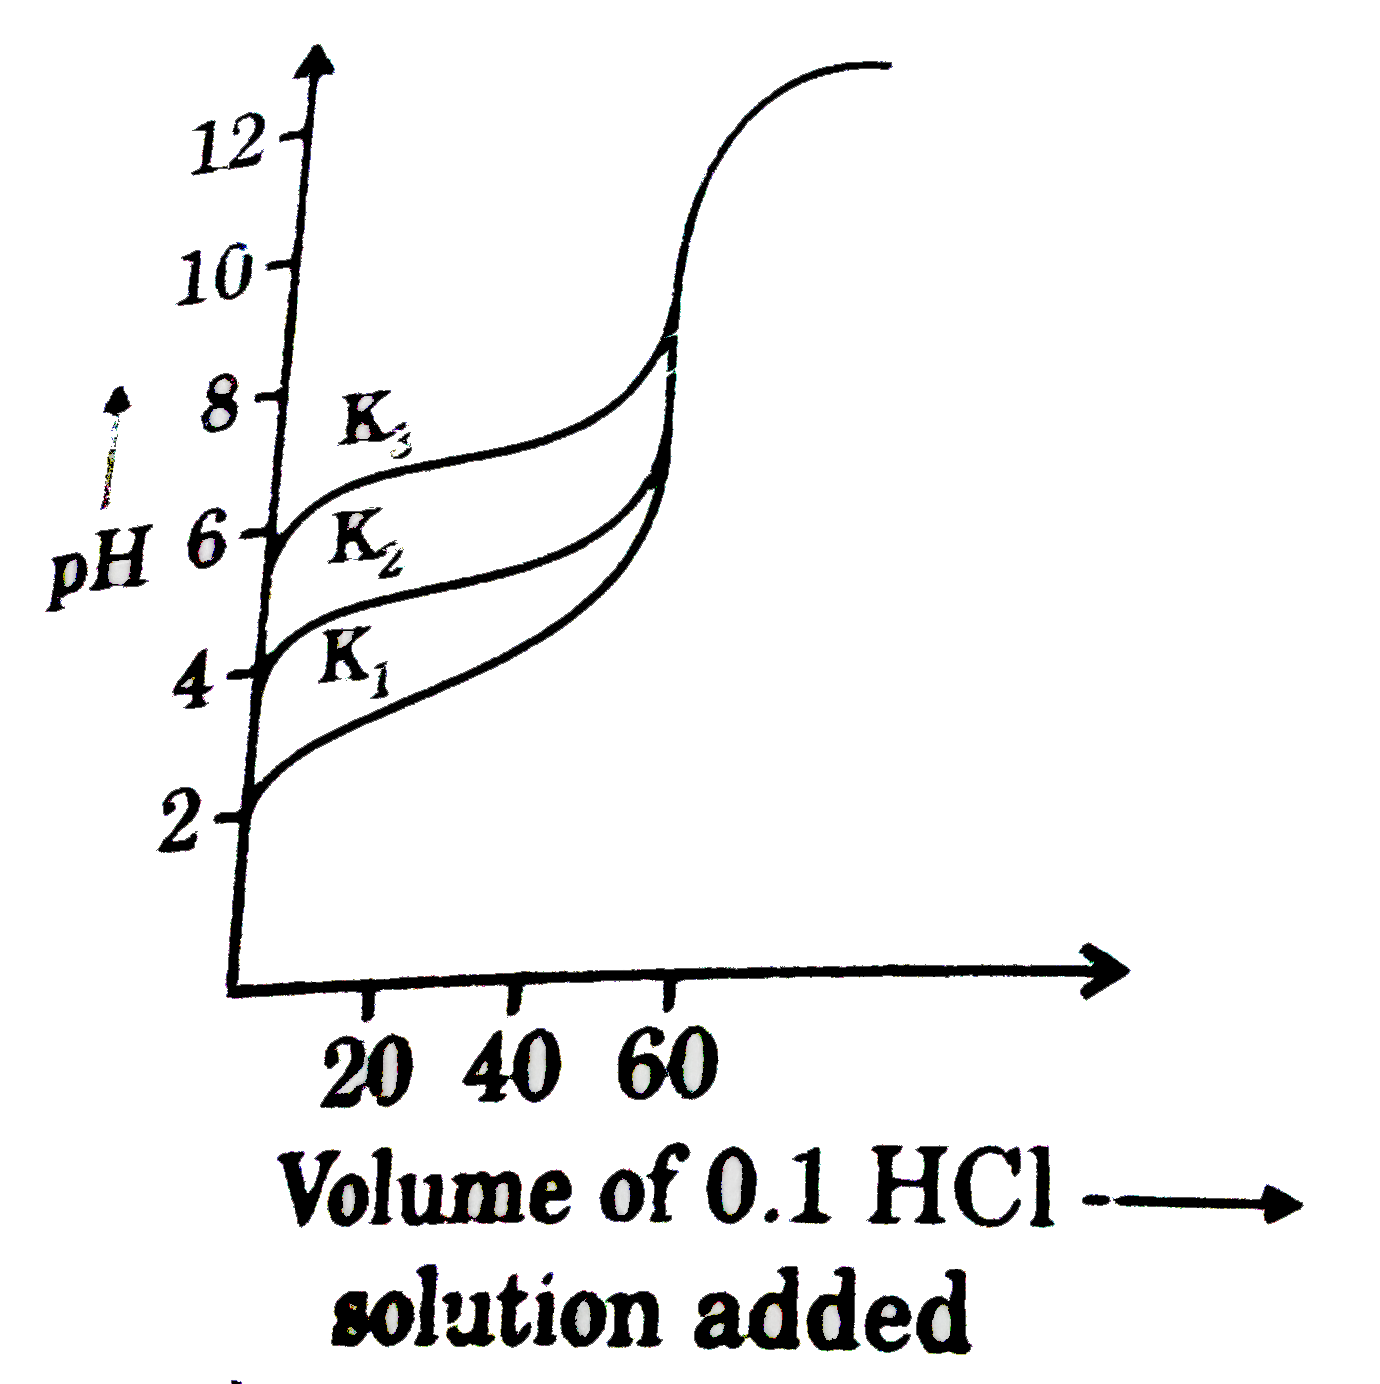
View SolutionWhen weak base solution (50 ml of 0.1 `NH_(4)OH`) is titrated with strong acid 0.1 N HCl, the pH of solution initially decreases fast and then decreases slowly till near equivalence point (as shown in the fig.) which of the following is true?

View SolutionWhich one is the correct graph (fig.) for the corresponding acid base titration?
View SolutionA weak acid (or base) is titrated against a strong base (or acid), volume V of strong base (or acid) is plotted against pH of the solution (as shown in fig).The weak electrolyte (i.e., acid or base) could be:
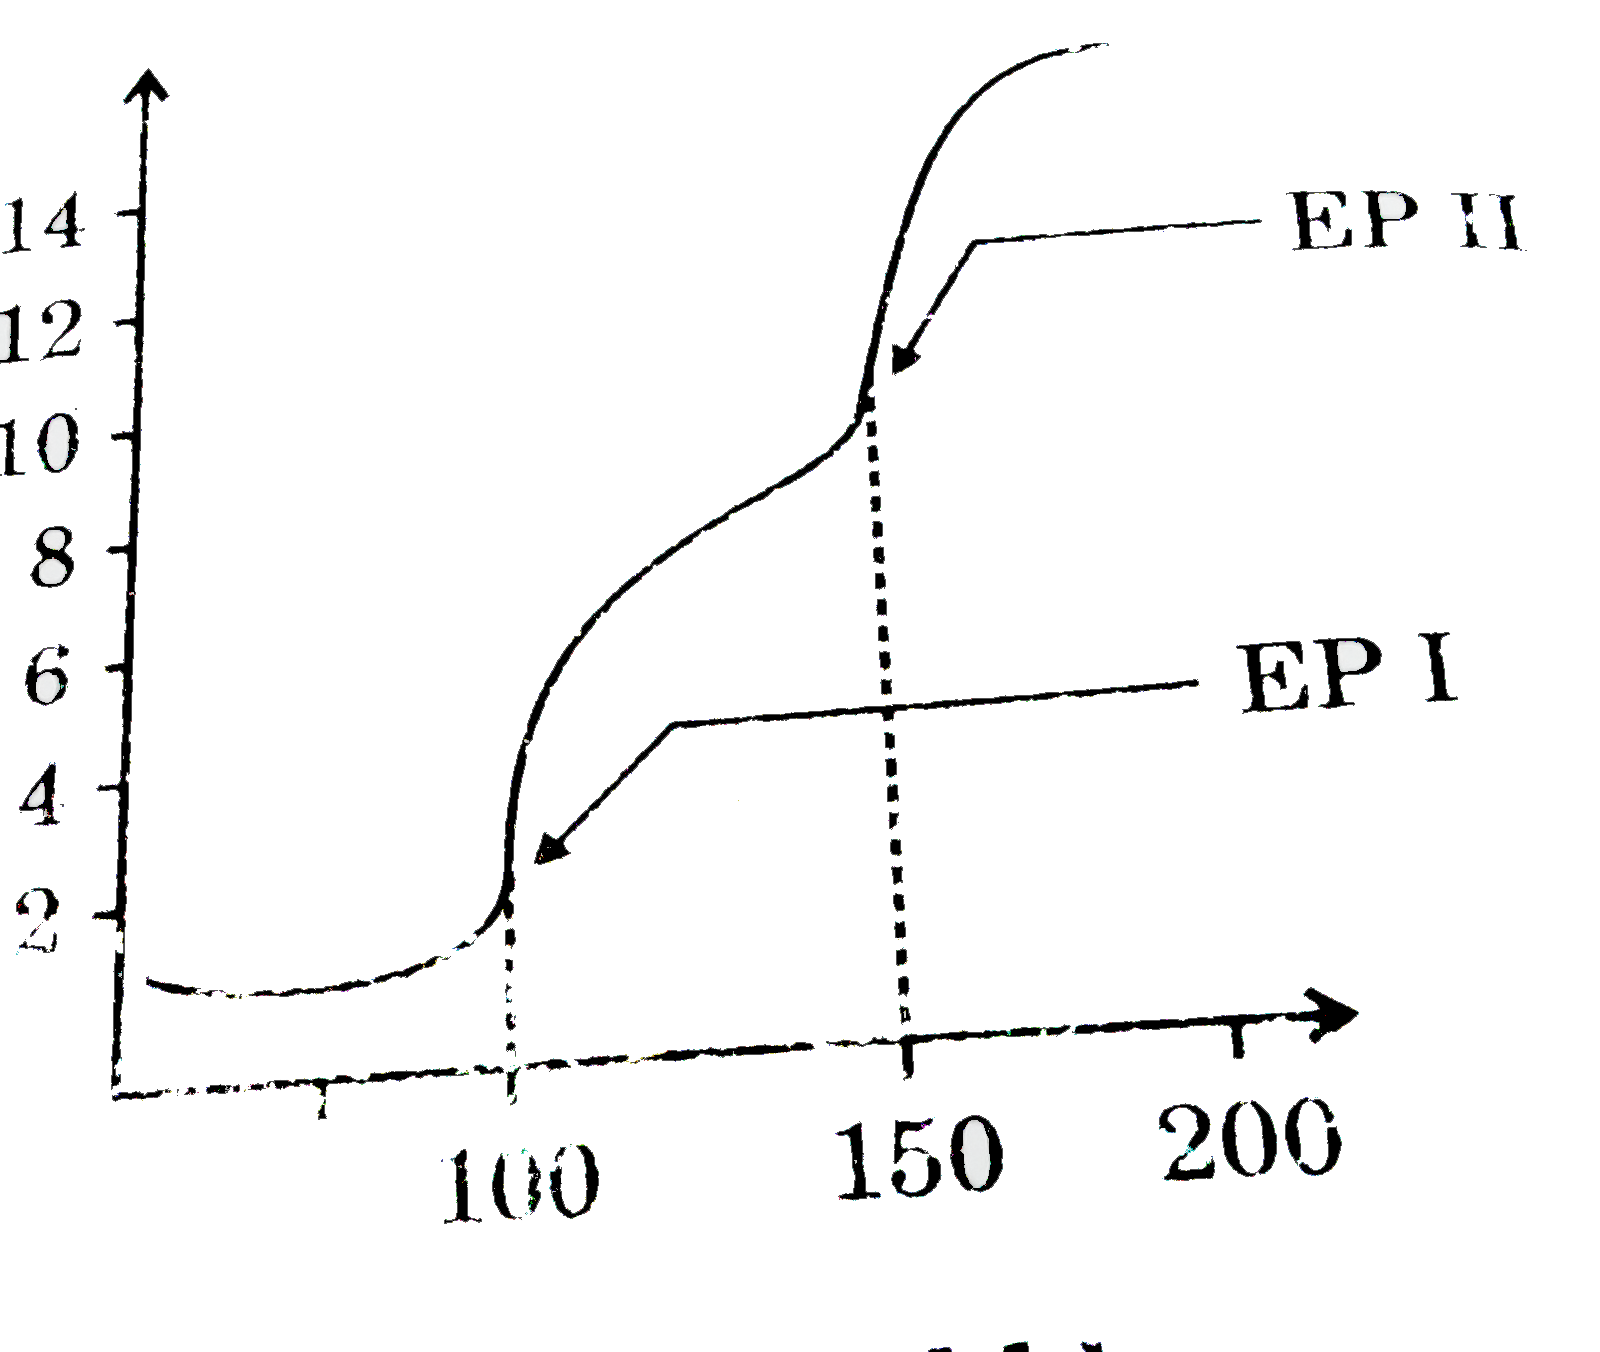
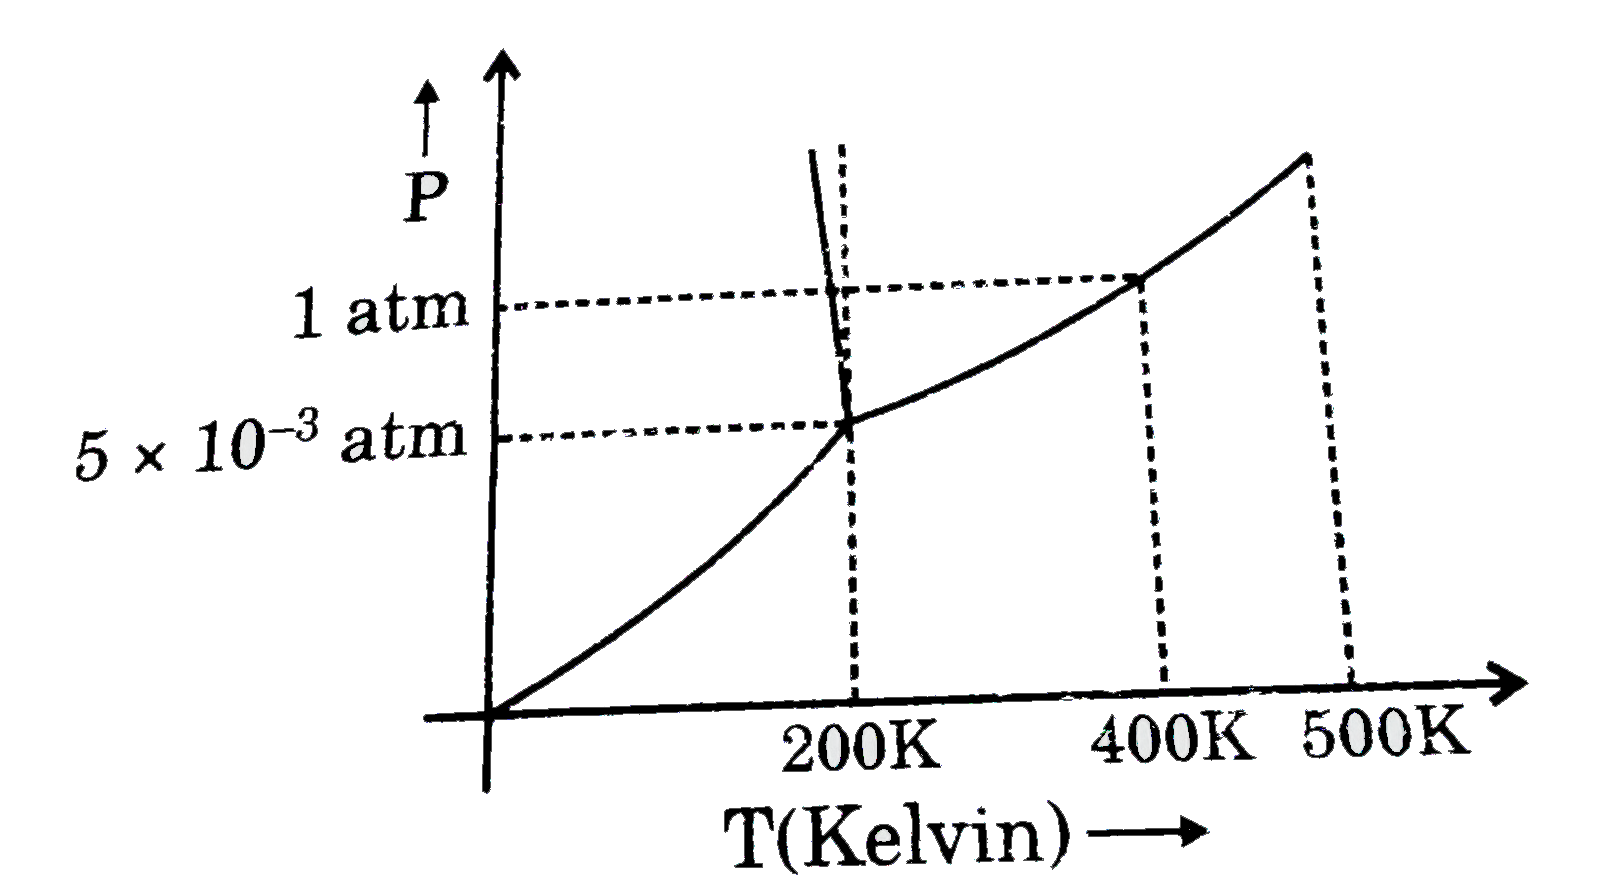
View SolutionFor a general substance A the phase diagram is represented as shown. Identify the option (s) which is/are correct.
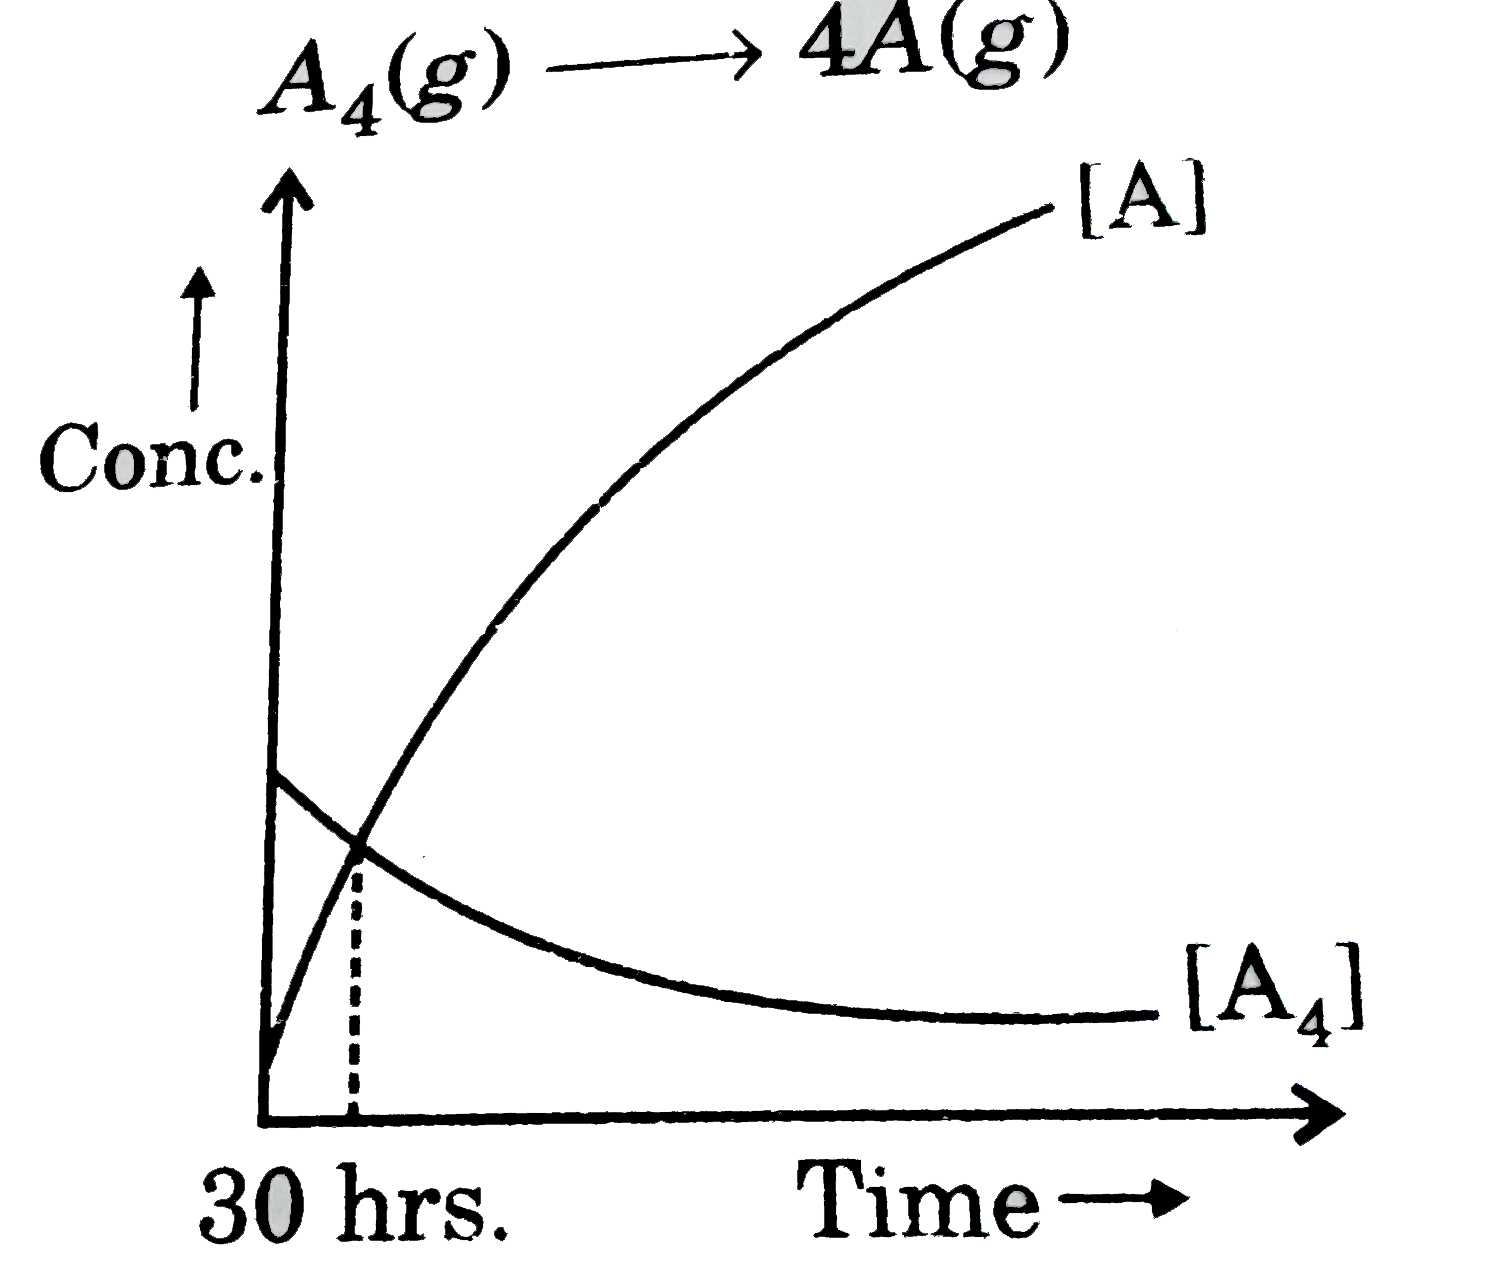
View SolutionConsider the following first order decomposition and the accompanying concentration-time plot. Which of the following statements regarding the decomposition reaction is/are true?
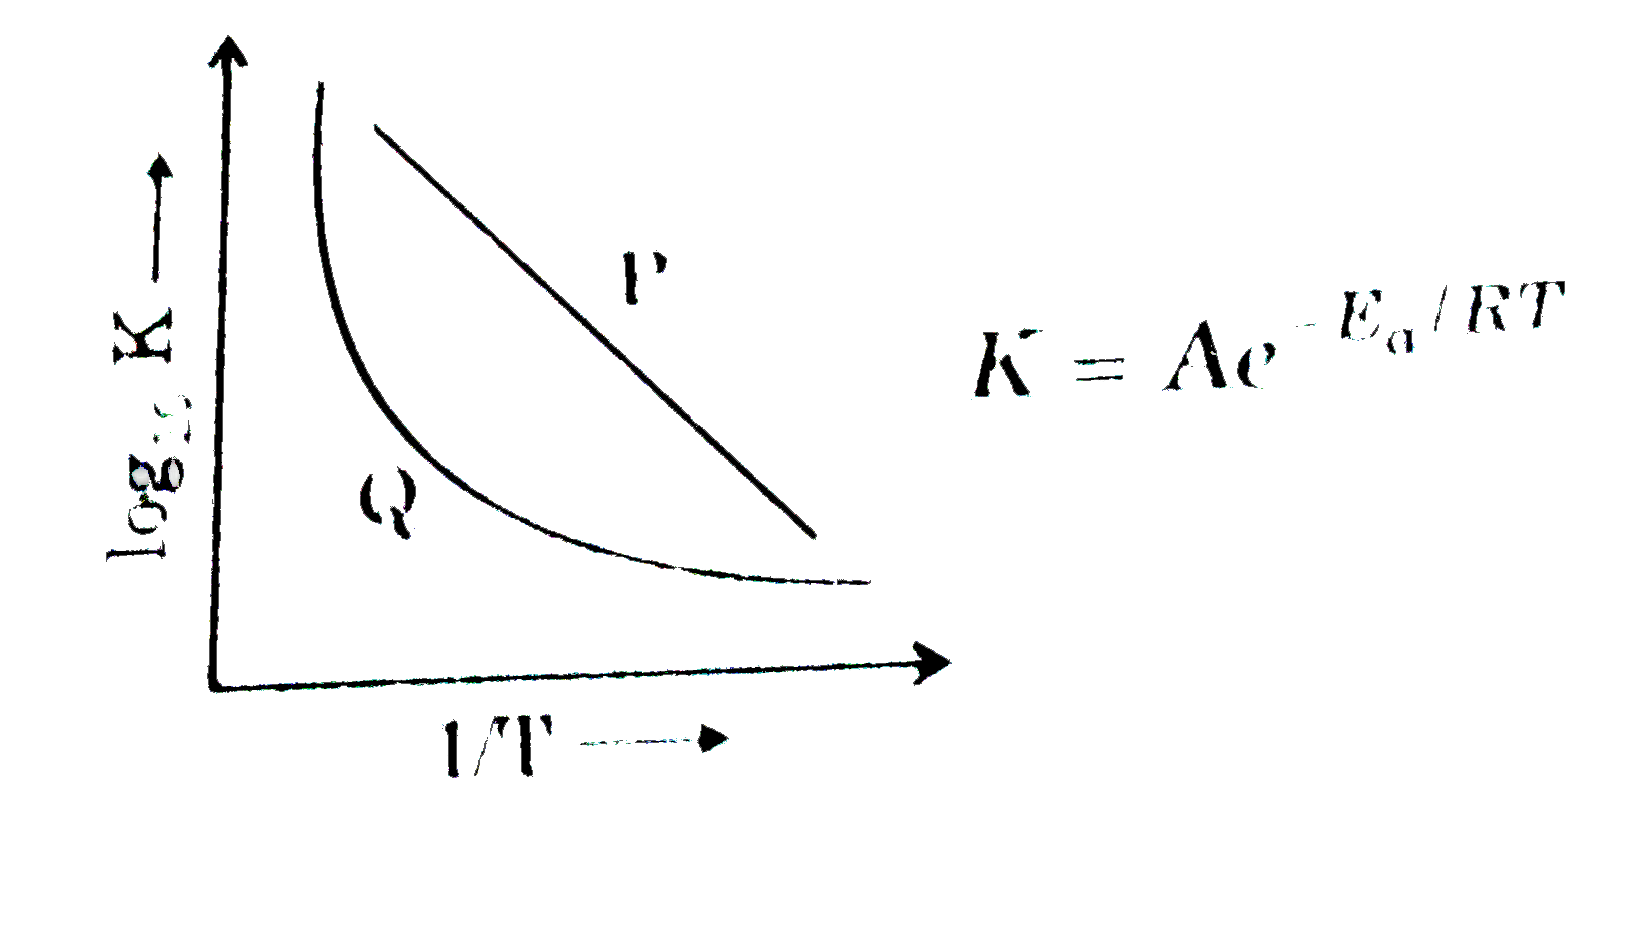
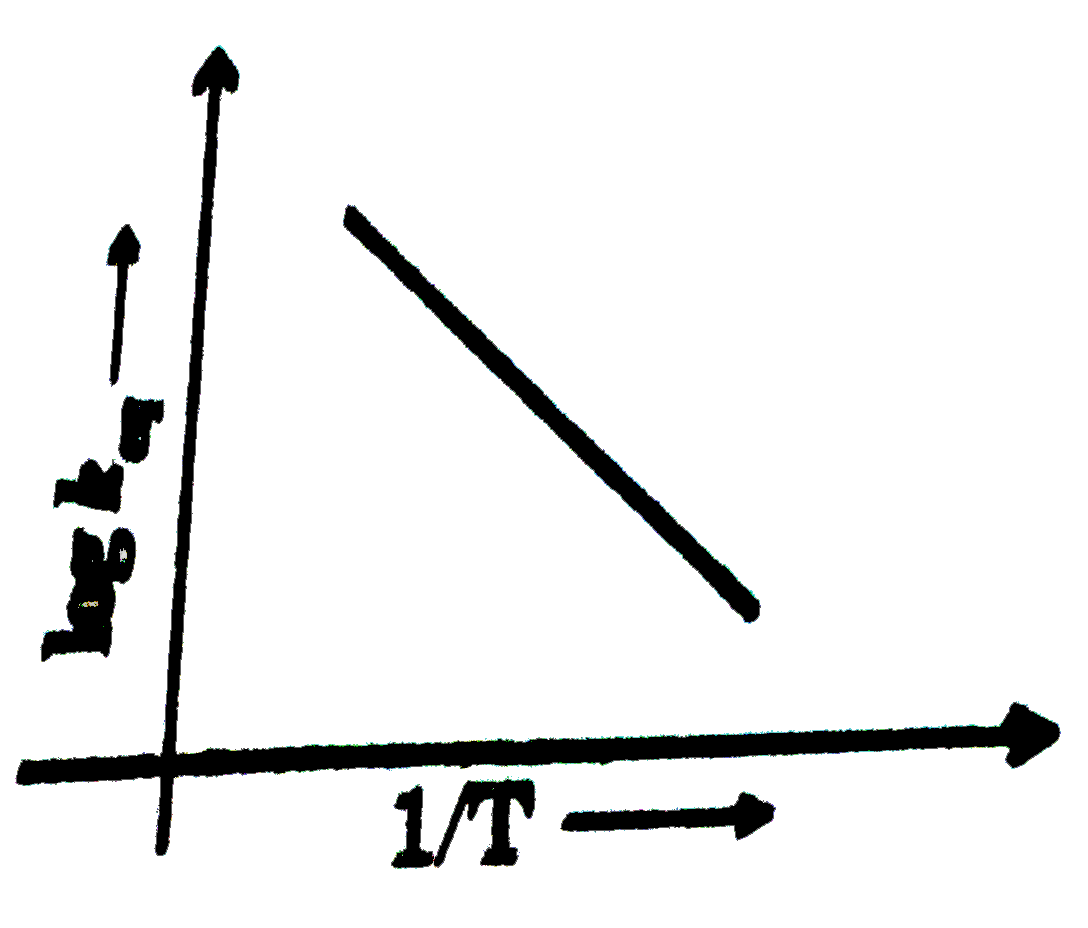
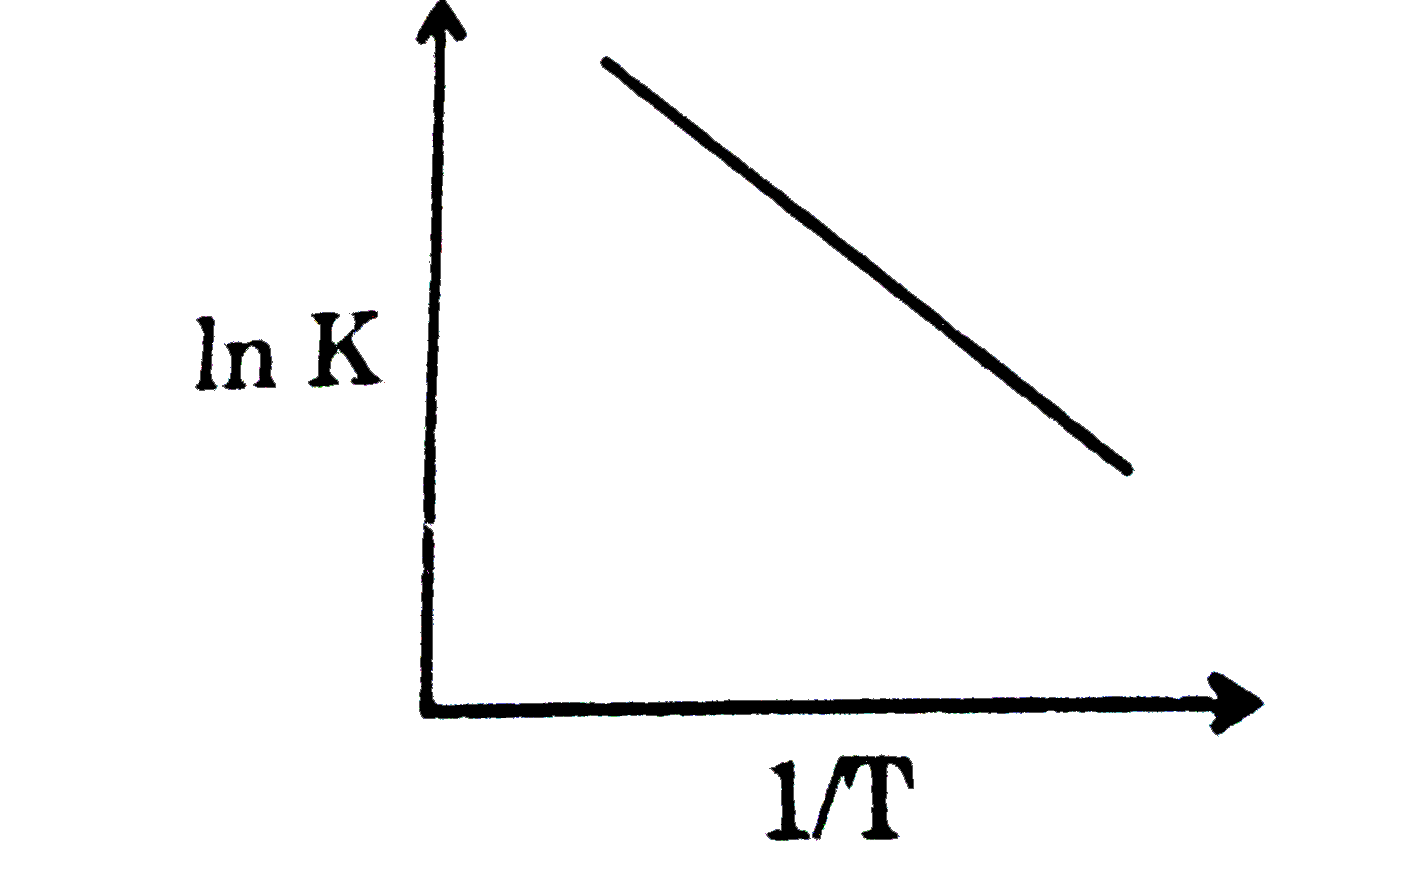
View SolutionWhich of the following statement are true regarding the log K vs `1//T`. Plot shown in the given diagram?
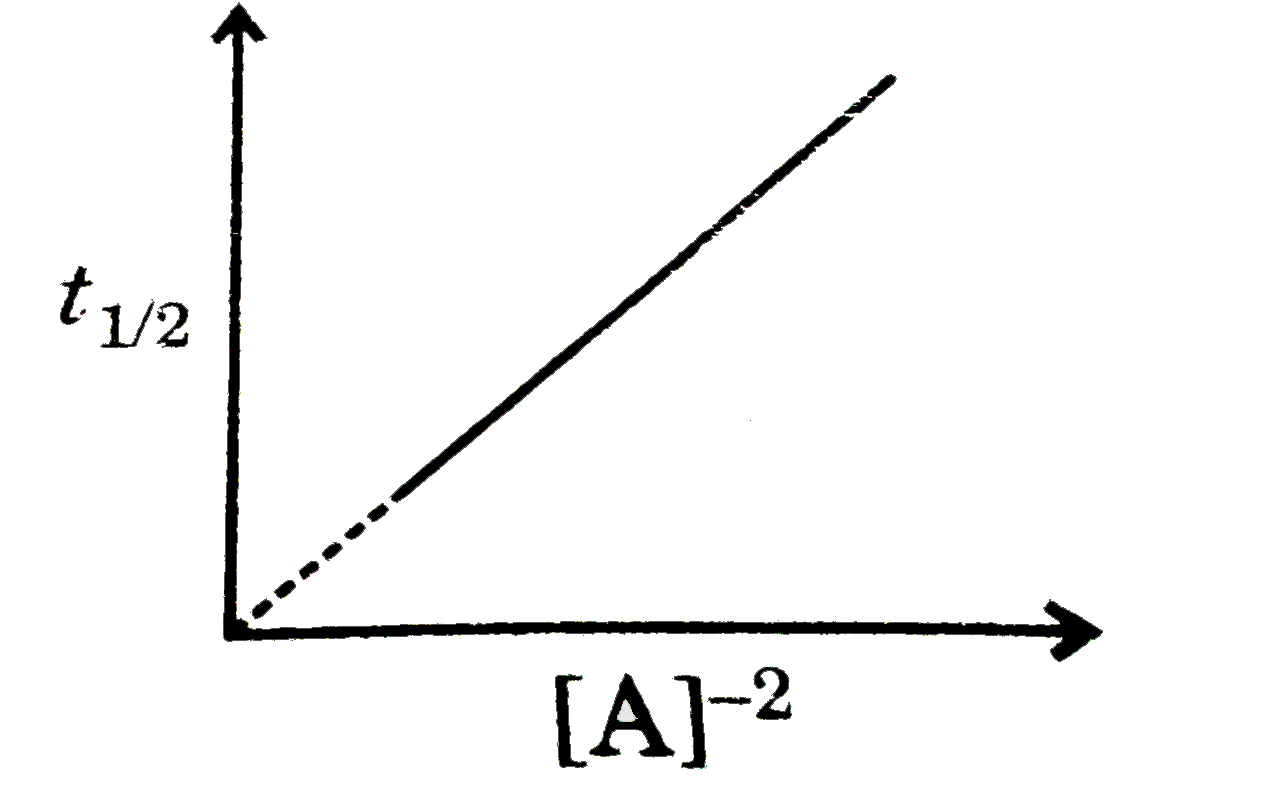
View SolutionFor a second order reaction, plots are made for `(1)/([A])` us time for the reaction, `2A rarr` Product. Pick up the correct sentences.
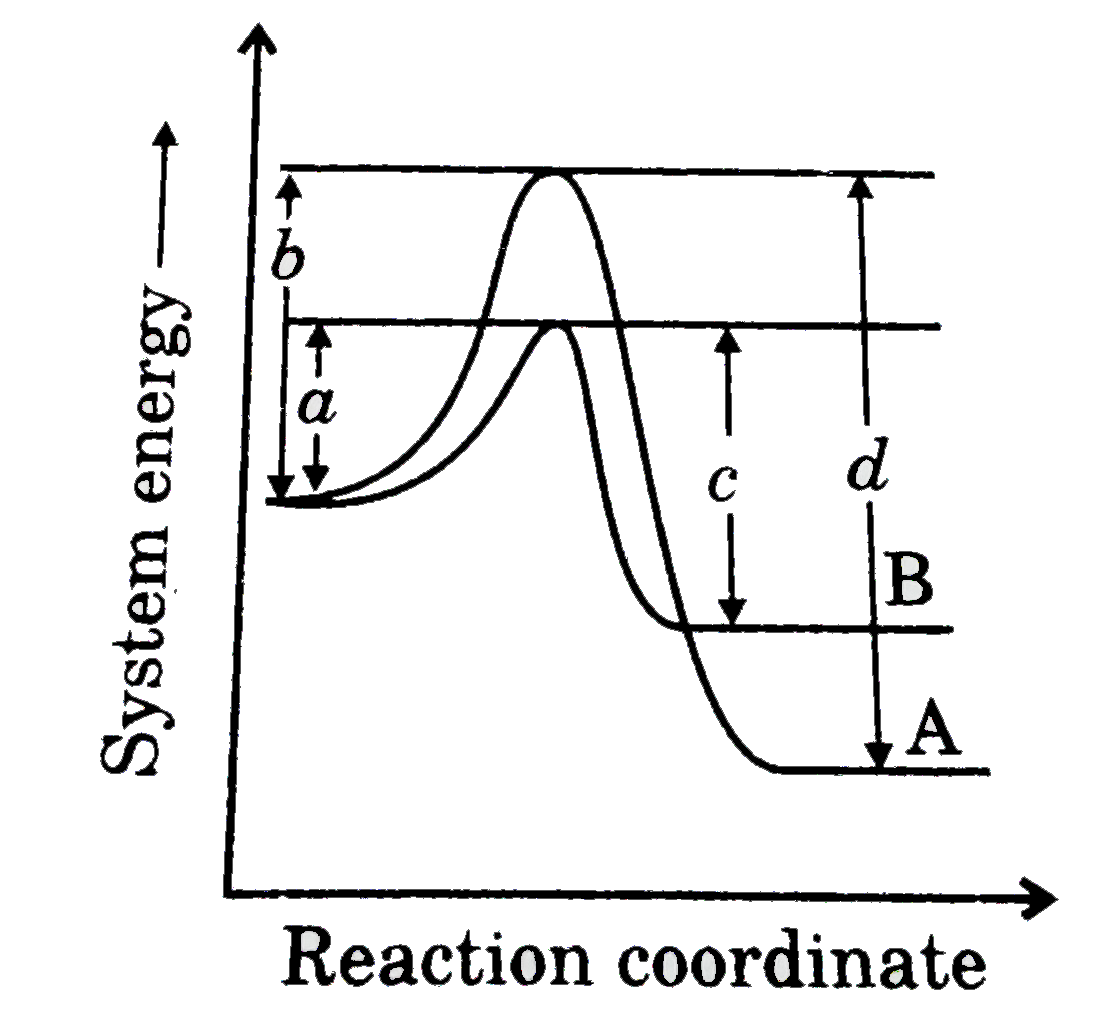
View SolutionConsider the decay of P to A and B by two parallel first order reactions as shown in Fig. Given Which of the following is (are) true ?
View SolutionFor a reaction `2A +B rarr C` following information is known. Identify the options which is/are correct ?
Information-1: When B is taken in very larger amount following graph was obtained.
Information-2: When `B = 1M` and `A = 2M` are mixed and graph of `(1)/([B])` us time is plotted adjoining graph is obtained.
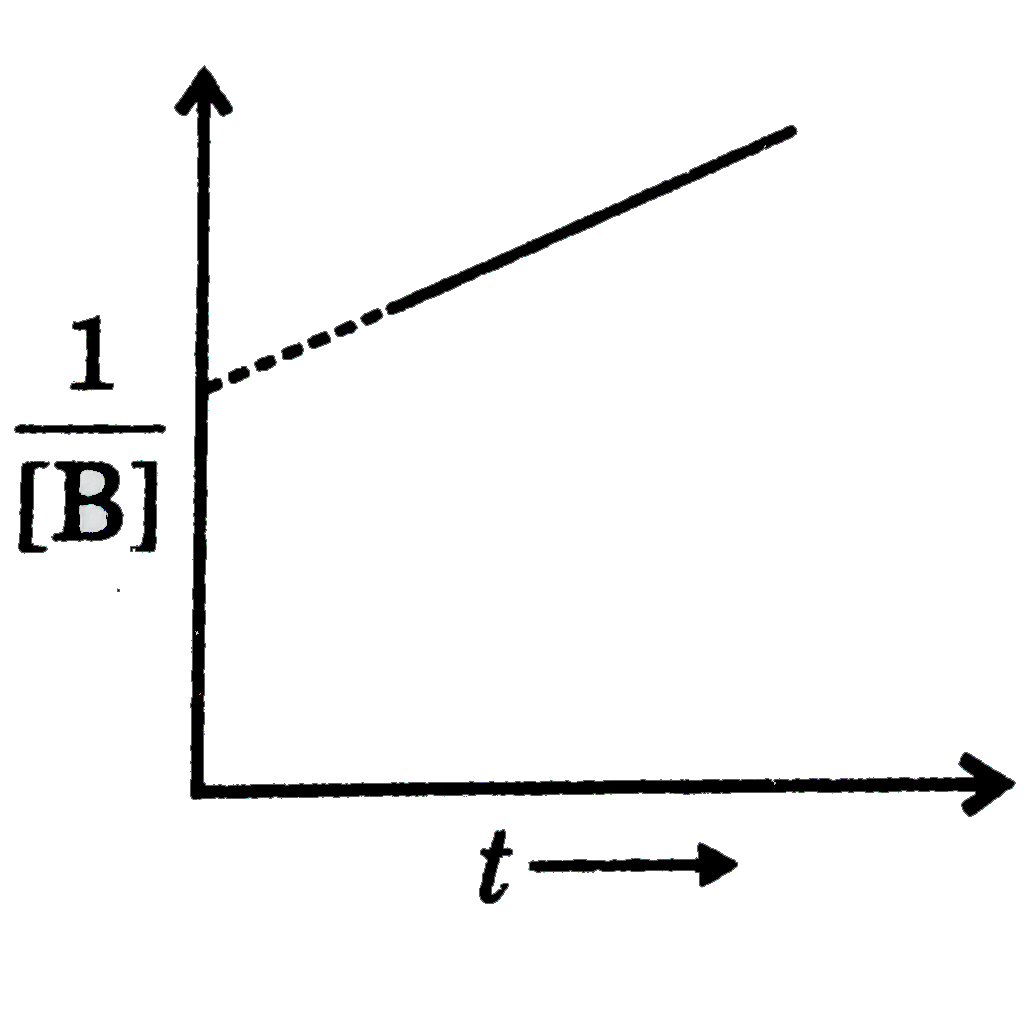
View SolutionIdentify the correct statement (s).
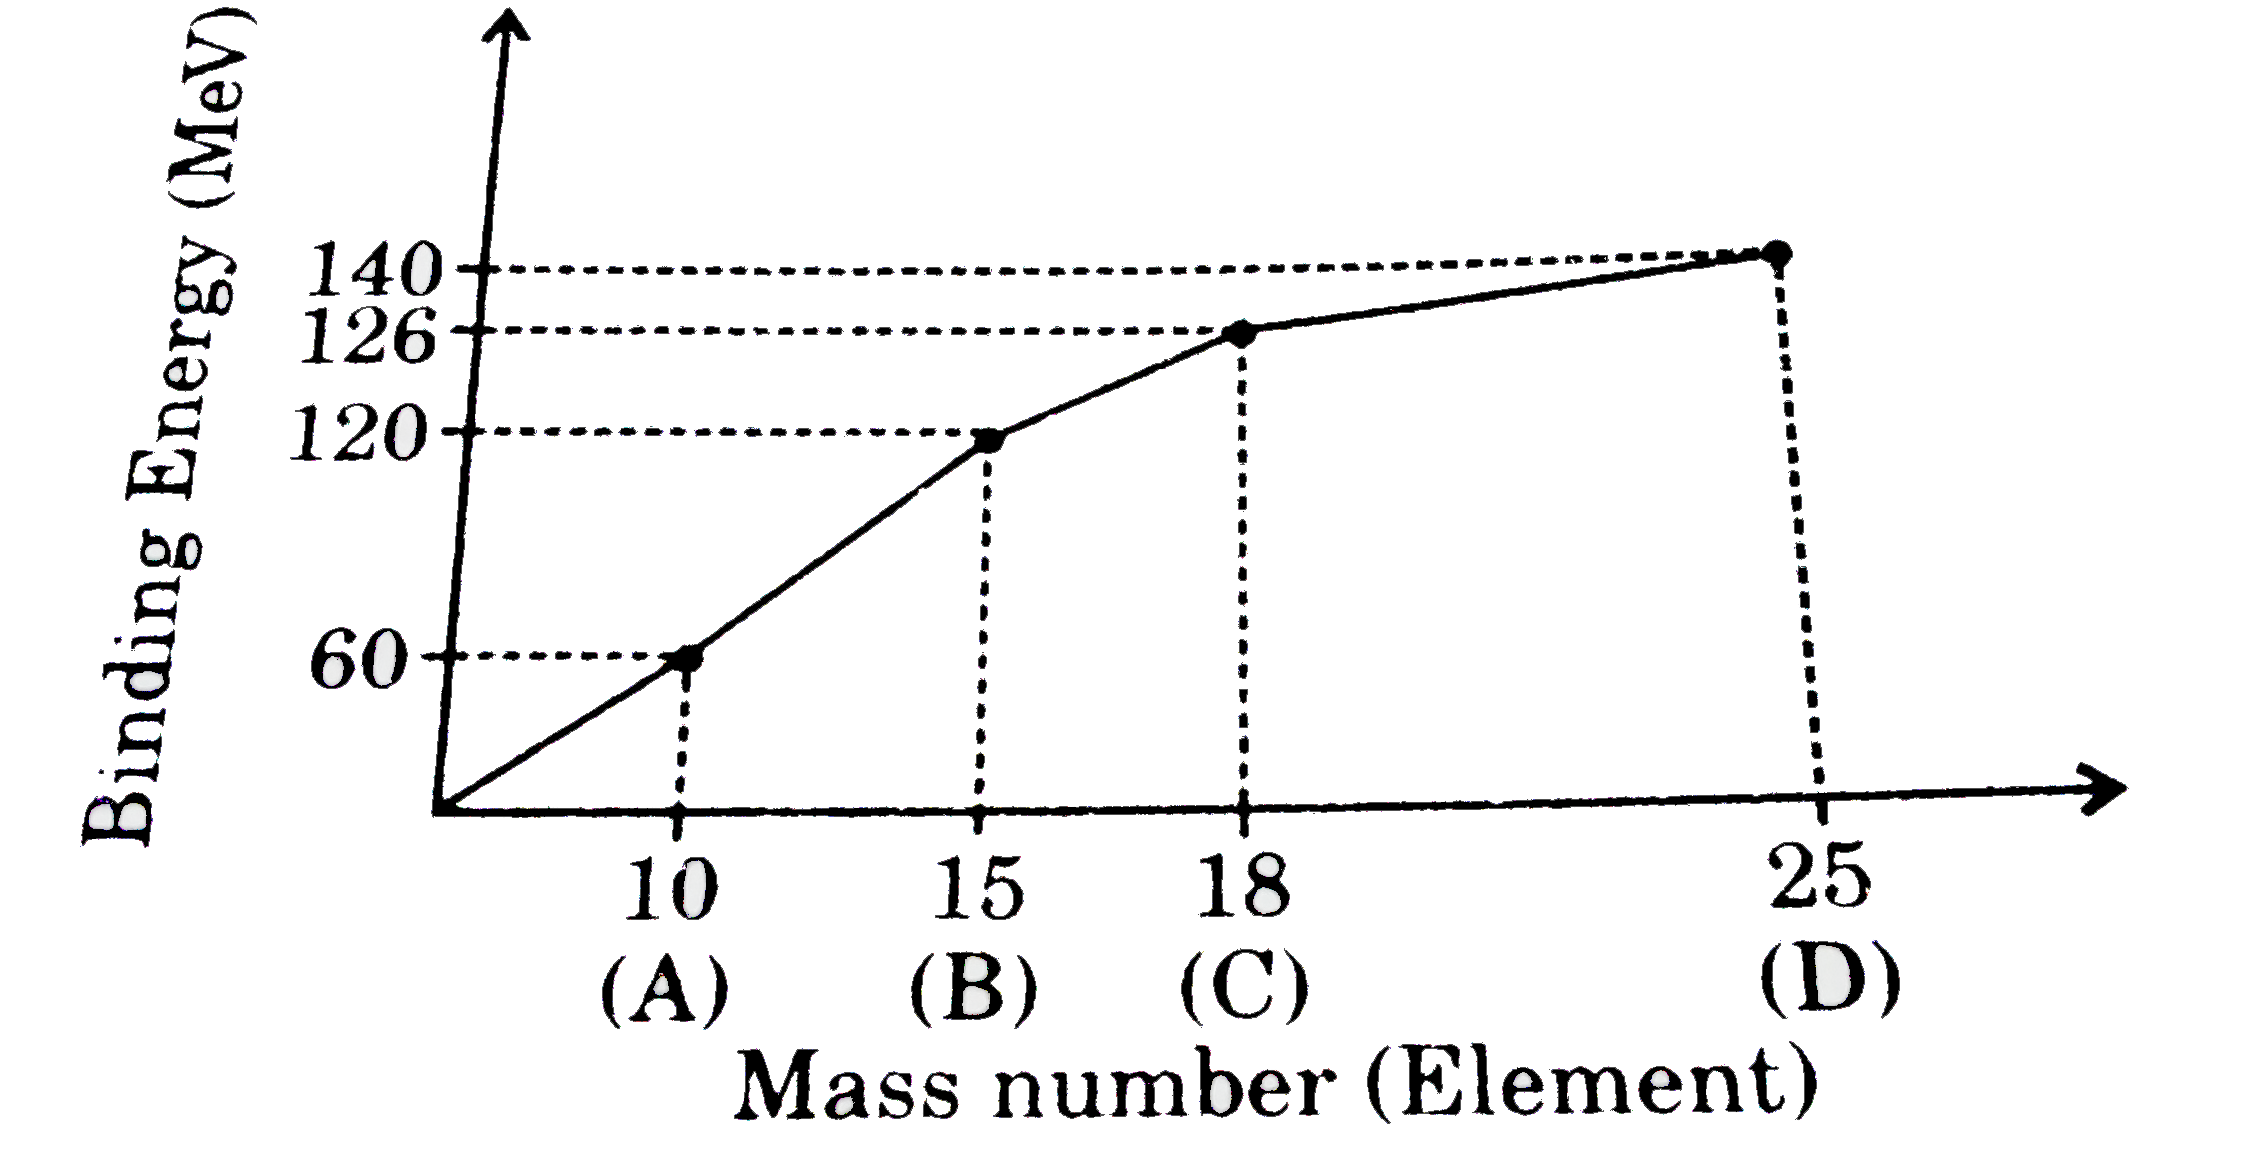
View SolutionFrom the graph of binding energy (B.E.) usmass number plotted as shown, identify the correct option (s). (All the graphs are straight line)
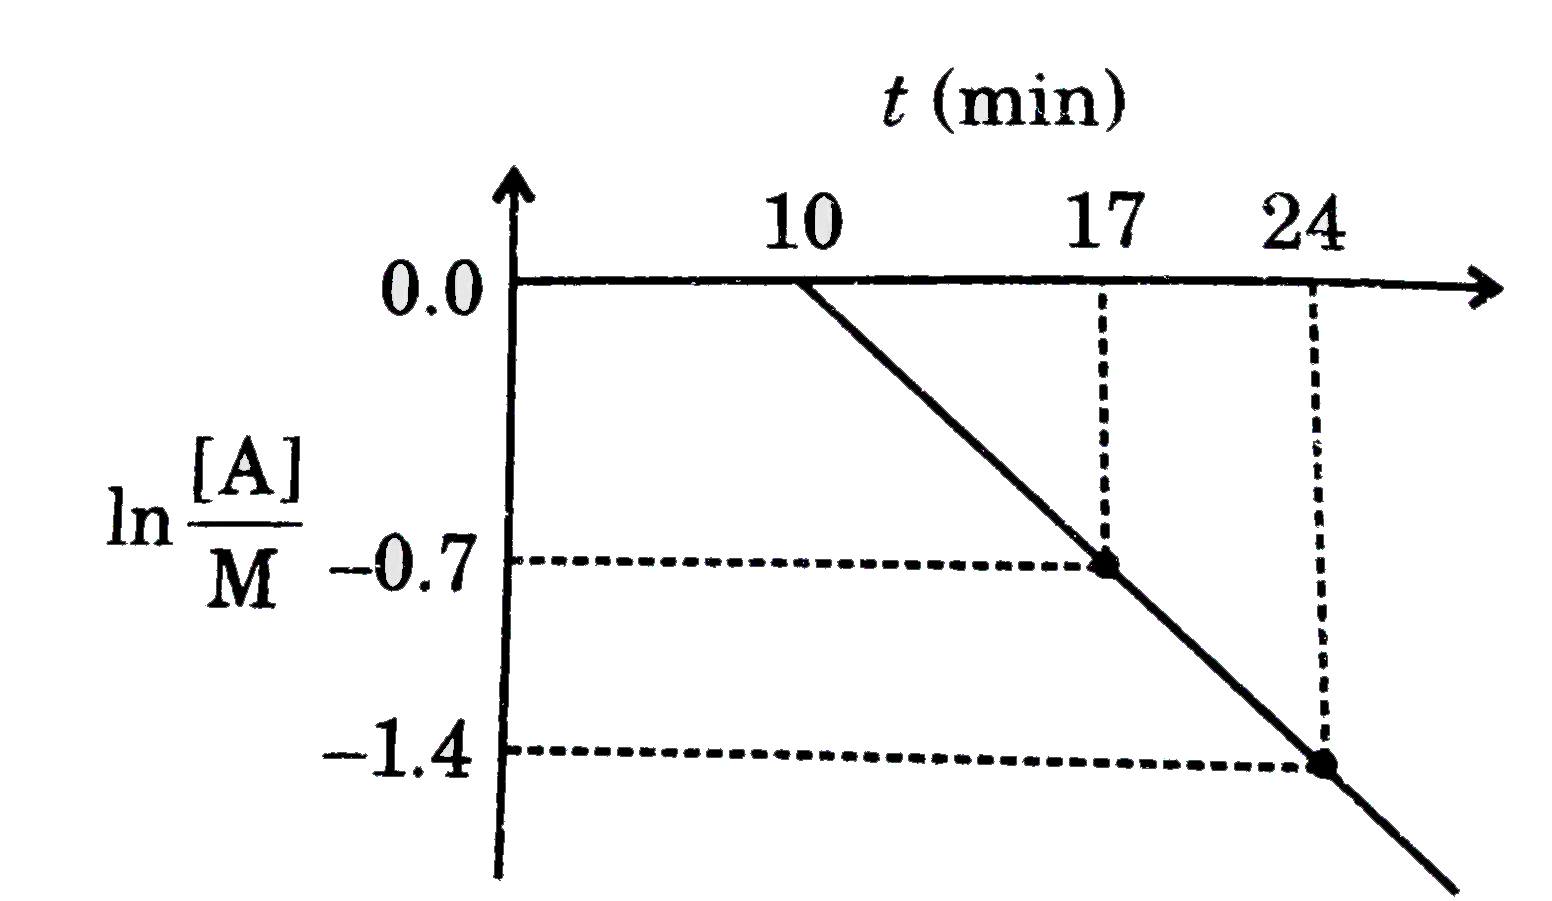
View SolutionThe following graph is experimentally obtained for the reaction : `A rarr 2B`, at `25^(@)C`. The correct statement (s) for the reaction is/are (Given : ln 2 = 0.7)
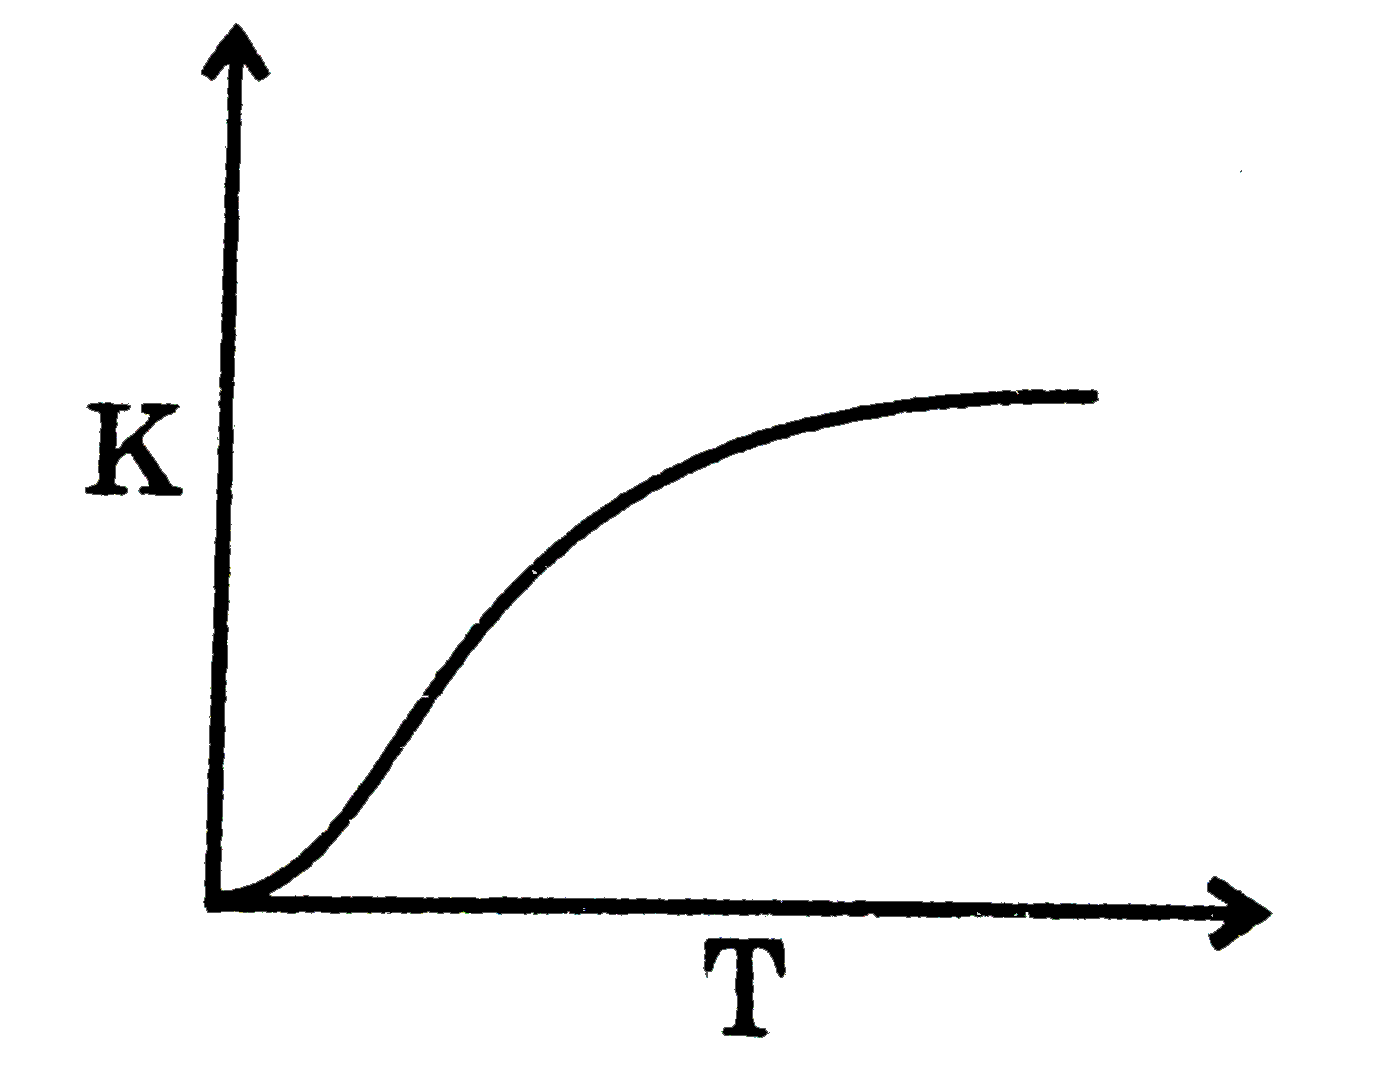
View SolutionGiven plot is valied, for which of the following reaction ?
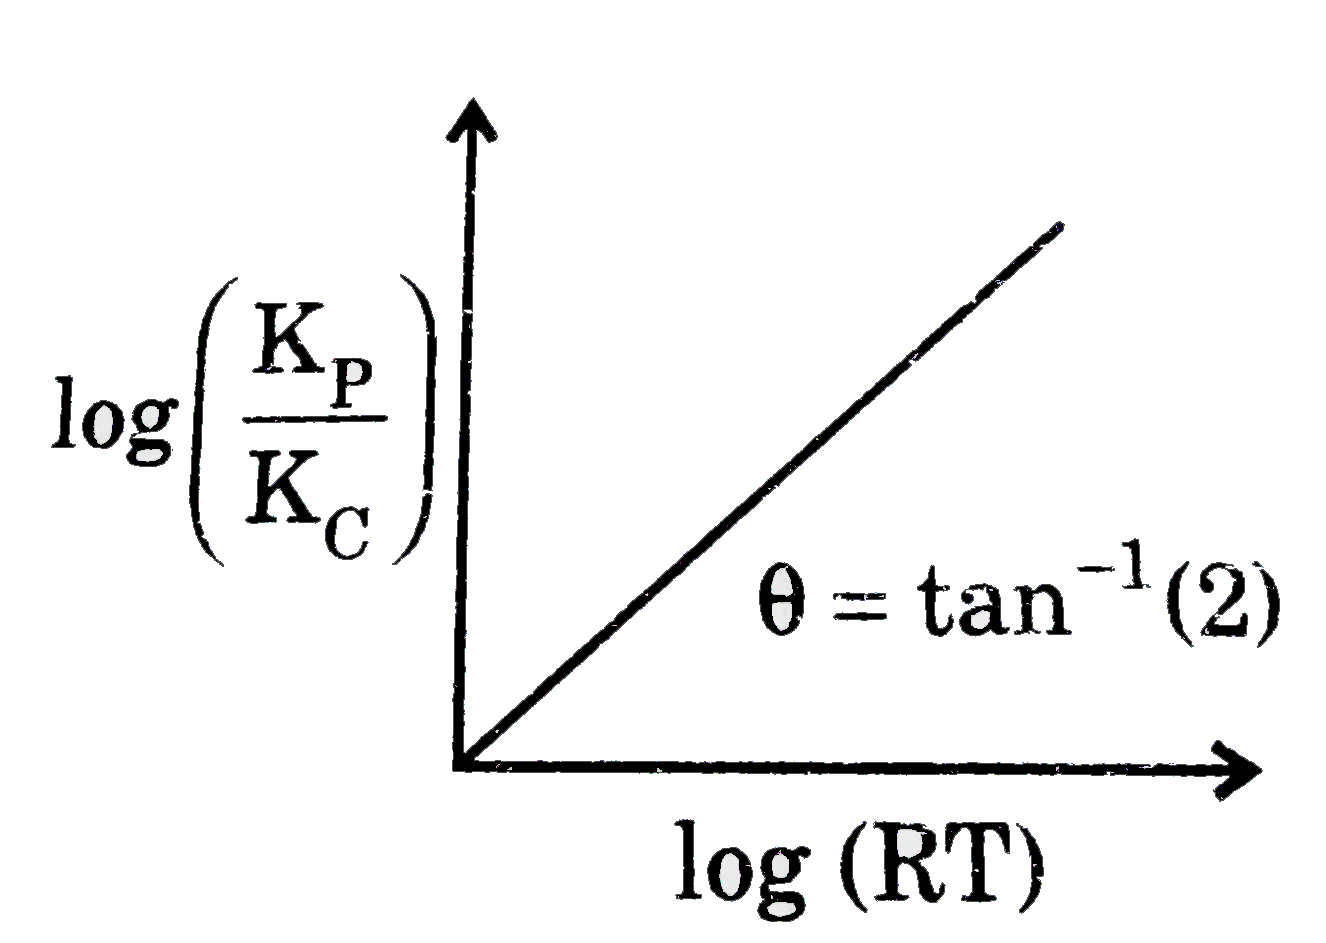
View SolutionIf critical temperature for the real gas is 500 K then the value of :
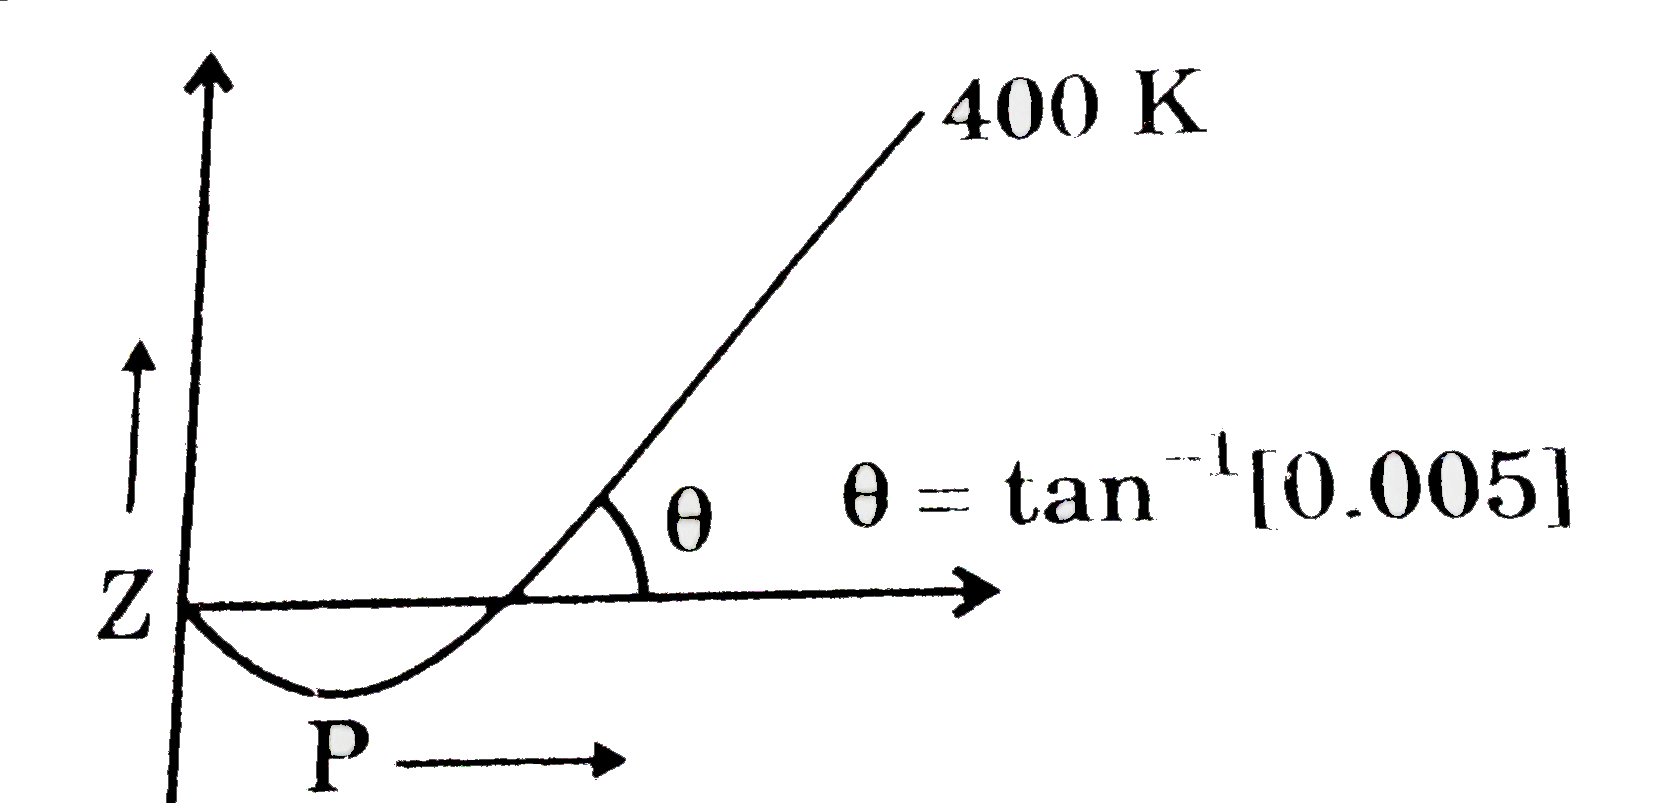
View SolutionConsider the following equilibrium `A(g) hArr 2B(g)` and the following graph : Select the correct statements.
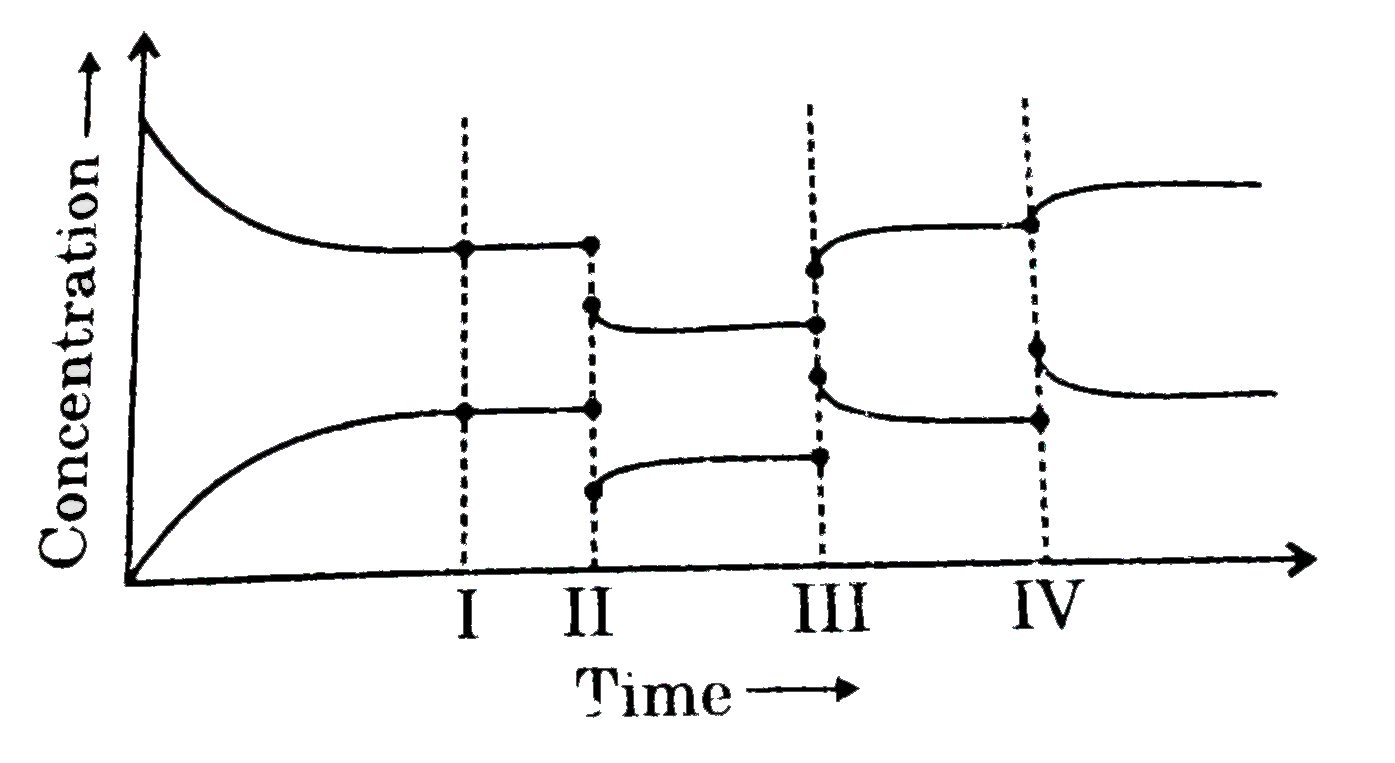
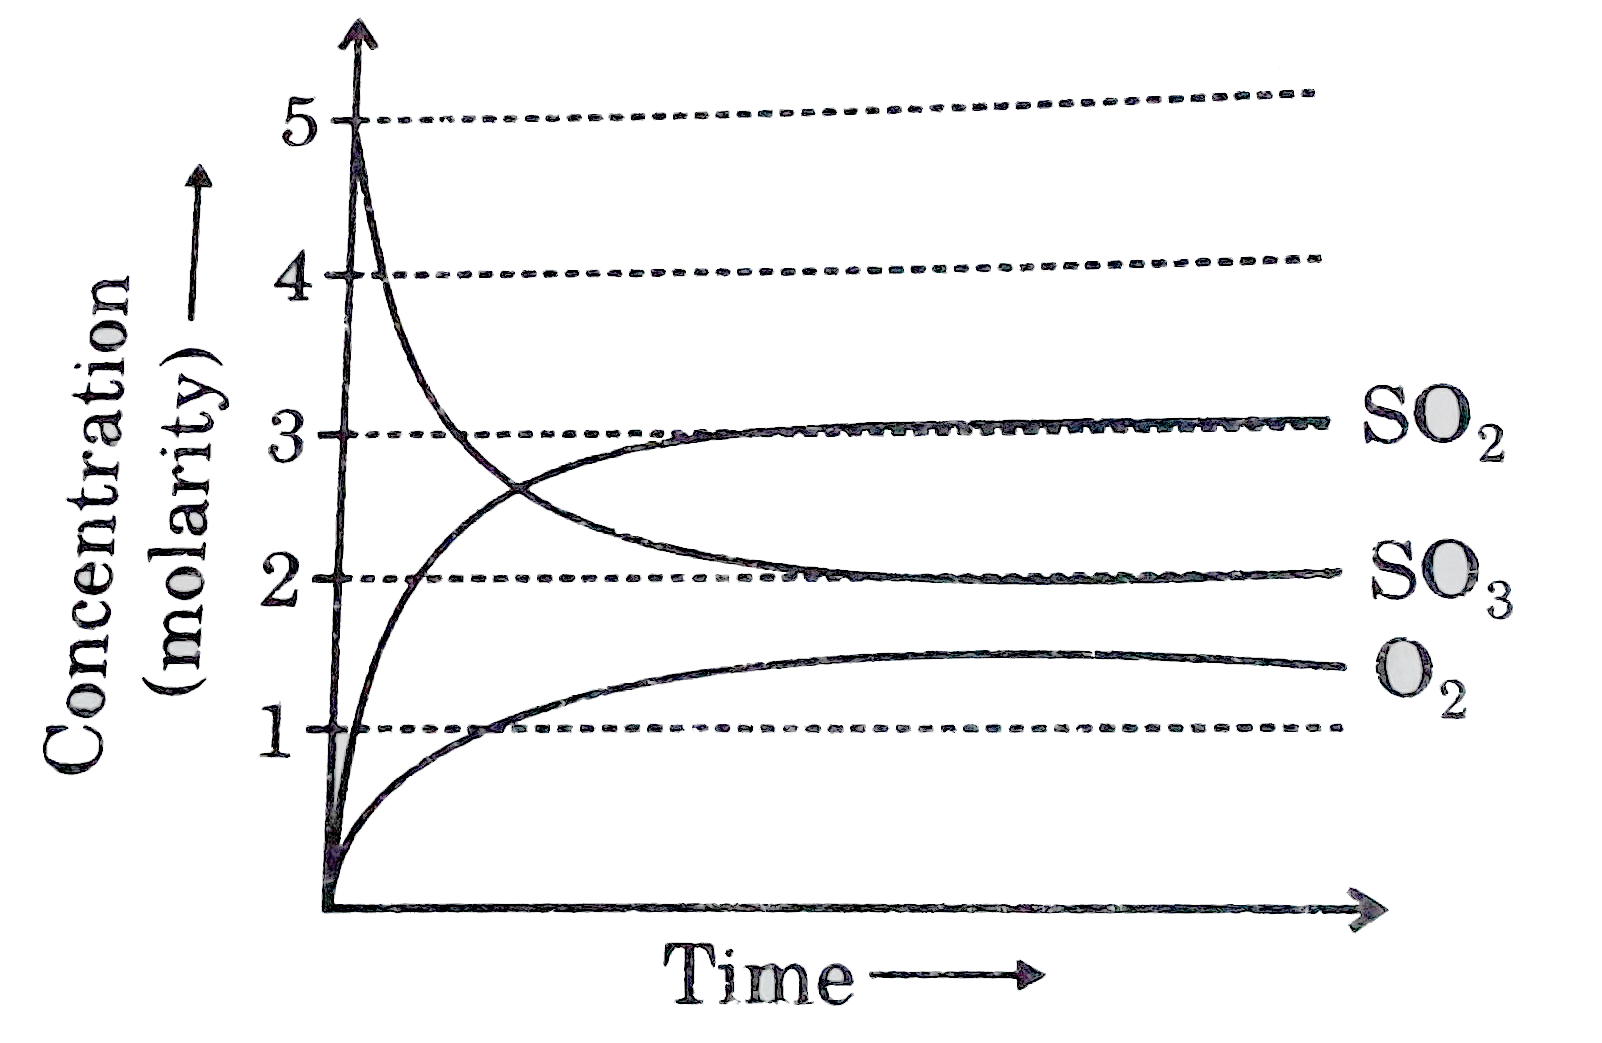
View SolutionThe dissociation of `SO_(3)(g)` into `SO_(2)(g)` and `O_(2)(g)` is carried out in a closed container at a constant temperature `T.2SO_(3) hArr 2SO_(2)(g) +O_(2)(g)` Variation of concentration with time is shown Choose the correct statement
View SolutionWhich of the following statement (s) is/are correct with respect to `Psi(r)` (y-axis) us r (x-axis) graph for H-atom ?
View SolutionThe curve C is for the gas X at 273 K.Choose the correct statement (s).
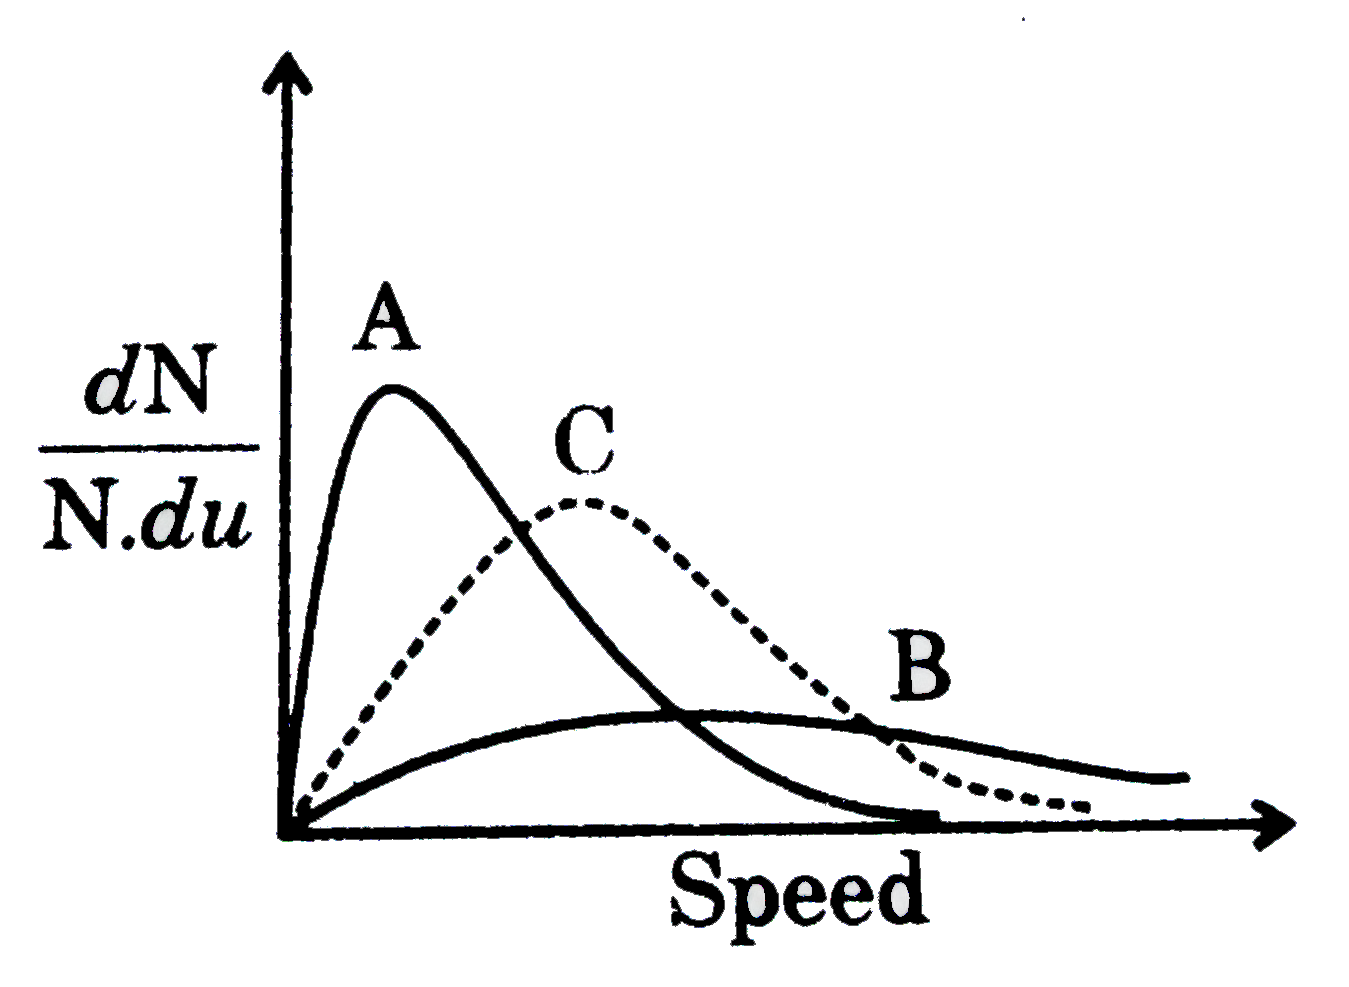
View SolutionFor fixed amount of ideal gas In P (y-axis) us In B (x-axis) curve is plotted at constant T Select correct statements.
View SolutionFor a van der Waals' gas, `a = 4 atm-l^(2)//"mol"^(2)` and `b = 0.02l//"mol"`. Select the correct possible graph (s). [Given: `R = 0.08 L-atm//"mol'-L]`
View SolutionFor the following process involving fixed moles of an ideal gas, select the correct statement (s). (d is density of gas)
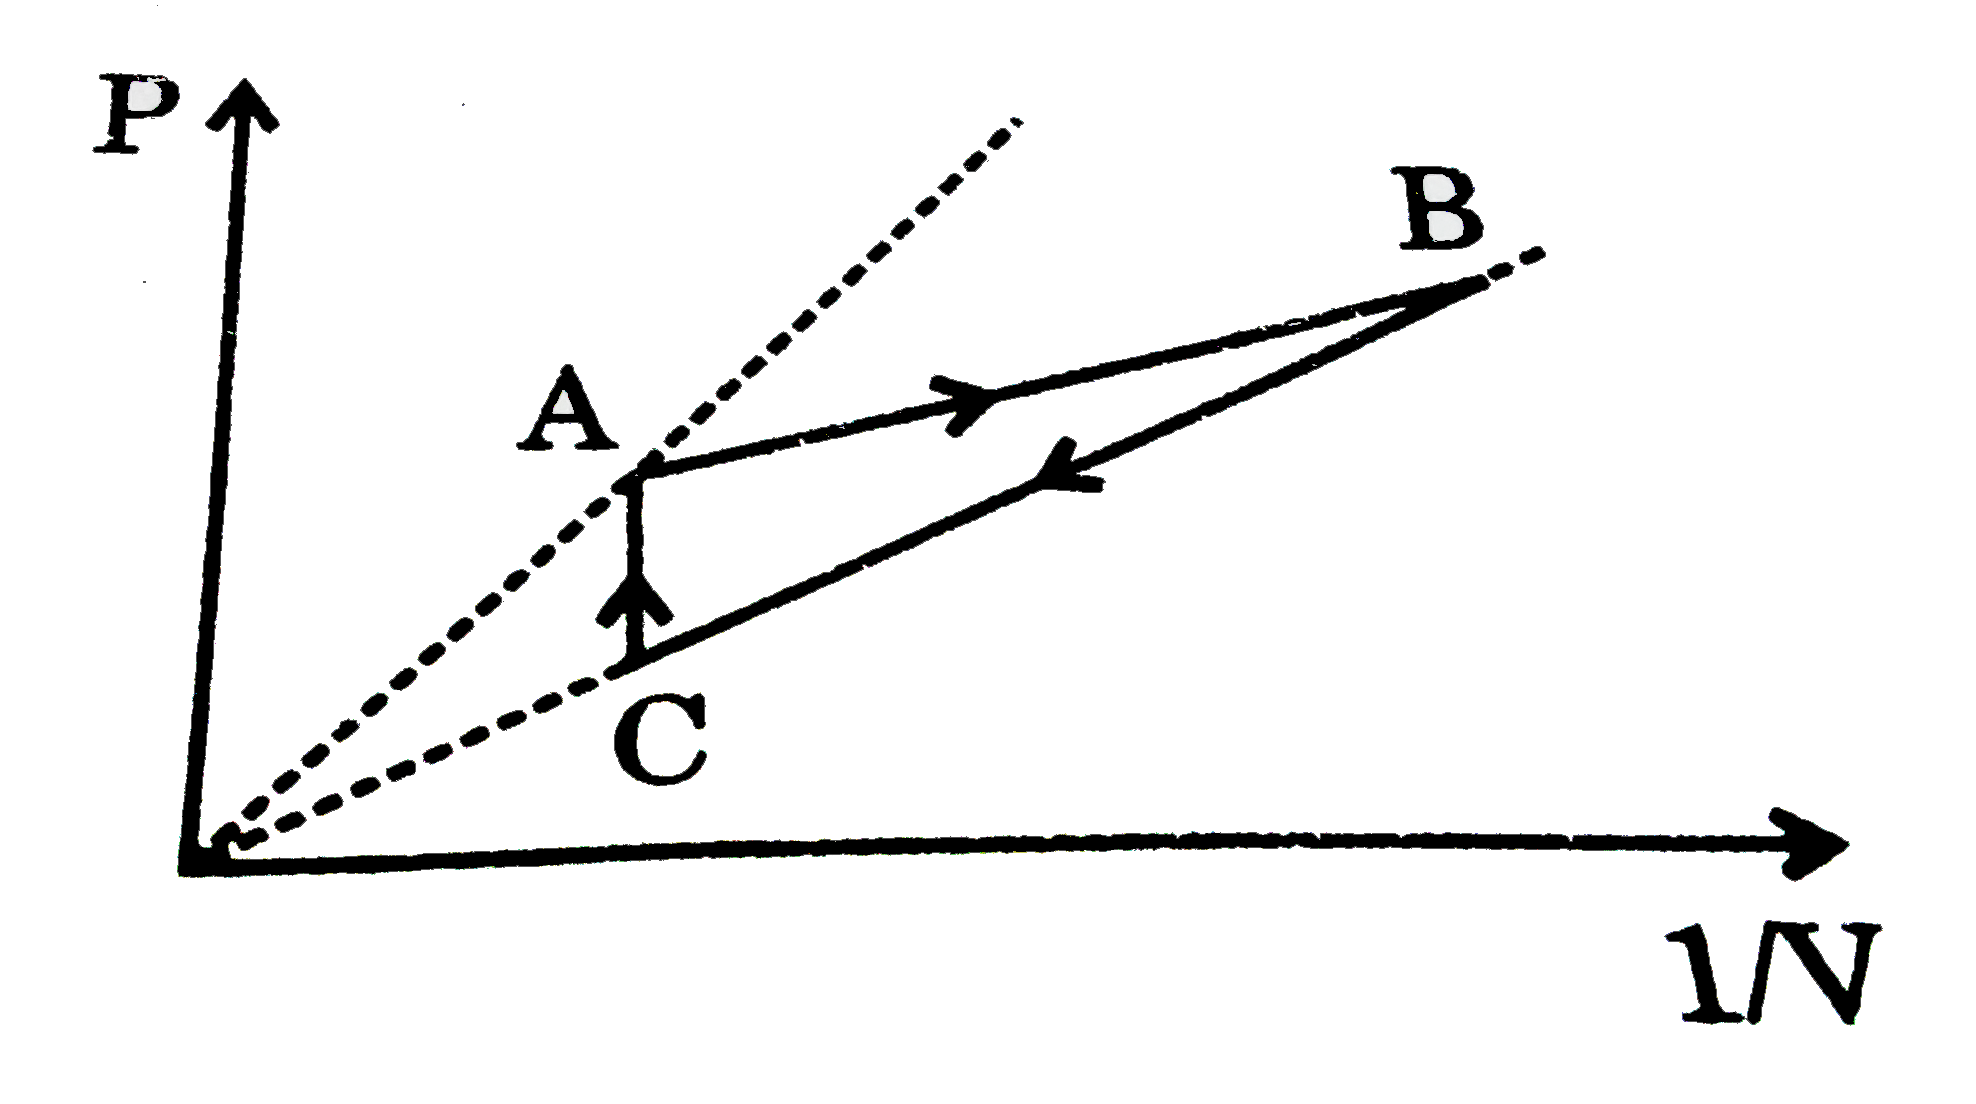
View SolutionWhich of the following graph is parabolic for fixed mass of an ideal gas at constant temperature in closed container ?
View SolutionFor an ideal gas, following observation is made as per Maxwell-Boltzmann distrbution. Choose the correct options.
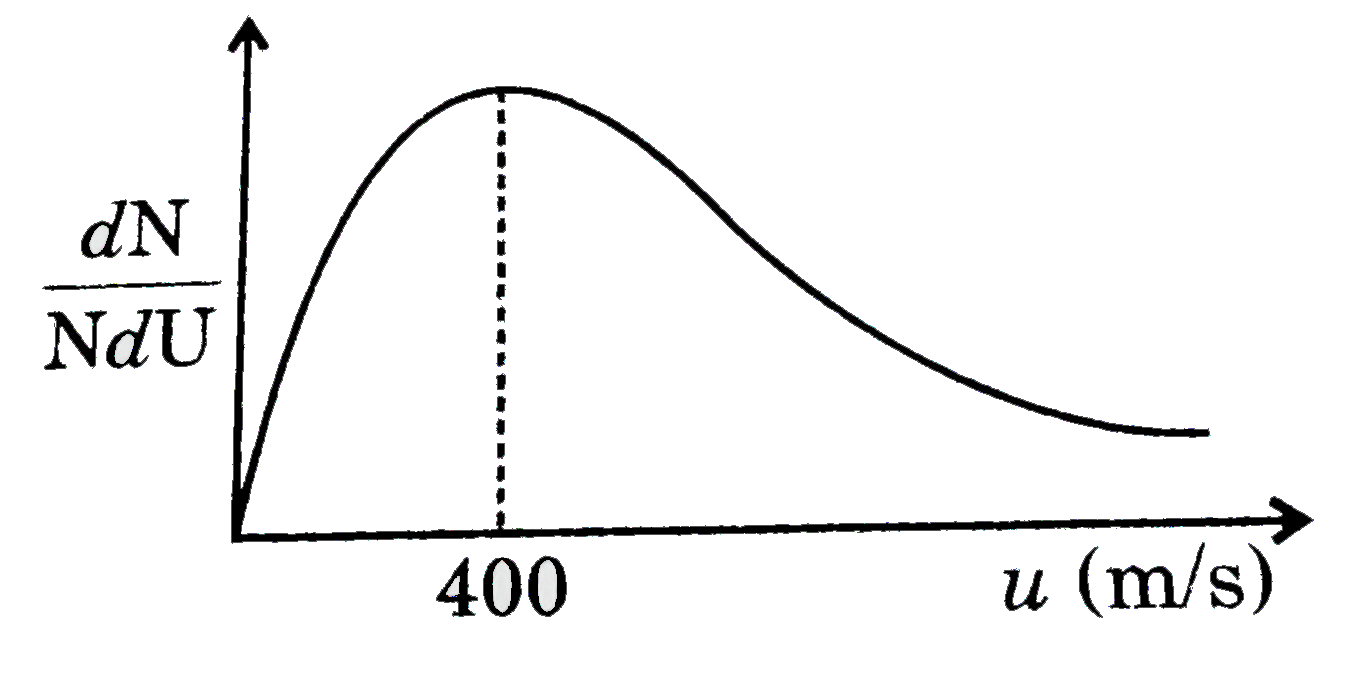
View SolutionWhich of the following statements is (are) true ?
View SolutionFor a fixed mass of gas at constant volume, which of the following statements is/are (not ) correct ?
View SolutionThe graph below shows the distribution of molecular speeds of two ideal gases X and Y at 200 K . On the basis of the below graph, identify the correct statements .
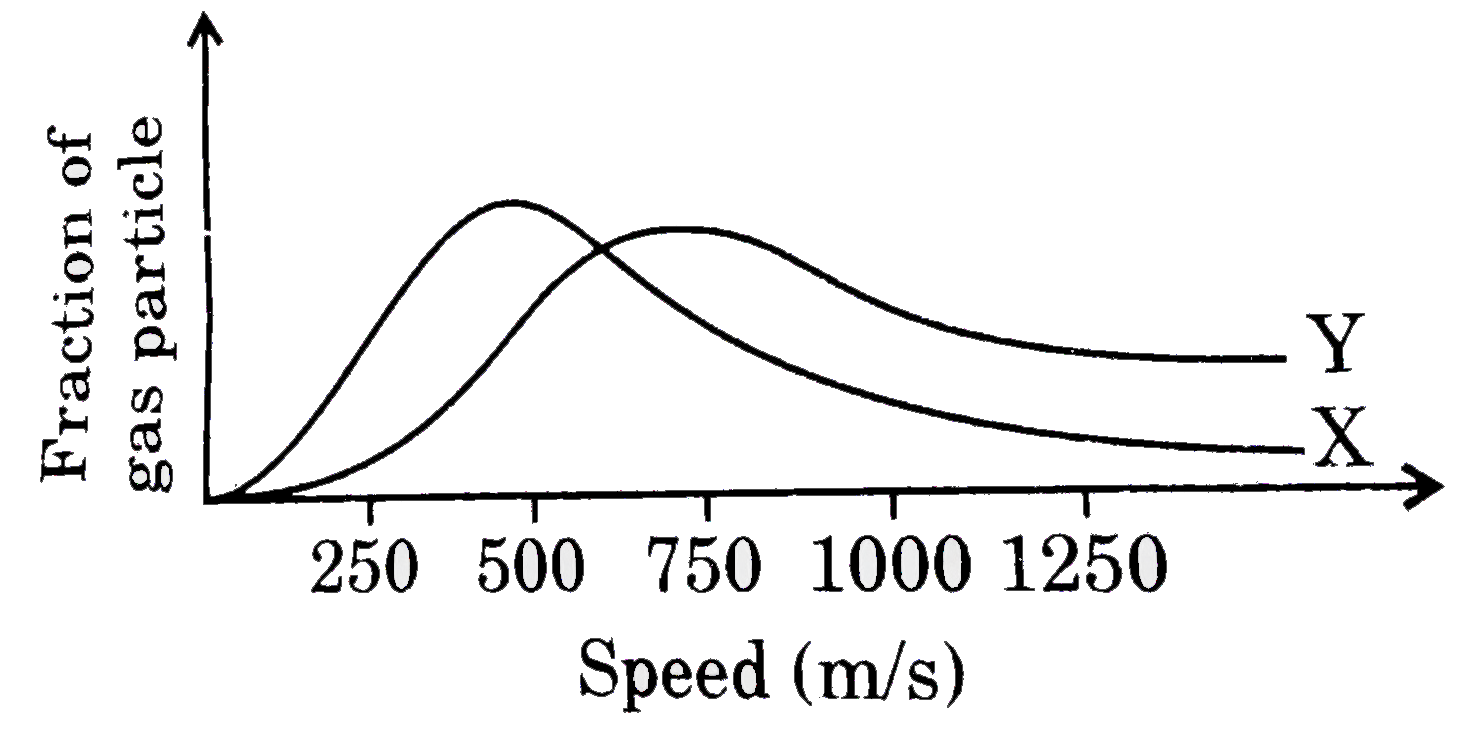
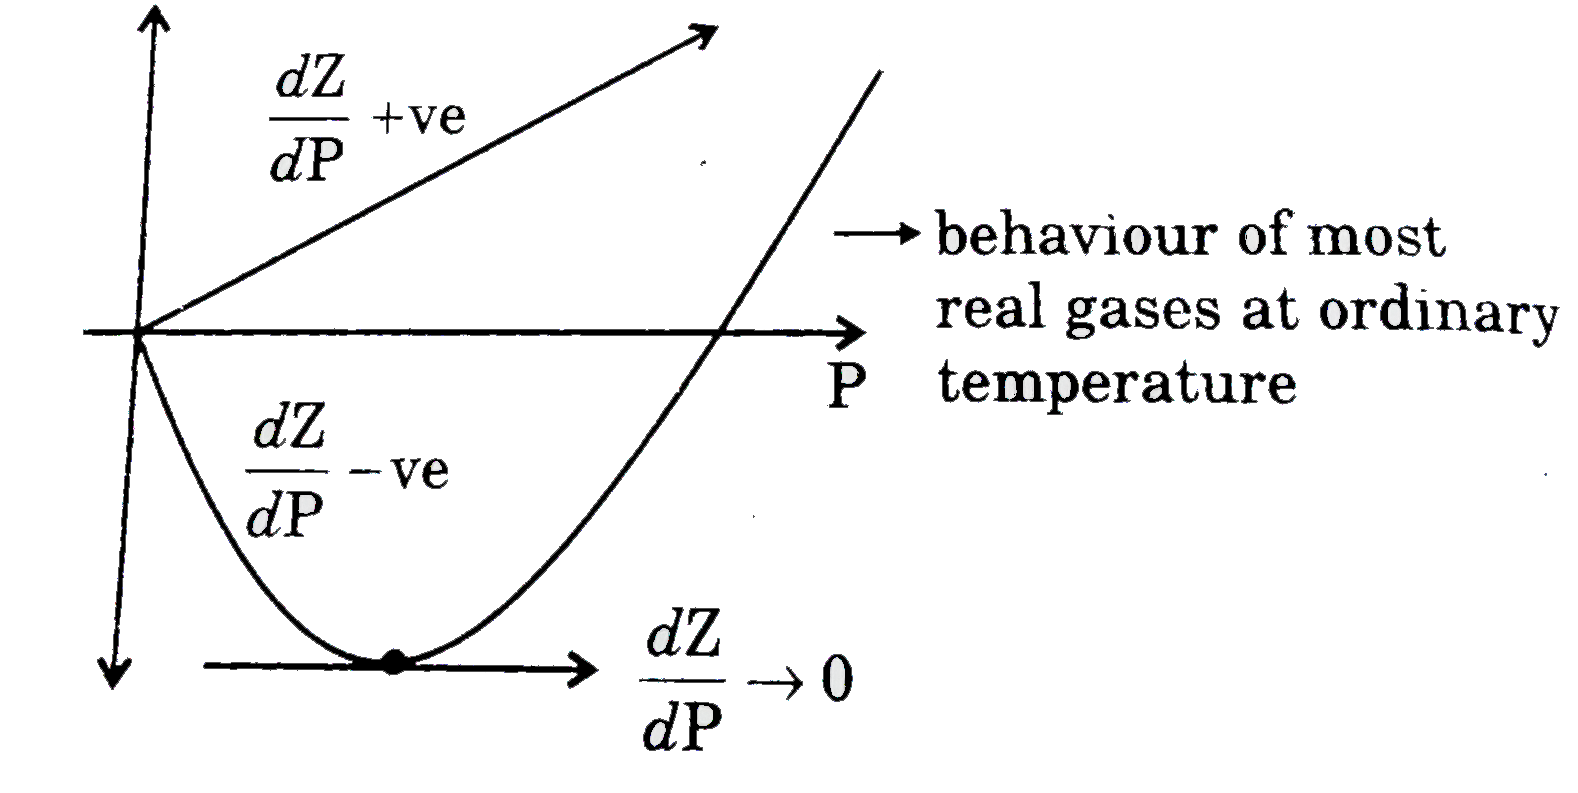
View SolutionWhich of the following statement(s) are true about Z us P graph for a real gas at a given temperature.
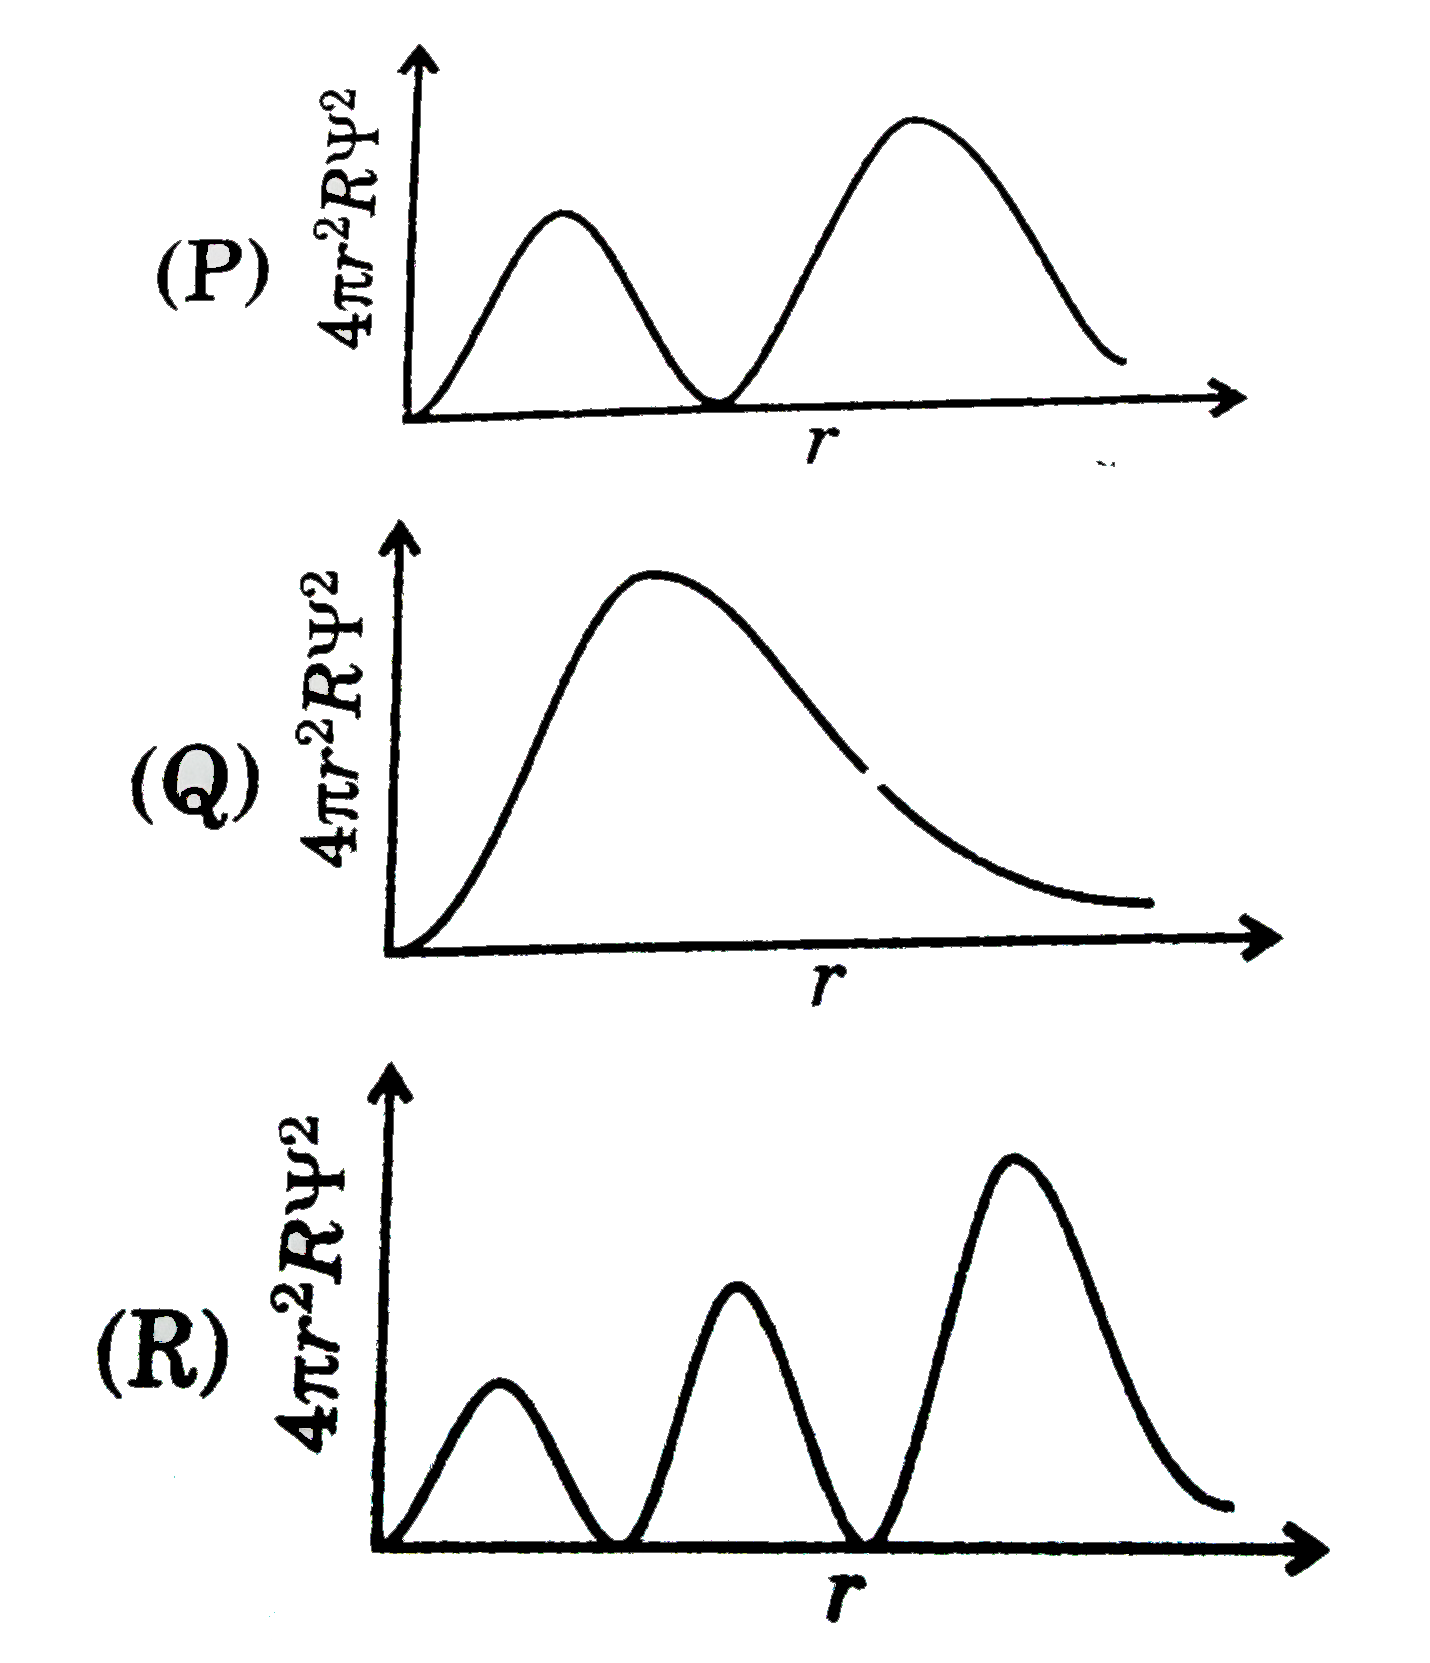
View SolutionWhich of following has correct matching of curve and orbital ?
View Solution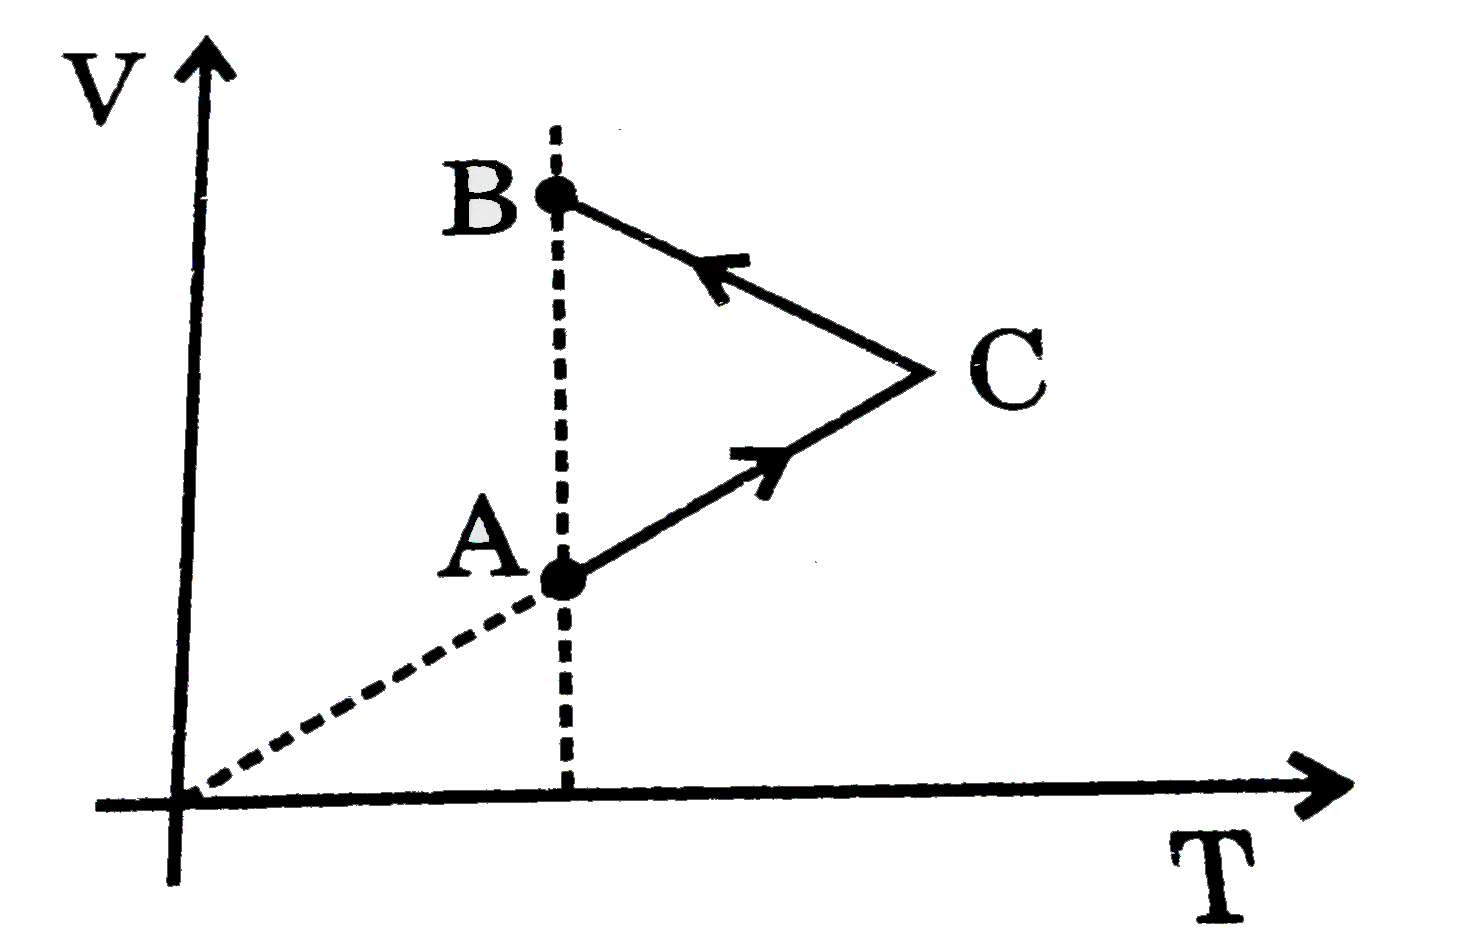
With refernce to above graph, which of the following is/are incorrect ?
View SolutionA gas has been subjected to an isochoric and isobaric cycle. Plot of the graph of this cycle in the pressure-density, V-T and P-T co-ordinates are given below. Choose the correct plots.
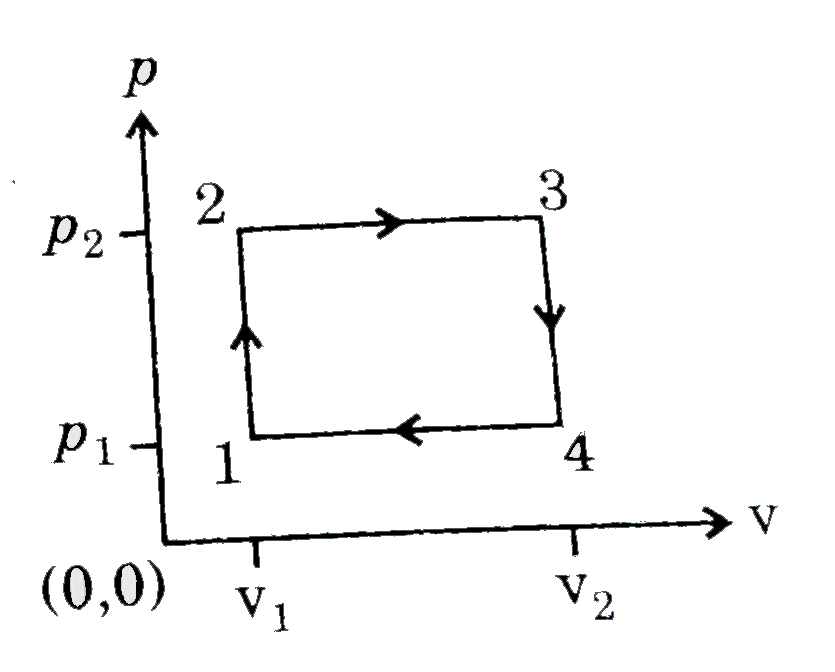
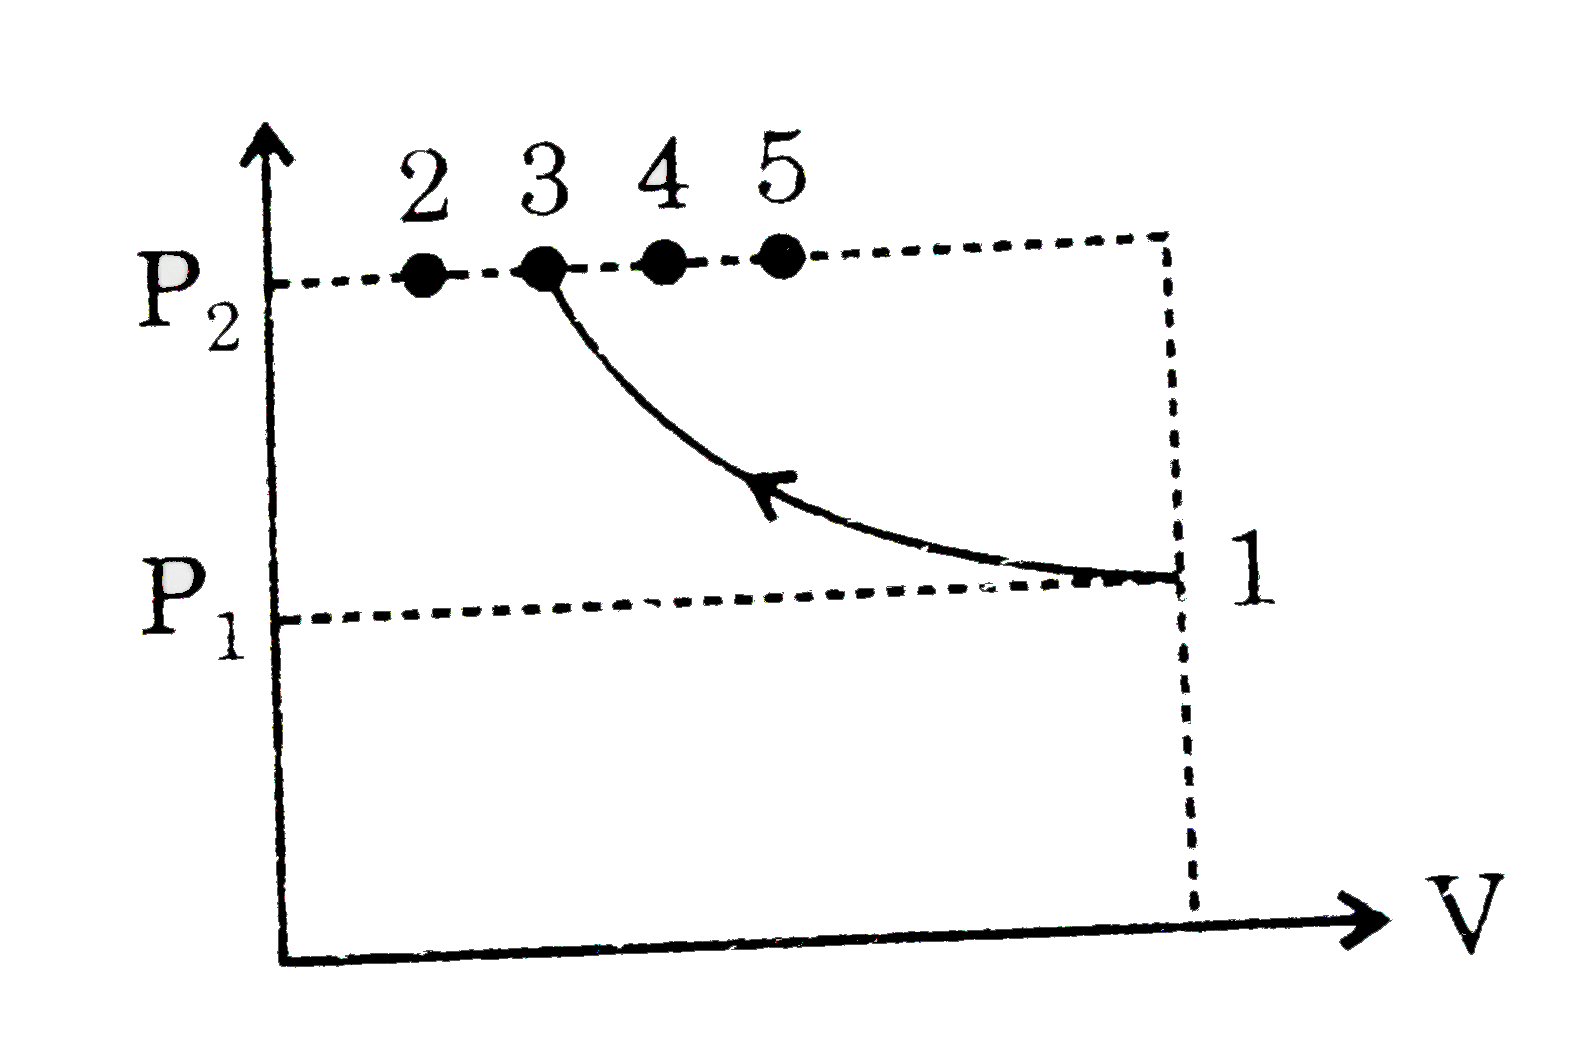
View SolutionAn ideal gas is taken from the same initial pressure `P_(1)` to the same final pressure `P_(2)` by four different process. If it is known that point 3 corresponds to a reversible adiabatic, point 4 corresponds to a single step adiabatic and point 2 corresponds to reversible isothermal. Select the incorrect option (s).
View SolutionIn the graph showing Maxwell Boltzmann distribution of energy ................ .
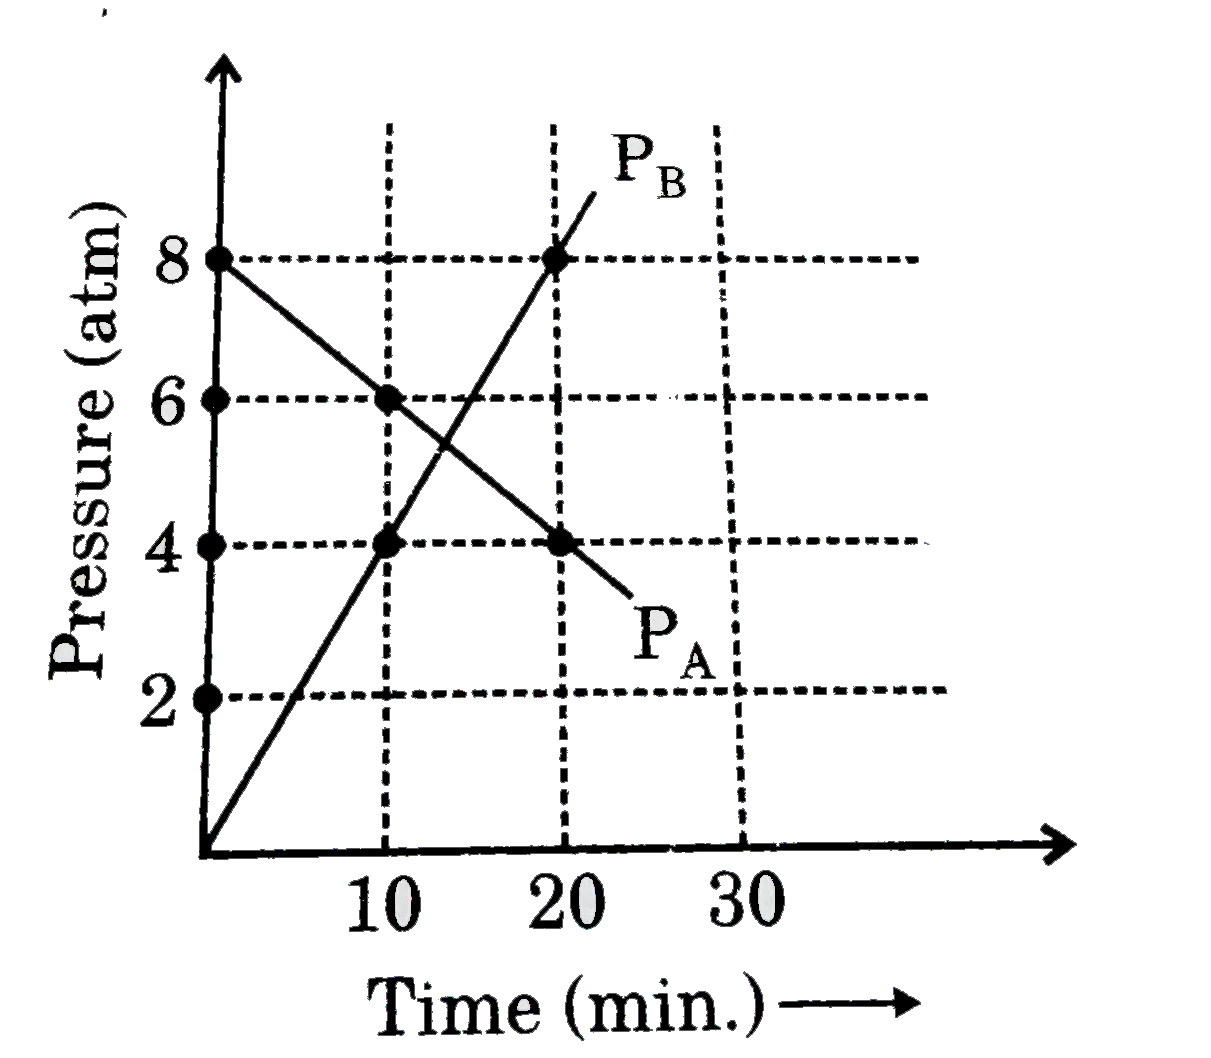
View SolutionIn a chemical reaction `A(g)` is converted to `B(g)` following observation is made. Identify the correct statement (s).
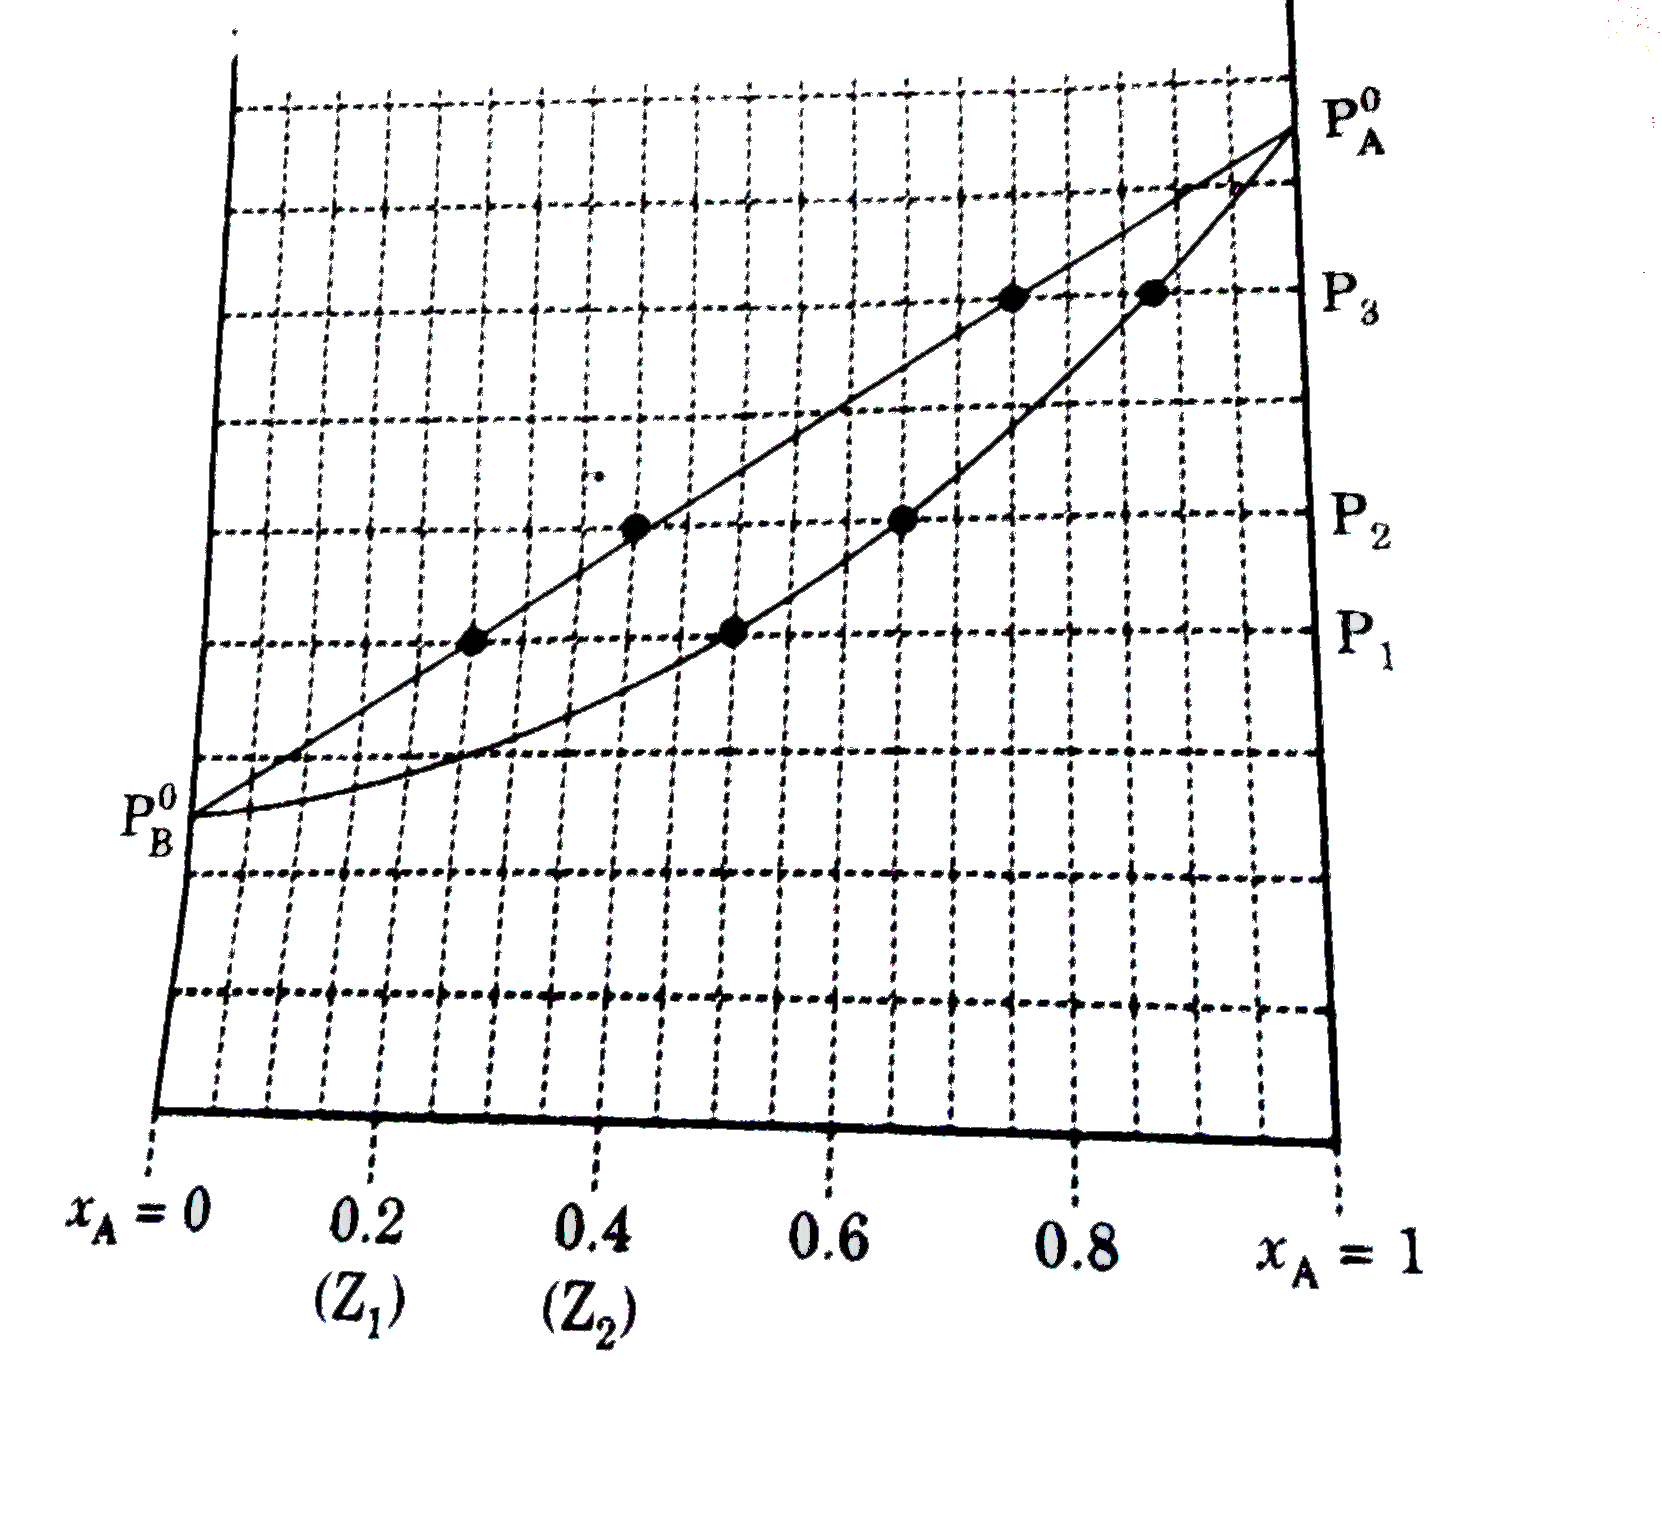
View SolutionFor a binary ideal liquid solution, the variation in total vapour pressure us composition of solution is given by which of the curves ?
View SolutionWith the help of following phase diagram, select the correct statements.
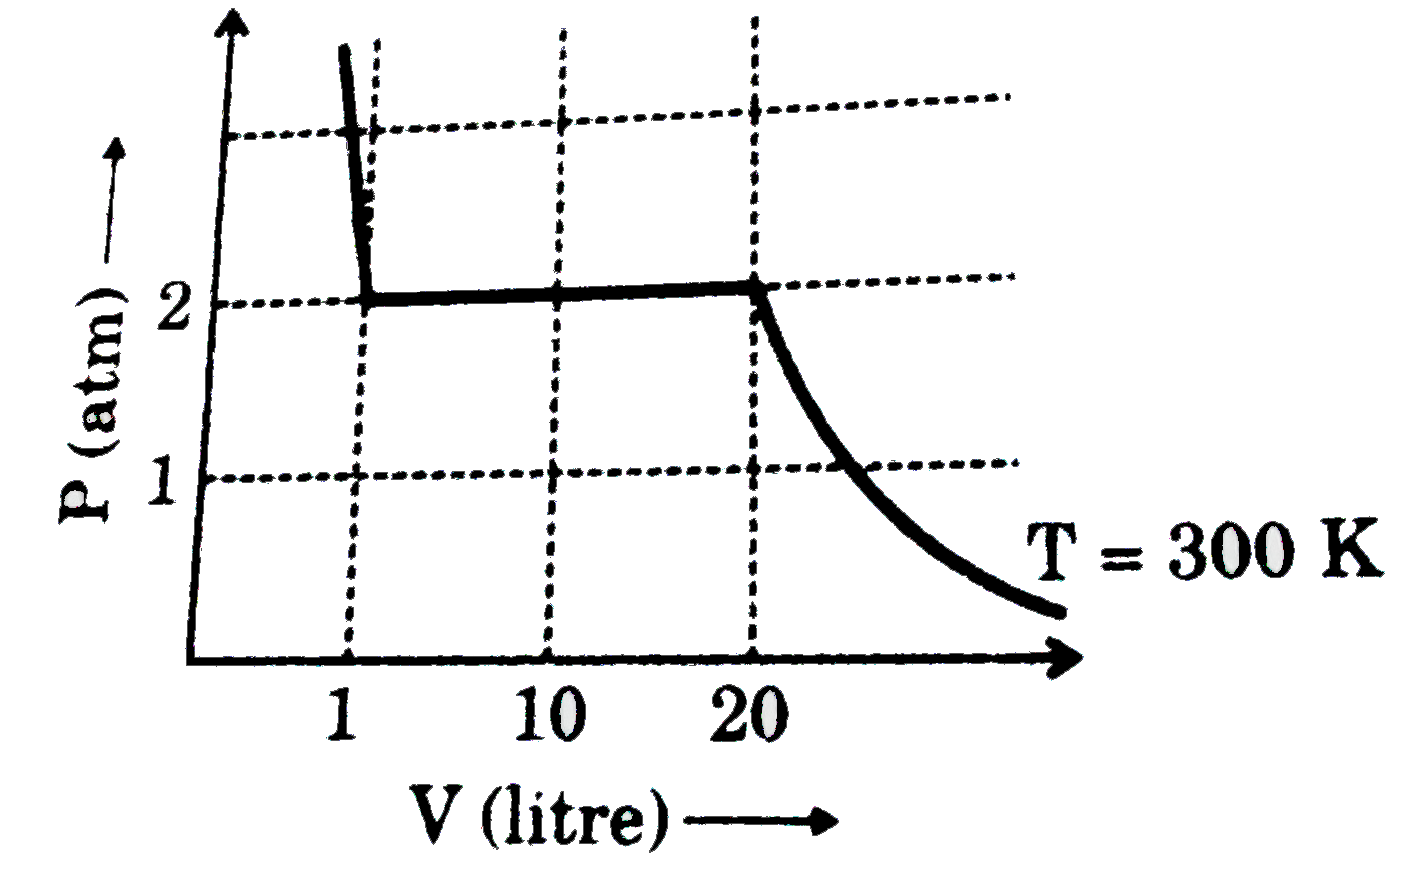
View SolutionA 1kg real gas is liquified at temperature 300 K as shown in diagram. Select the correct statement.
View SolutionFor the reaction
`2CI F_(3)(g) harr CI_(2)(g) +3F_(2)(g) log K_(eq) vs (1)/(T)` (where temperature is in K) curve is obtained as given. Which of the following change will increase the concentration of `CI_(2)` in an equilibrium mixture of `CI_(2), F_(2)` and `CIF_(3)`?
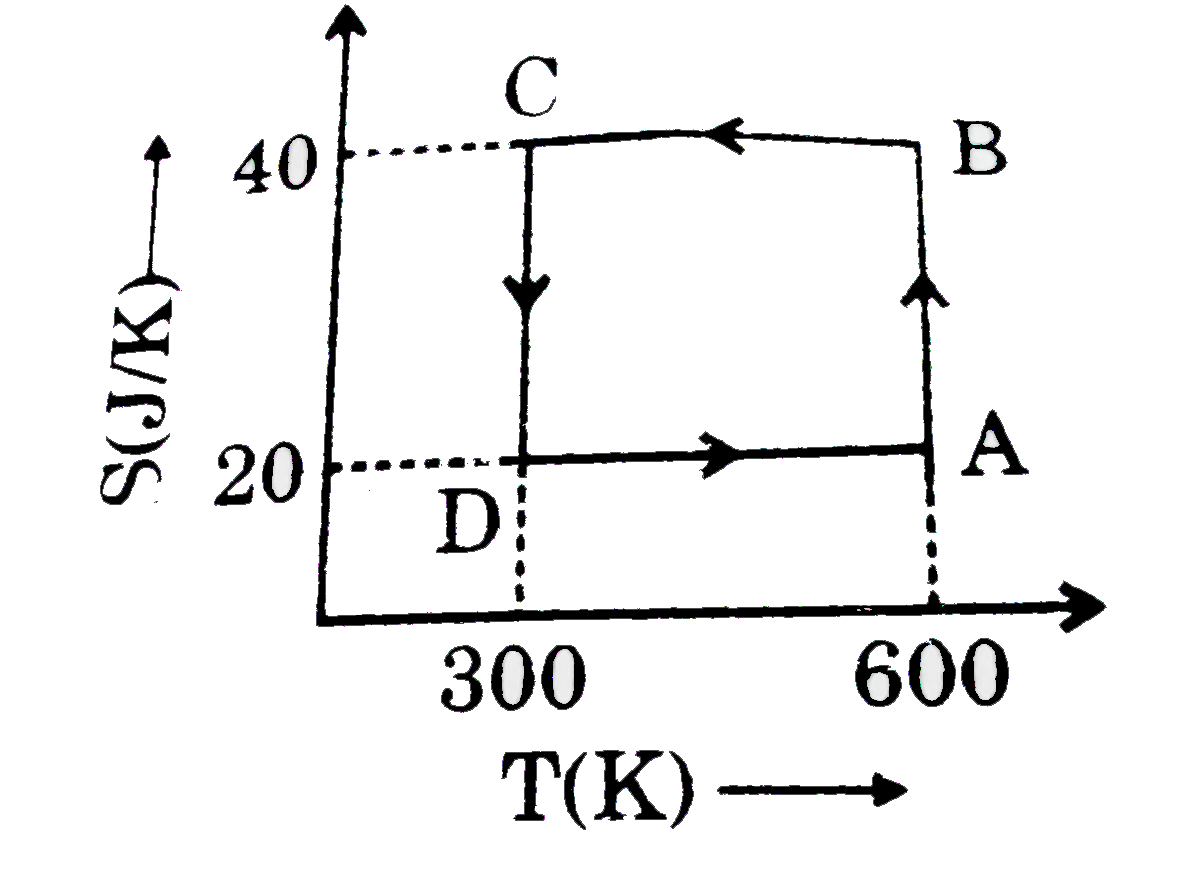
View SolutionFor the process,
View SolutionFor an irreversible process, if P-V graphs are plotted simply to represents the work involved in the process as the area under the P-V curve. Then which of the following options has/have the correct P-V curve for the mentioned process on an ideal gas placed in a cylinder fitted with a piston.
View SolutionWhich of the following graphs are correct ?
View SolutionWhich of the following graphs regarding Maxwell distribution of speed are correct for ideal gases ?
View SolutionFor the reaction, `A(g) rarr B(g) +C(g)`
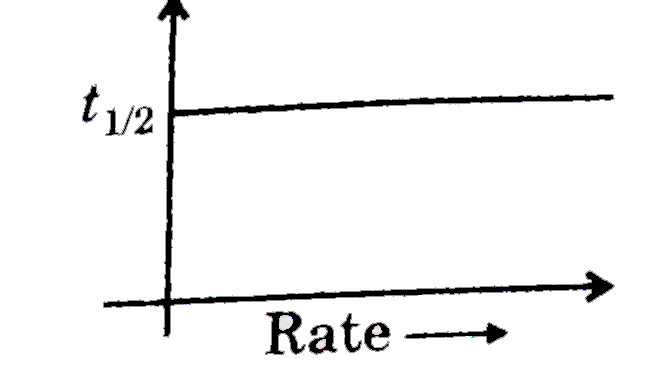
Select the correct graph.
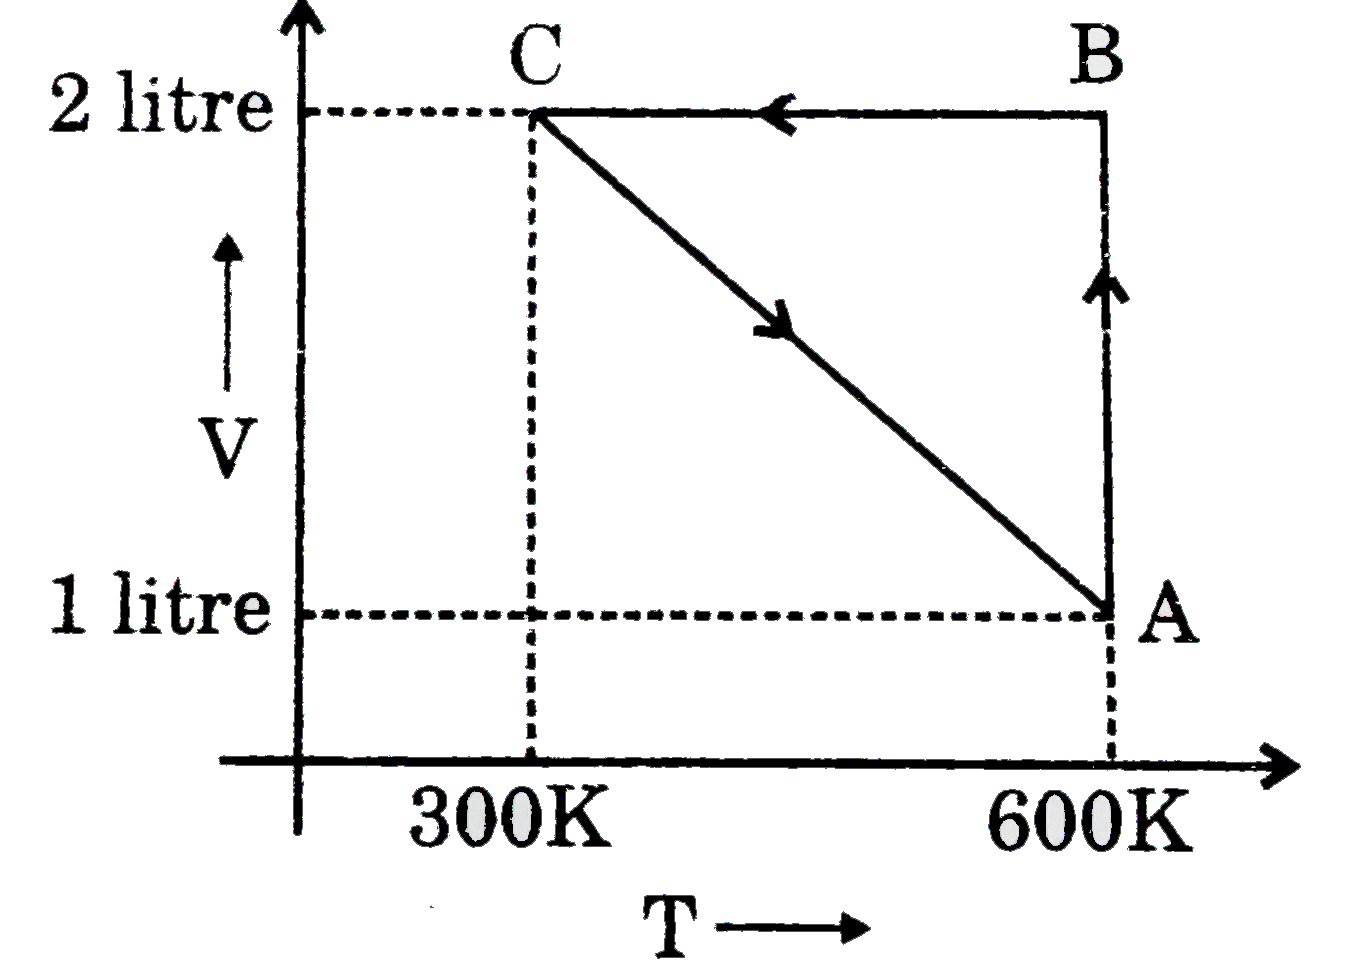
View Solution1 mole `N_(2)(g)` undergoes followingcyclic process : Which option(s) is/are correct ? [Use: `R = 2 Cal//K-"mole"`, ln `2 = 0.7`]
View SolutionWhich of the following is false regarding reversible adiabatic expansion of an ideal gas ?
View SolutionWhich of the following are correct ?
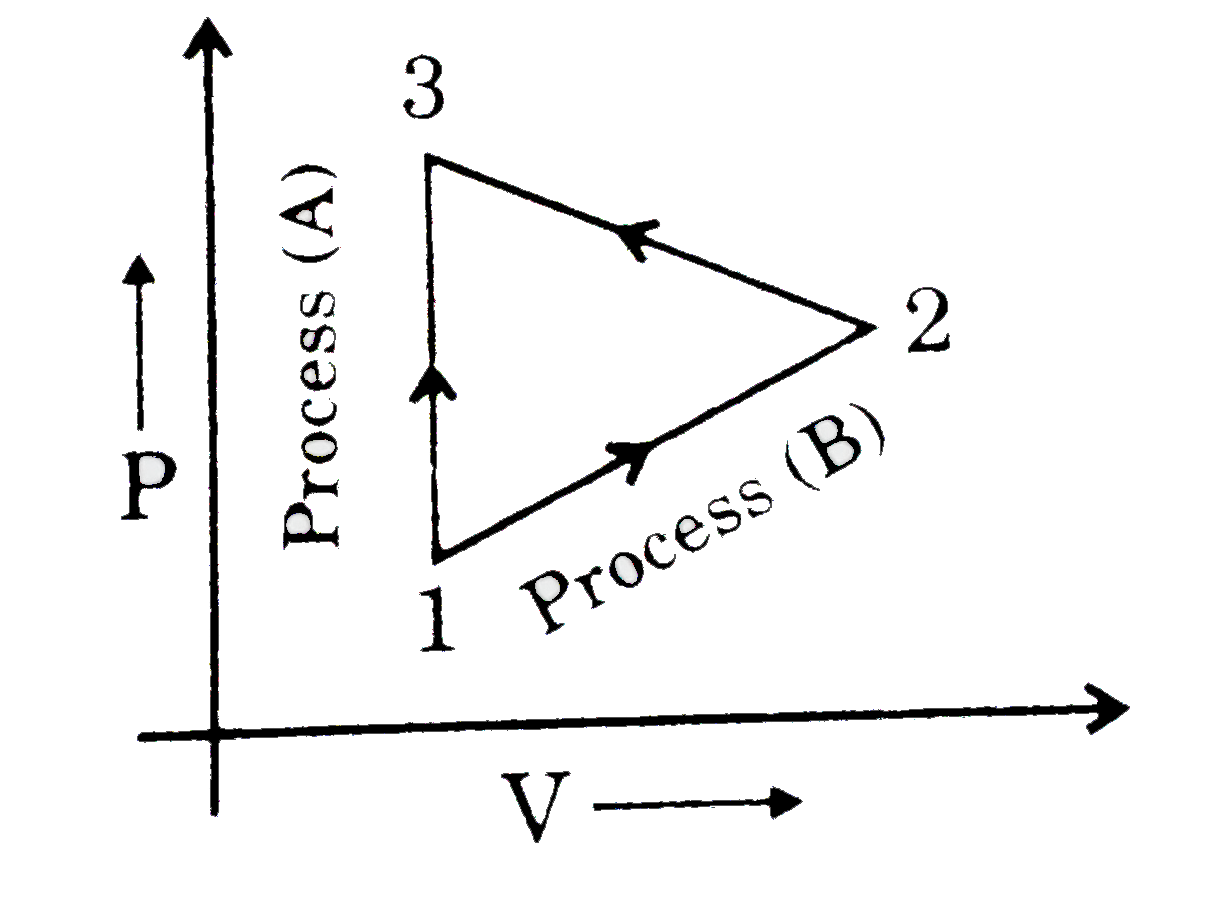
View SolutionTwo process are shown such that an ideal gas is taken from state 1 to state 3. Compare the following and choose the correct option(s).
View SolutionWhich of the following plots is/are correctly labelled ?
View SolutionWhich of the following are correct near room temperature ?
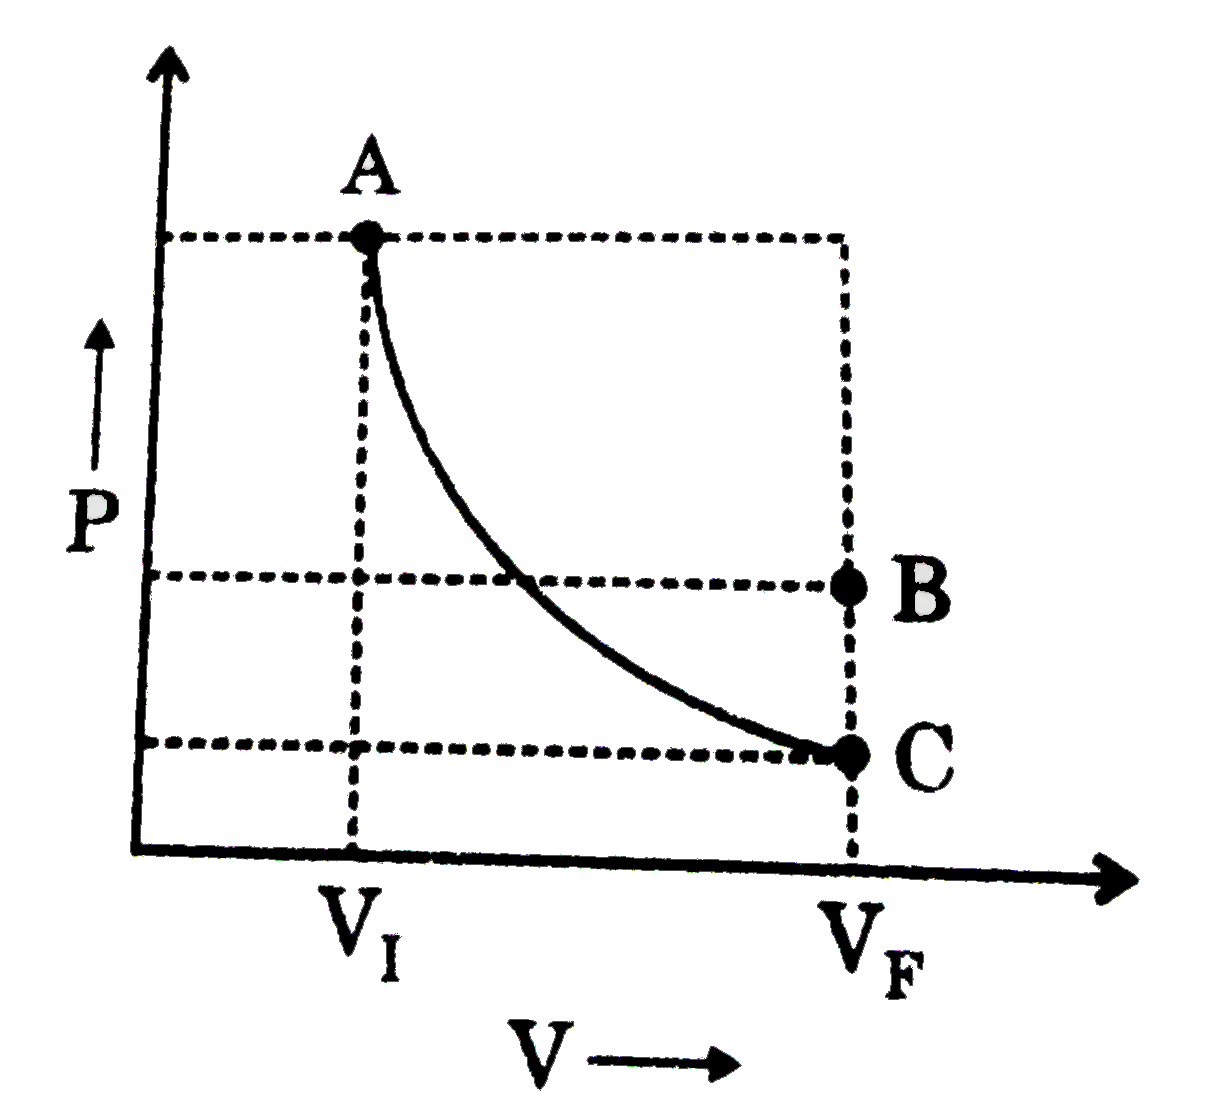
View SolutionAn ideal gas from same initial state participates in two different thermodynamic processes (AC -Reversible, AB-Irreversible) as shown in figure. If the entropy of surroundings remain constant in these processes, then which of the following are correct ?
View SolutionWhich of the following is/are correct ?
View SolutionConsider the following reaction :
`2A(s) + 3B(g) hArr 2C(g) +2D(g)`
For given reaction, graph which is followed between ln k and `1//T` is:
Which of the following statement(s) is/are incorrect ?
View SolutionSelect the correct graph for Bohr atom:
View SolutionFor s-orbital, `4pi r^(2) Psi_(r)^(2)` us r is plotted. Select correct statement (s).
Note: S = spherical surface at given distance. P = Point (very small volume) at given distance.

View SolutionWhich of the following are correct ?
View SolutionThe diagram given below represents boiling point composition diagram of solution of component A and B. Which is/are incorrect among the following ?
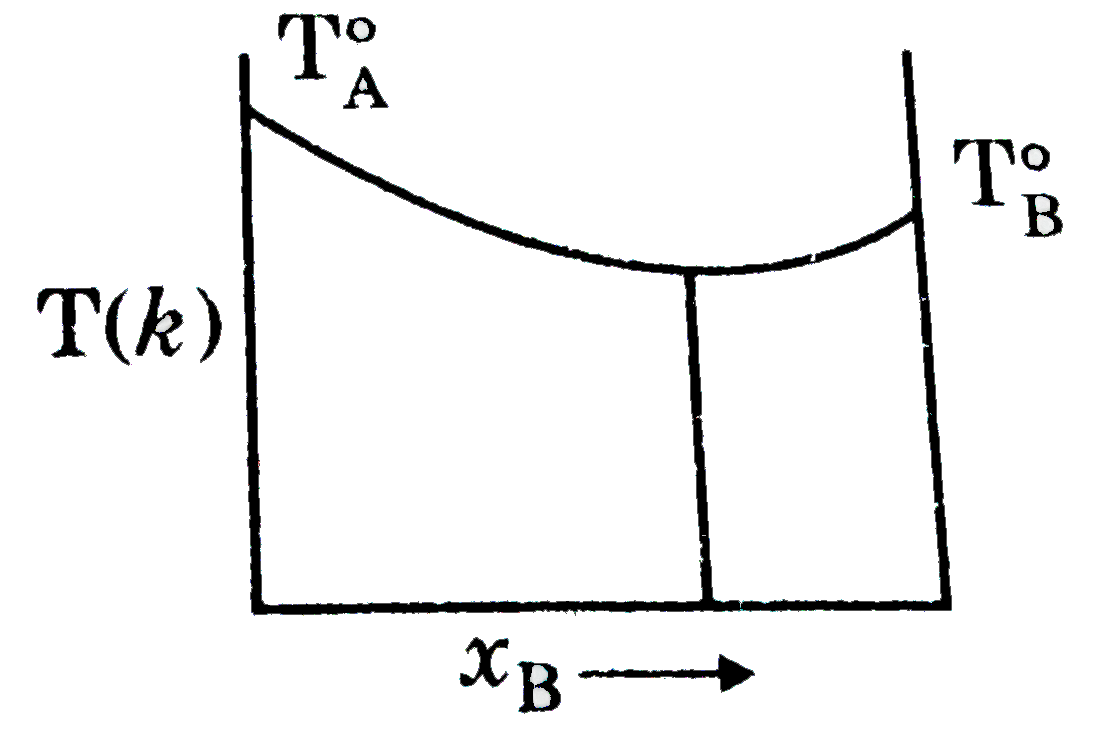
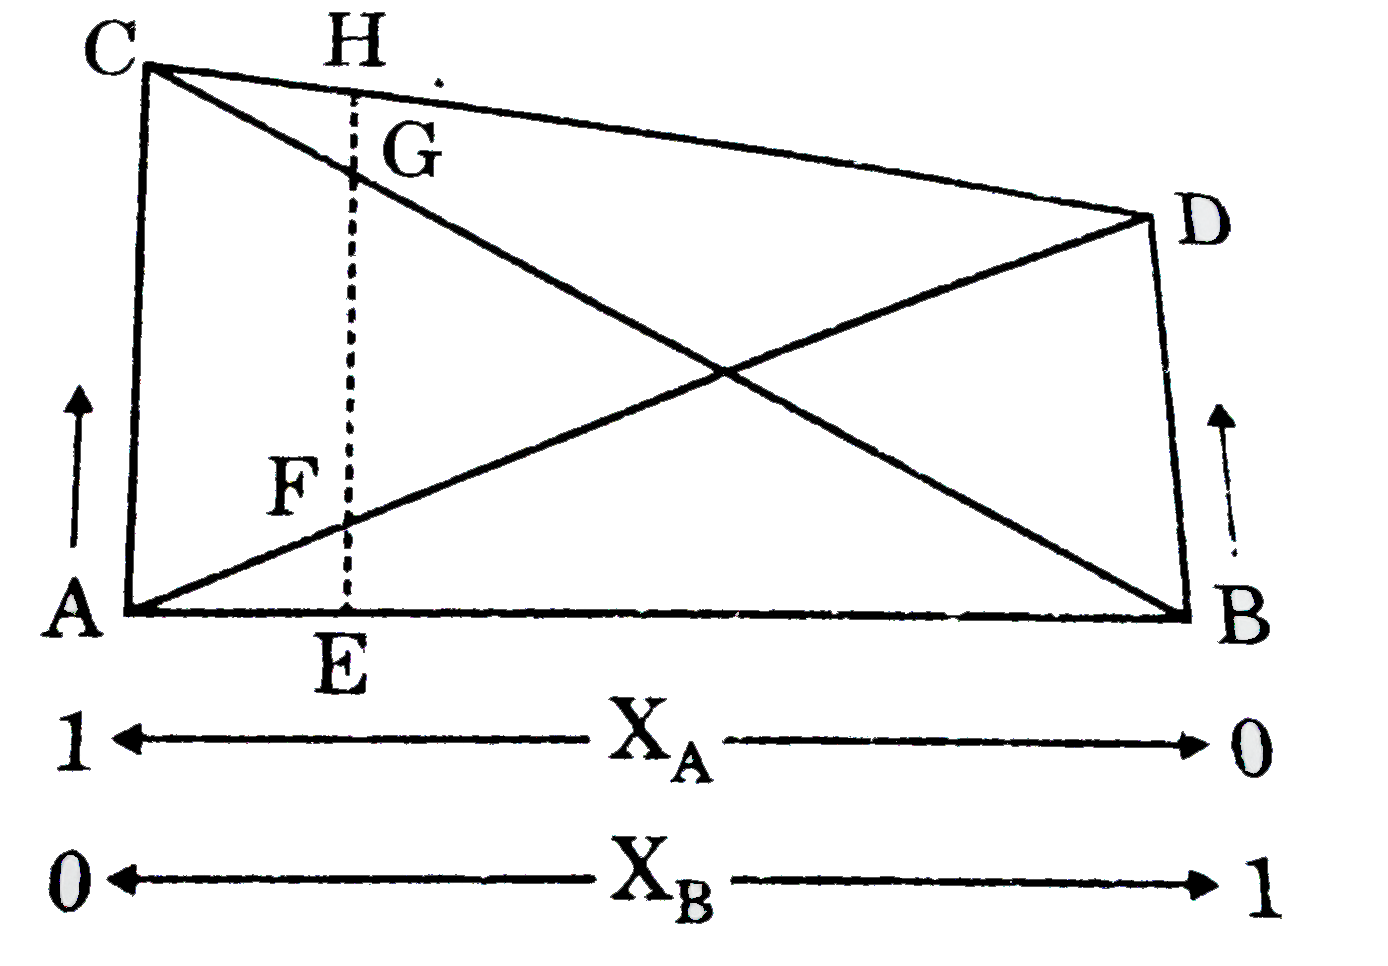
View SolutionBased on the given diagram, which of the following statements regarding the solutions of two miscible volatile liquids are correct ?
View SolutionFreundlich adsorption isotherm is given by the expression `(x)/(m) = kp^(1//n)`. Which of the following conclusions can be drawn from this expression ?
View SolutionWhich of the following statements is/are correct with respect to surface phenomenon ?
View SolutionFor the given graph of real gas: What should be the pathto change a gas into a liquid or vice-versa in which always a single phase is present ?
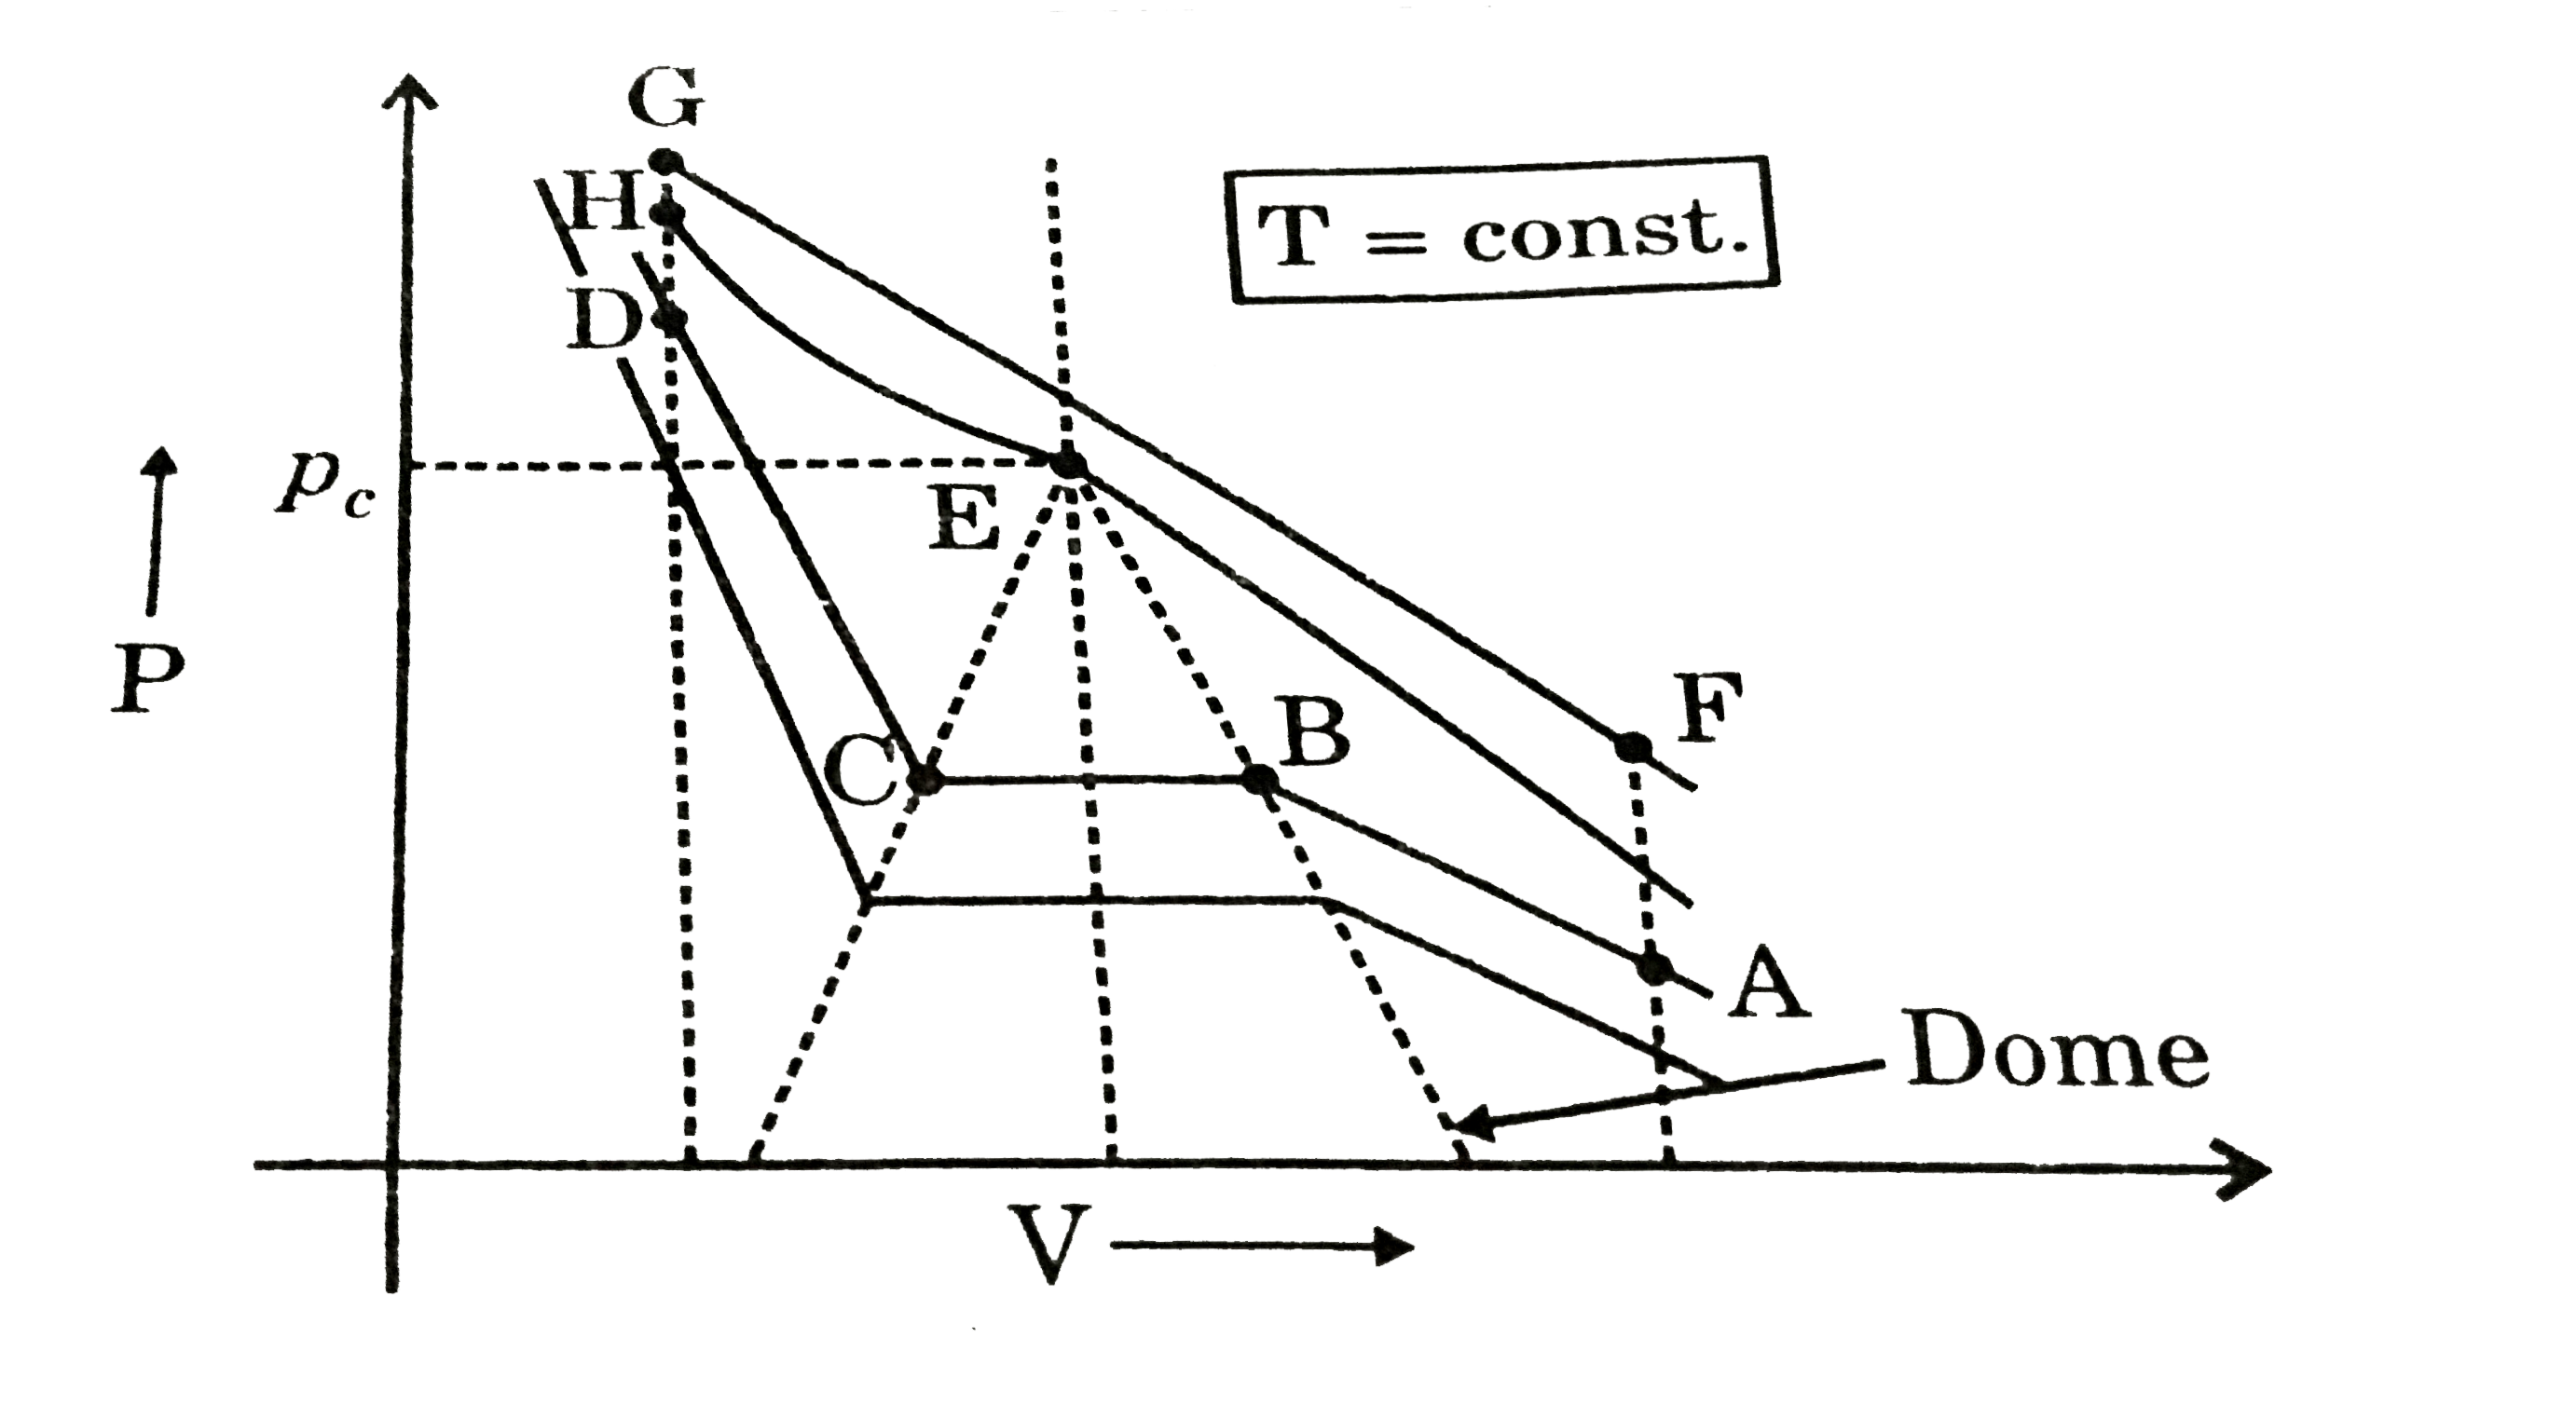
View SolutionIn the graph of , if we use the term fluid for either a gas or a liquid, then which of the following can be true statement(s)?
View Solution1 mole of real gas changes its state from state -A ( bar, 3L, 100K) to state-B (2bar, 5L, 200K) at constant pressure and finally to state-C (3 bar, 10 L, 300K). If `DeltaU_(BC) = 110 J` and `C_(P_(m))` of gas `= 3R = 3x 8.3 JK^(-1) mol^(-1)` then choose the correct option (s).
View Solution
Multiple Objective Type questions and complete solutions for chapter GRAPHICAL INTERPRETATION of GRB CHEMISTRY (HINGLISH) of Class 12
All Exercises from GRB PUBLICATION Class 12 CHEMISTRY GRAPHICAL INTERPRETATION
- A. Thermodynamics
- Atomic Sturcture
- B. Gaseous State
- C. Atomic Sturcture
- Chemical Equilibrium
- Chemical Kinetics
- Comprehension
- Comprehension 1
- Comprehension 10
- Comprehension 11
- Comprehension 12
- Comprehension 13
- Comprehension 14
- Comprehension 15
- Comprehension 16
- Comprehension 17
- Comprehension 18
- Comprehension 19
- Comprehension 2
- Comprehension 20
- Comprehension 21
- Comprehension 22
- Comprehension 23
- Comprehension 24
- Comprehension 25
- Comprehension 26
- Comprehension 27
- Comprehension 28
- Comprehension 29
- Comprehension 3
- Comprehension 4
- Comprehension 5
- Comprehension 6
- Comprehension 7
- Comprehension 8
- Comprehension 9
- D. Liquid Solutions
- E. Surface Chemistry
- Electrochemistry
- F. Ionic Equilibrium
- G. Chemical Equilibrium
- Gaseous State
- H. Chemical Kinetics
- I.Electrochemistry
- Ionic Equilibrium
- Liquid Solutions
- Match The Column Type
- Multiple Objective Type
- Subjective Type
- Surface Chemistry
- Thermodynamics