Complete Solutions to Gaseous State of chapter GRAPHICAL INTERPRETATION of Class 12 book with complete answers and questions
| Class 12 | CHEMISTRY |
| Chapter | GRAPHICAL INTERPRETATION |
| GRB PUBLICATION | Gaseous State |
| Number Of Questions | 39 |
| Academic Year | 2023-24 |
For a closed container containing 10 moles of an ideal gas, at constant pressure of `0.82` atm, which graph correctly represent, variation of log V us log T where volume is in litre and temp. in kelvin :
View SolutionWhich graph represents the correct relationship between various velocities for an idela gas ?
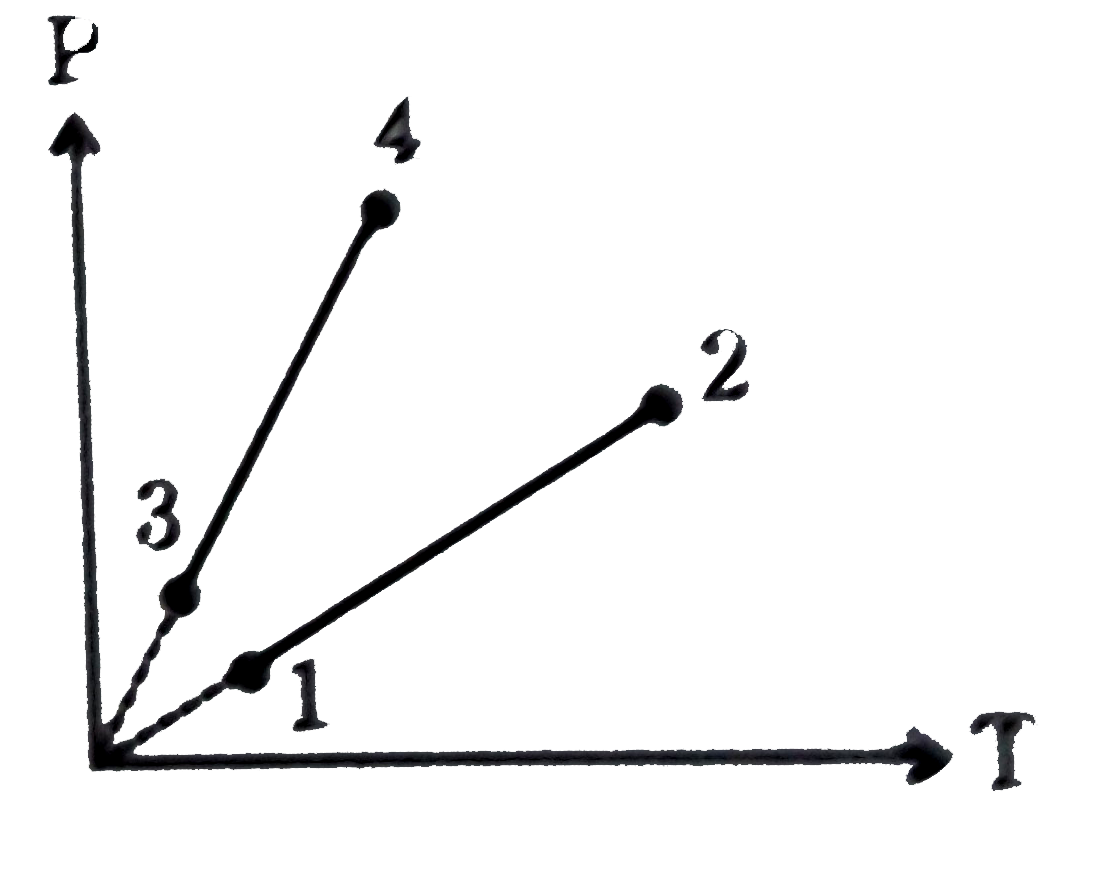
View SolutionPressure versus temperature graph of an ideal gas of equal number of moles of different volumes is plotted as shown in figure. Choose the correct alternatives.
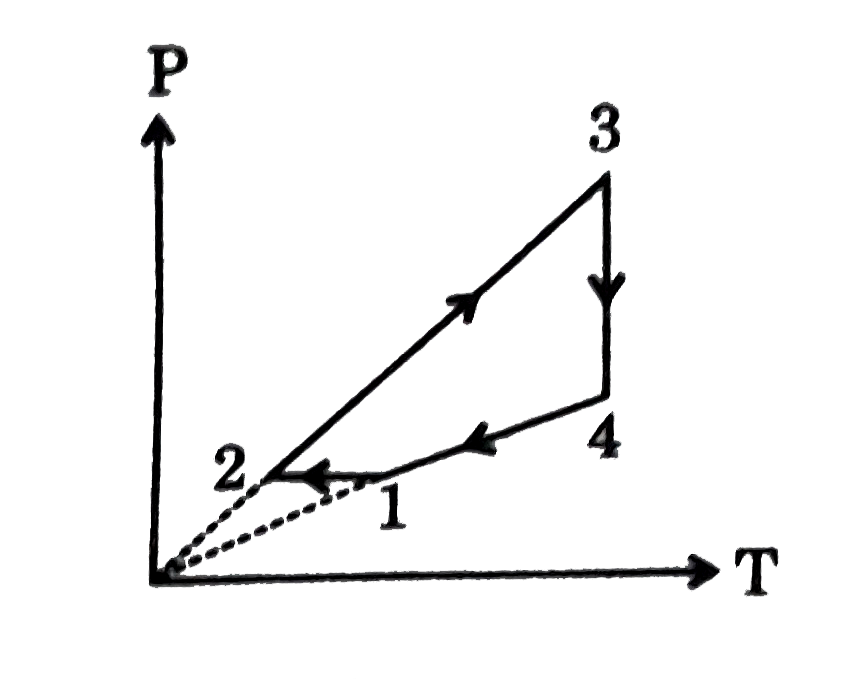
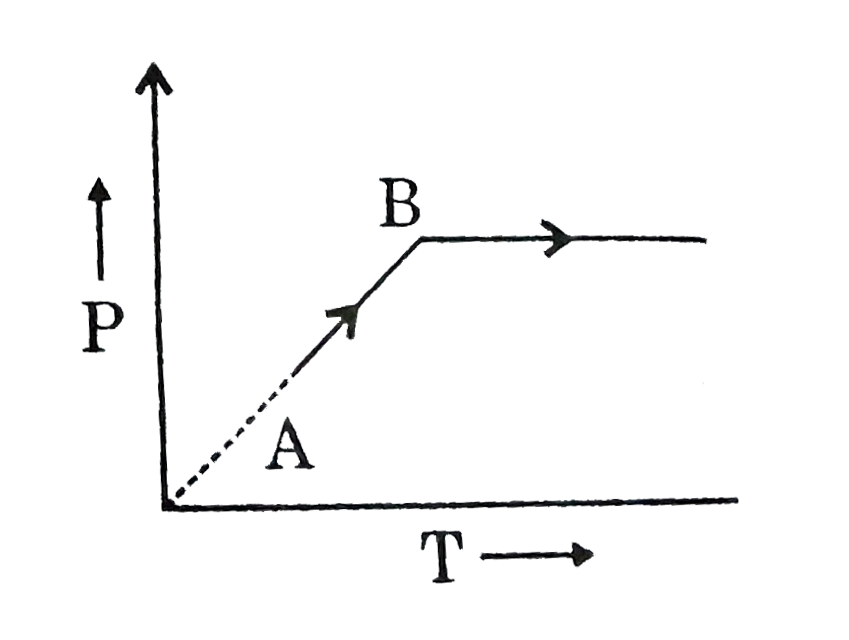
View SolutionConsider the following (P-T) graph for a fixed mass of gas: Correct P-V graph as:
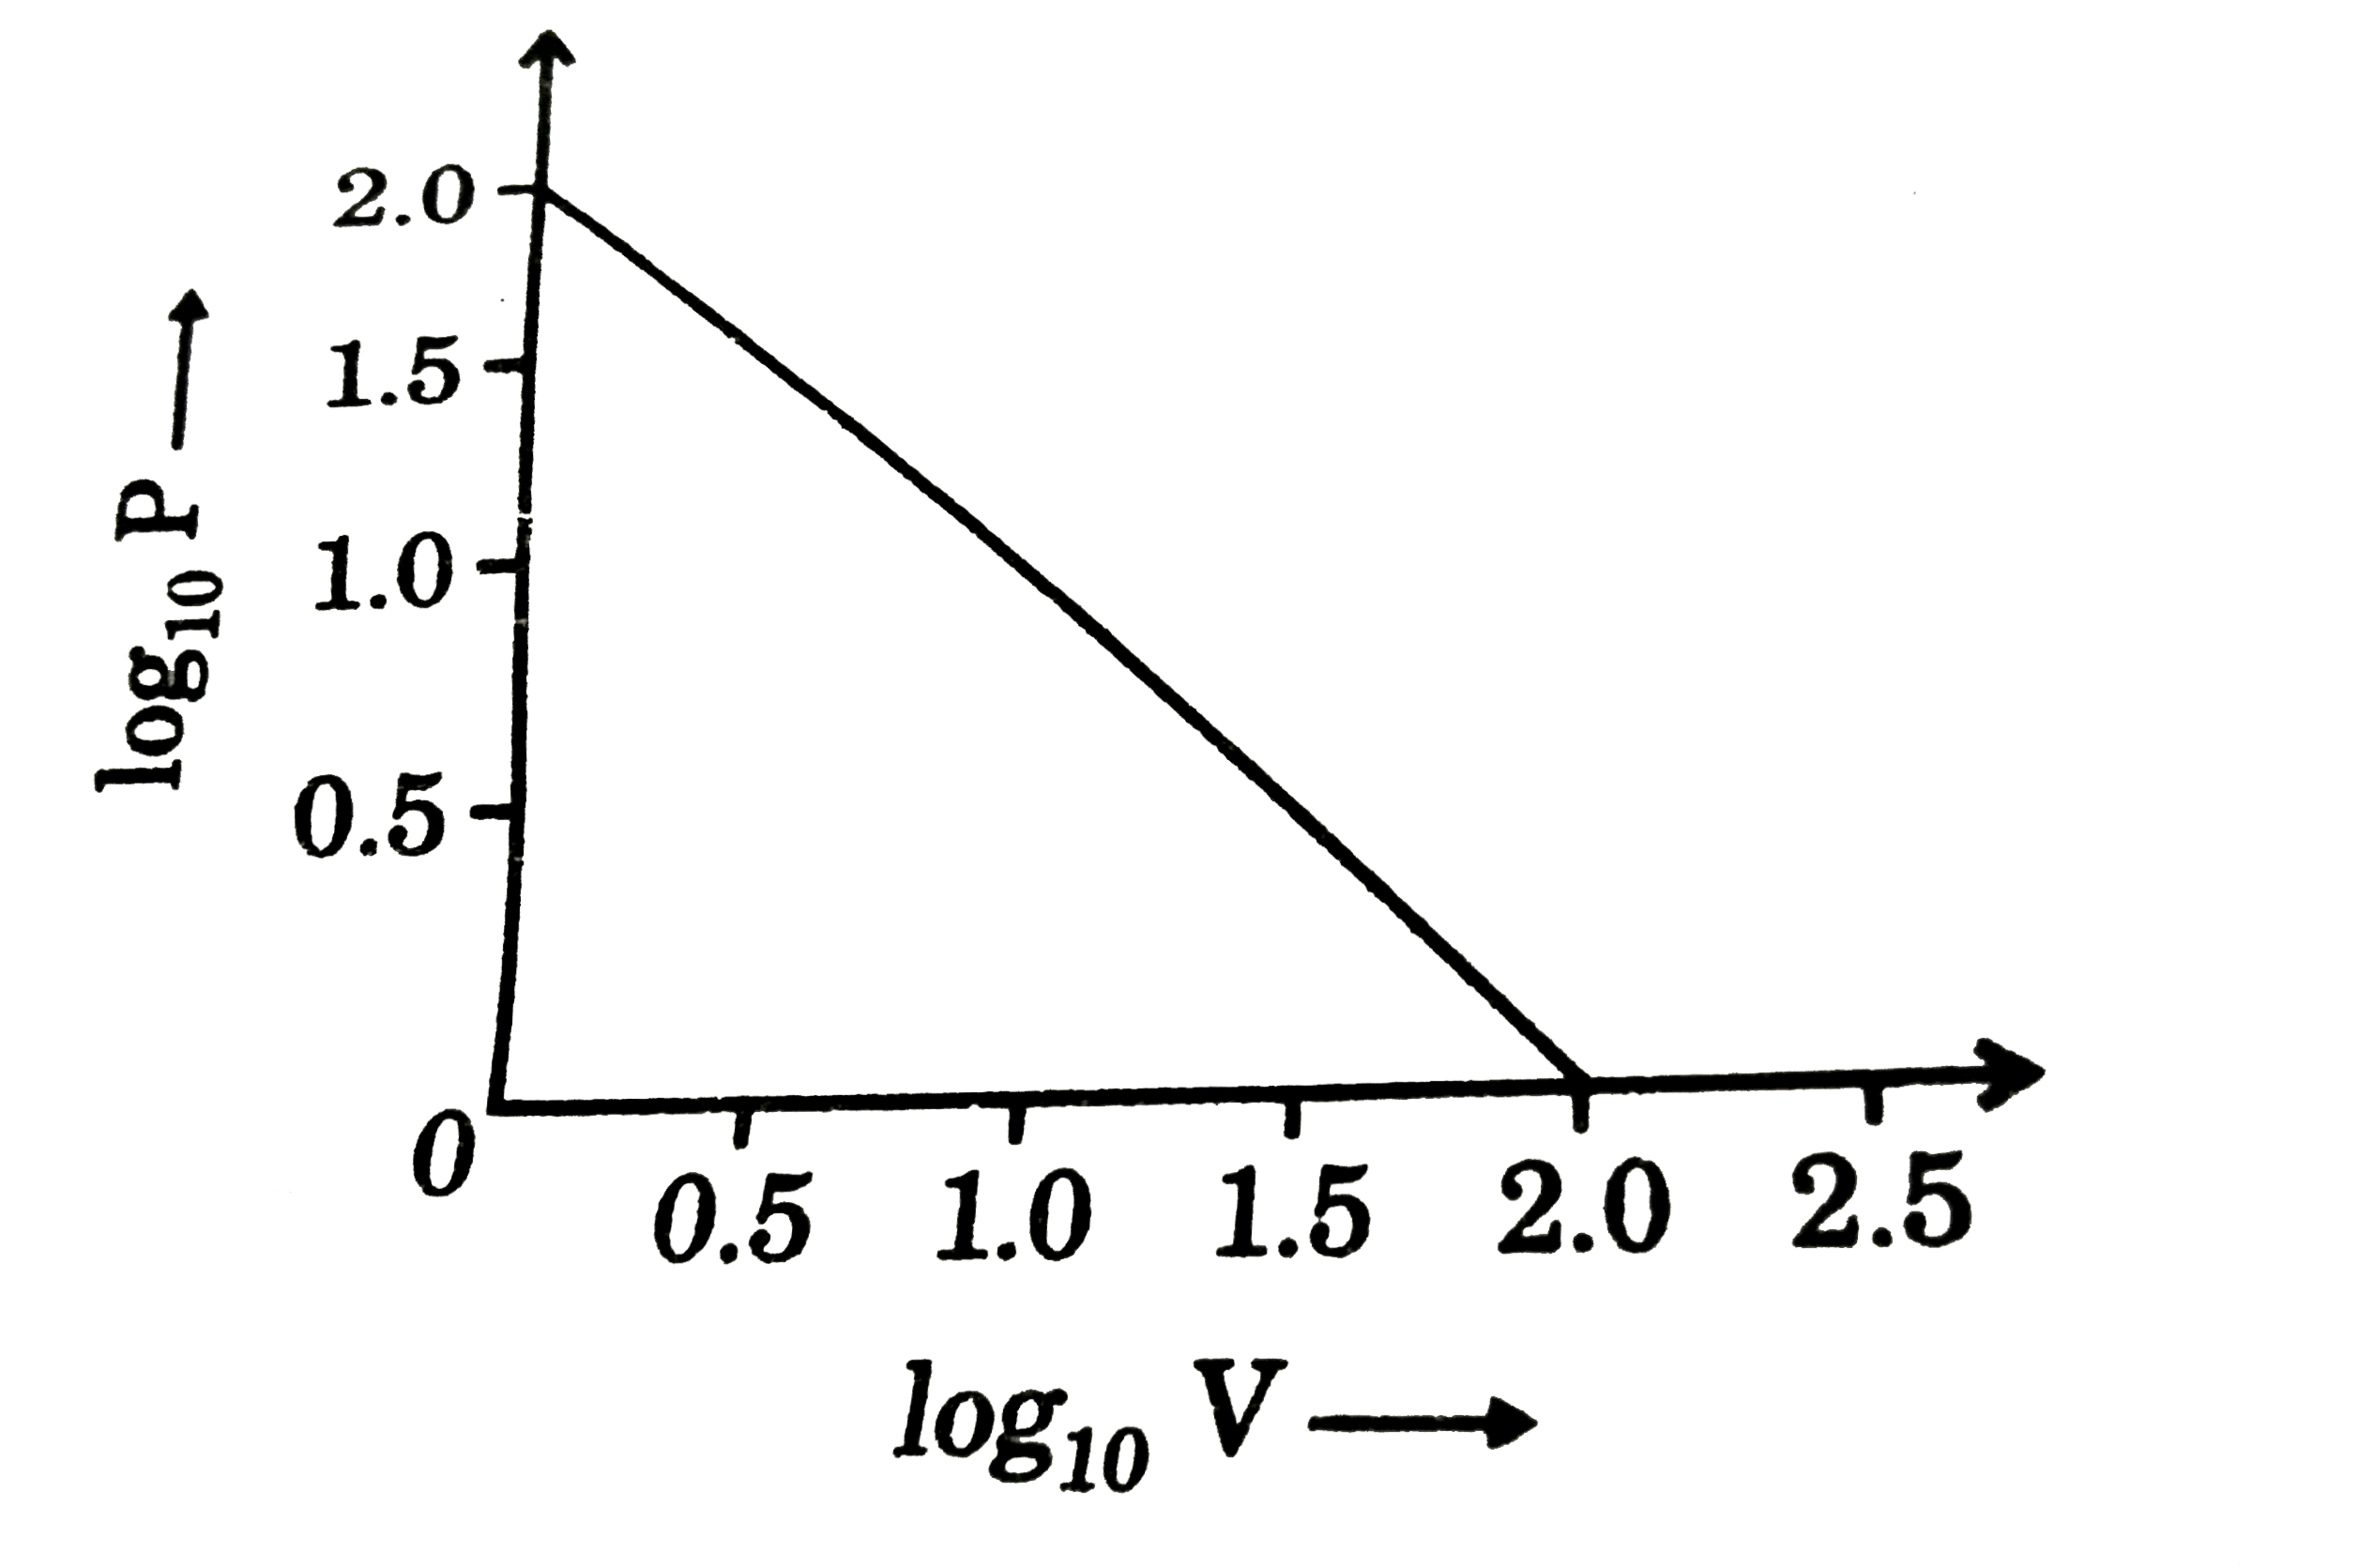
View SolutionFor the given isotherm (P in atm and V in L) for one mole of an ideal gas, which follows Boyle's law, what will be the approx value of temperature ? `(R = 0.0821 L "atm"//"mol" K)`
View SolutionGraph depicting correct behaviour of ideal gas and `H_(2)` gas will be (neglect a):
View SolutionDuring decomposition of `NH_(2)COONH_(2)(s)` reaction: `NH_(2) COONH_(4)(s) rarr 2NH_(3)(s)+CO_(2)(g)`. Which graph correctly represents average molecular weight of gaseous with progress of reaction :
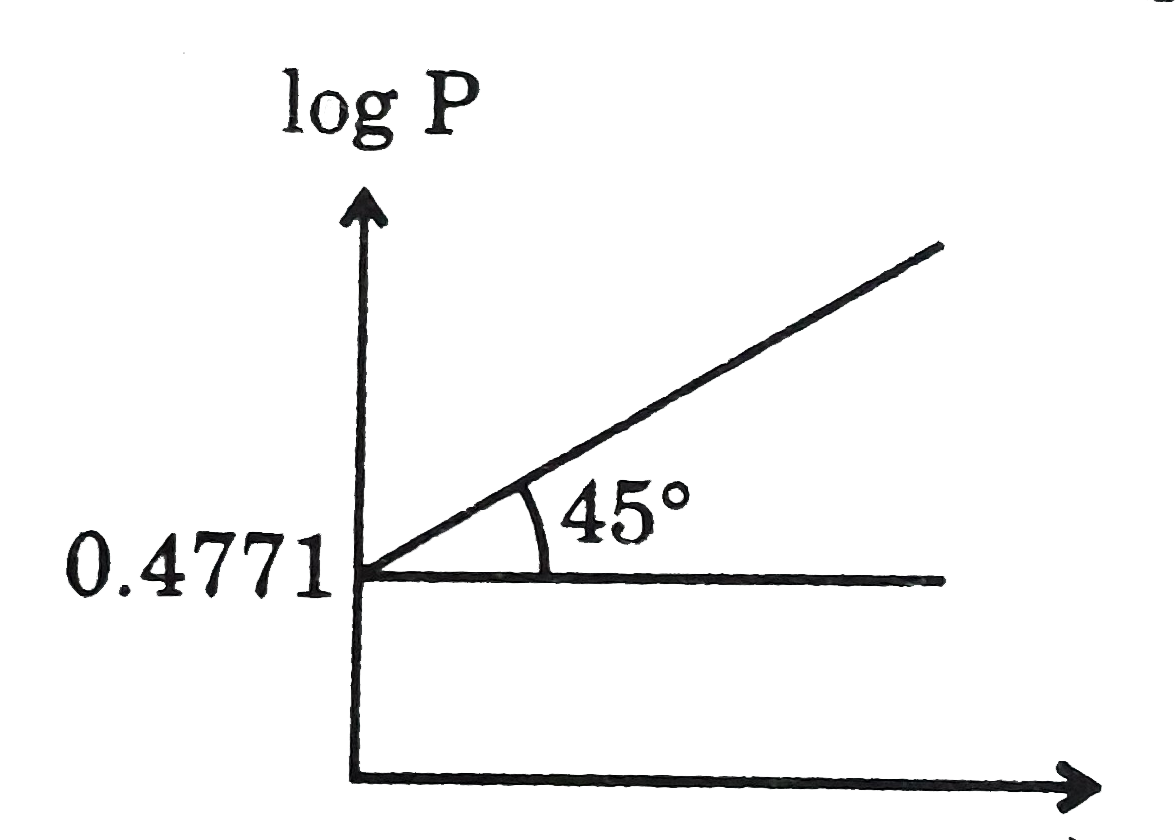
View SolutionFor an ideal gas kept in a container attached manometer as show. Find volume of container. For the given gas, lo P us log `(1//V)` graph is given :
View SolutionWhich of the following graphs is inconsistent with ideal gas behaviour ? (Assume n = constant)
View SolutionWhich one of these graphs for an ideal gas havinga fixed amount, the arrow indication, is incorrectly marked ?
View SolutionConsider the given graph: Graph is plotted for 1 mol of gas at 400K, find slope of curve [take: `R = 0.08(L-atm)/(mol-K)]`
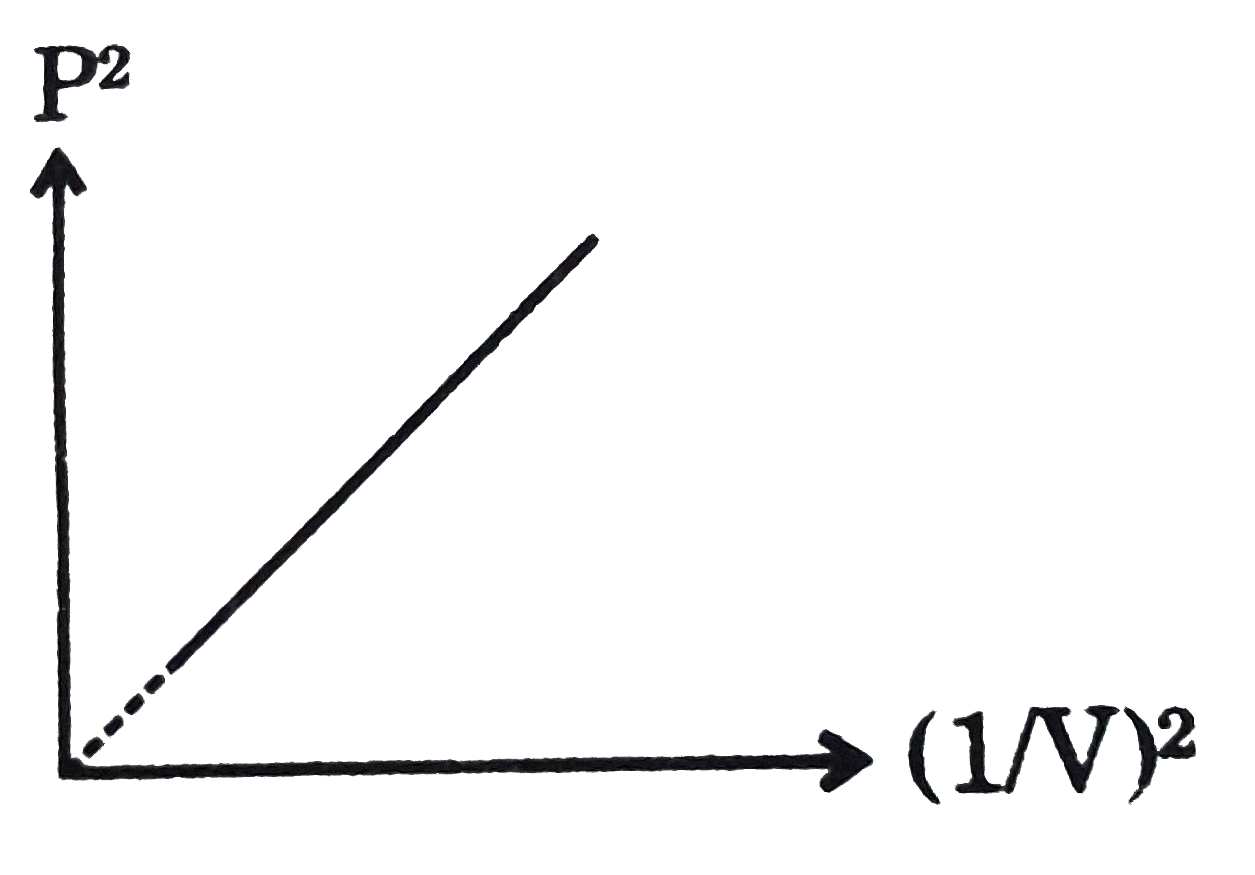
View SolutionThe pressure P of a gas is plotted against its absolute temperature T for two different constant volumes, `V_(1)` and `V_(2)` (for same no. of moles) where `V_(1) gt V_(2)`, the correct statement is:
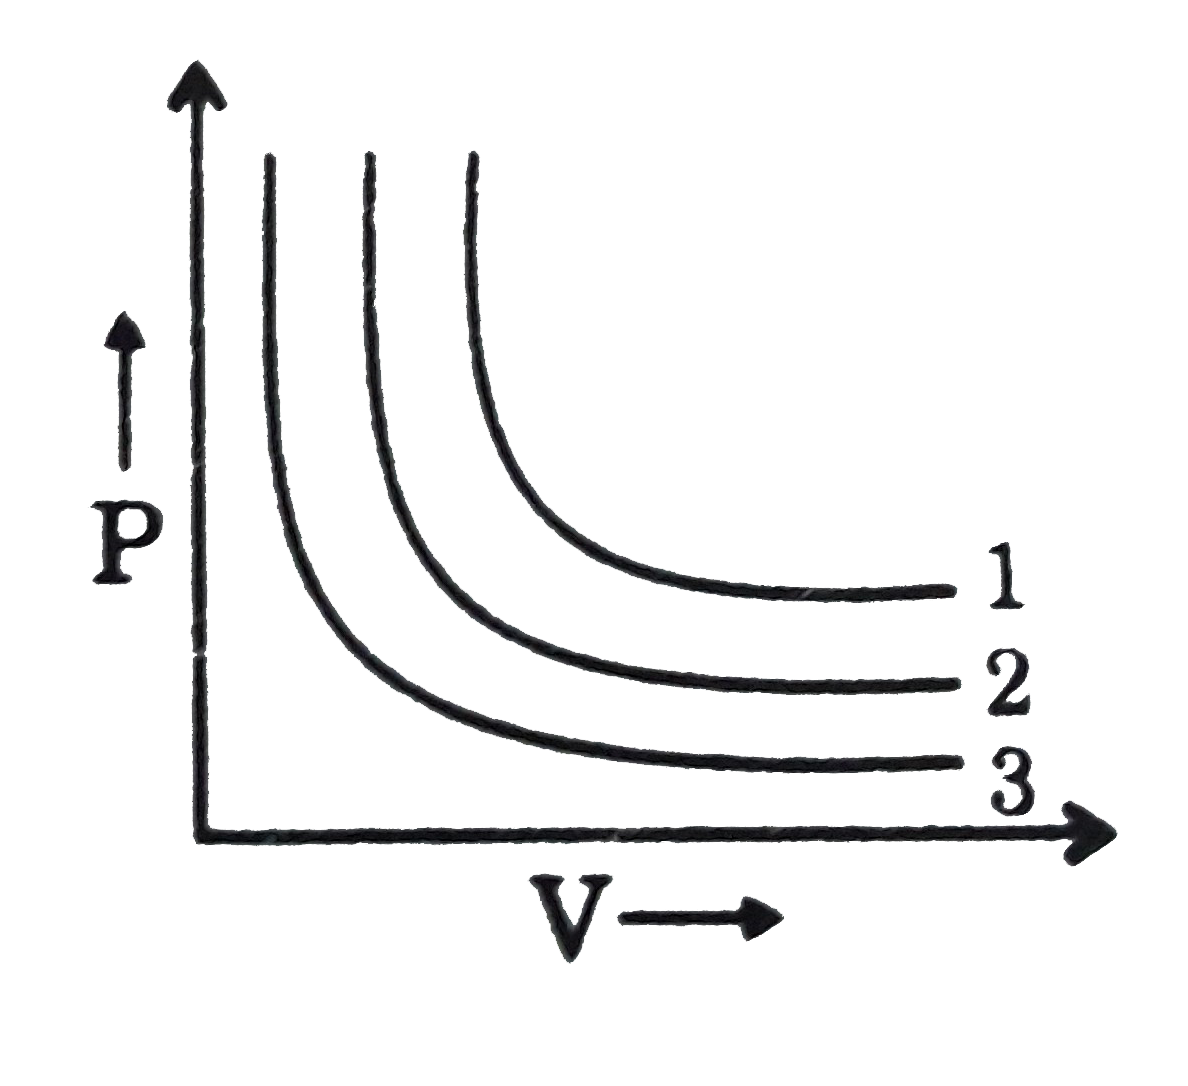
View SolutionP us V curves were plotted for three different samples containing same masses of `H_(2), O_(2)` and `N_(2)` at same temp. Mark out which graph is applicable for which sample.
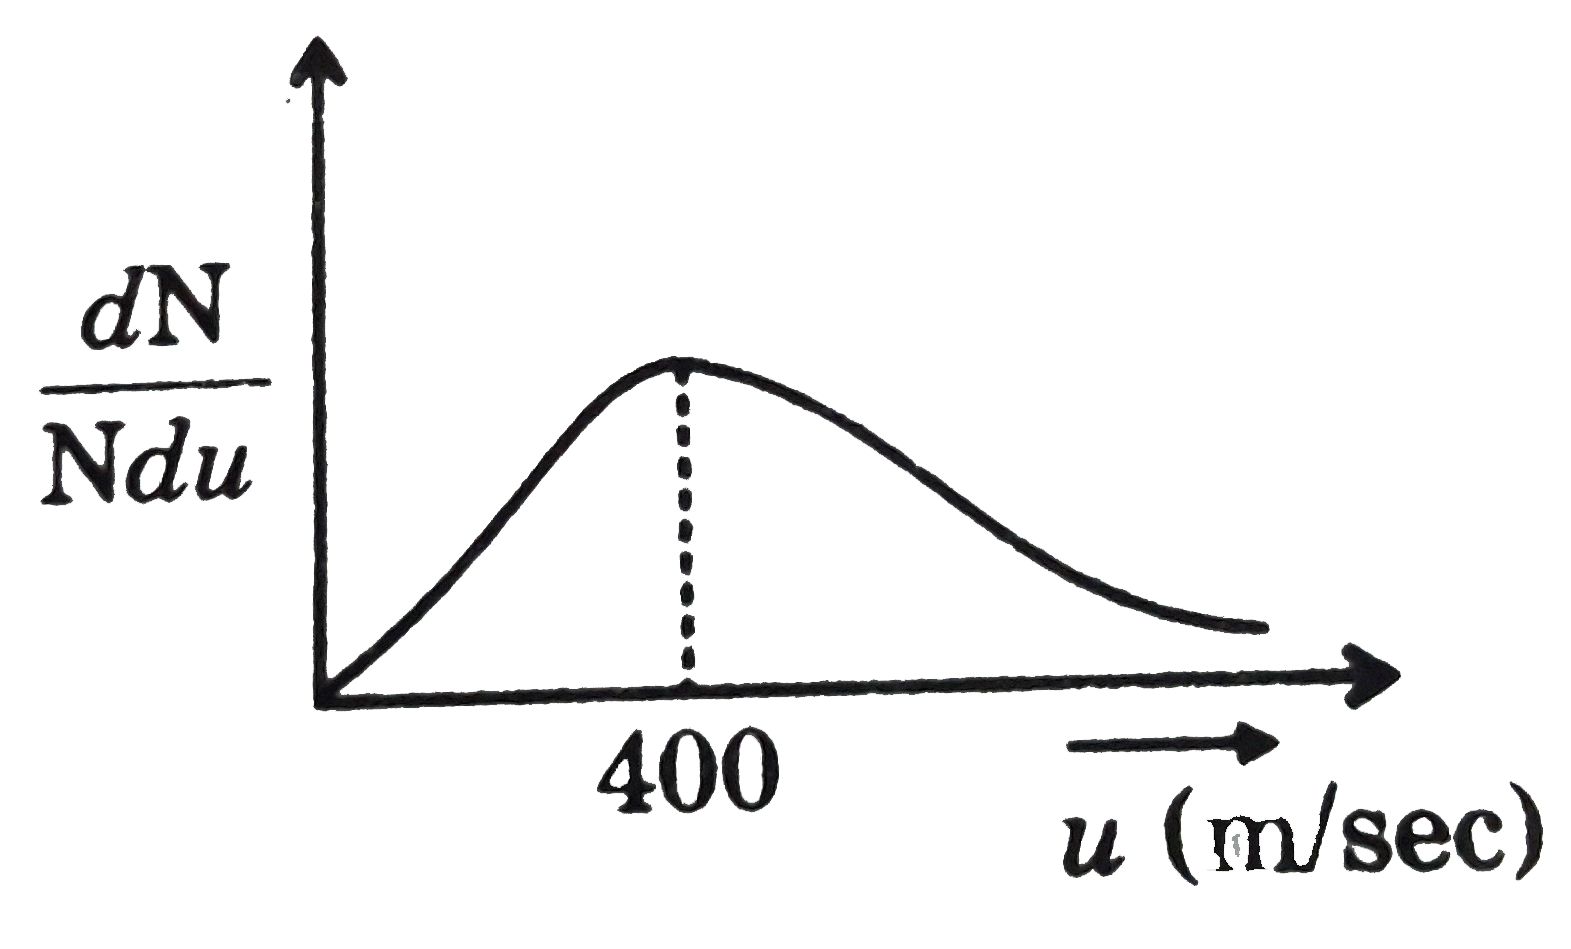
View SolutionFor ideal gas, observation as per Maxwell distribution
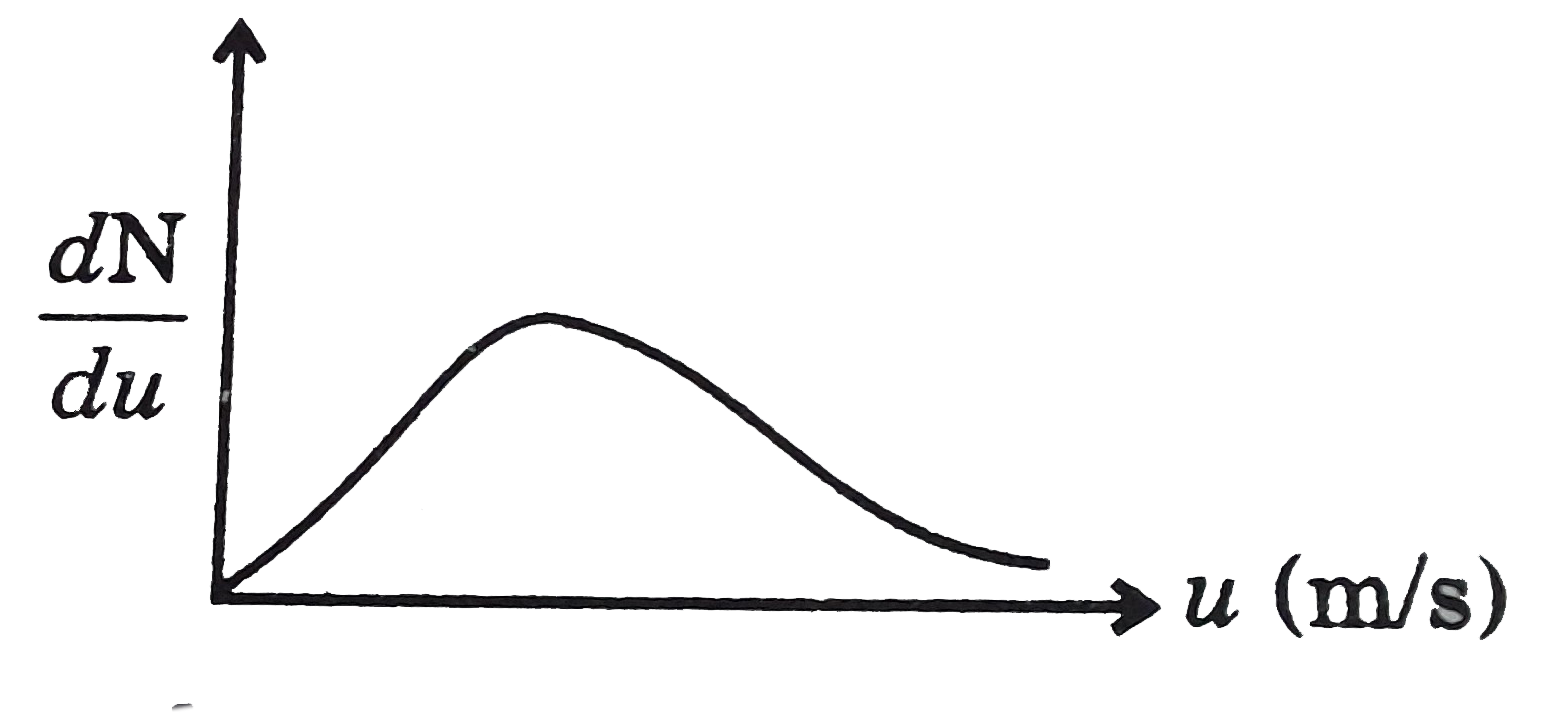
View SolutionIn the given curve total area under the graph represents:
View SolutionWhich graph is not a straight line for an ideal gas ?
View SolutionConsider the following statements.
(a) An oleum sample can be labelled as `127%`
(b) Mole fraction is temperature dependent
(c) Slope of log V us log T graph is constant. (At constant P and n for ideal gas).
(d) 1 gm of `C_(6)H_(12)O_(6)` contains more number of atoms than 1 gm of `CH_(3)COOH`.
(e) Intercept of log P vs log `(1//T)` is always positive. (At constant V and n for ideal gas)
Select the correct code regarding true and false statement.
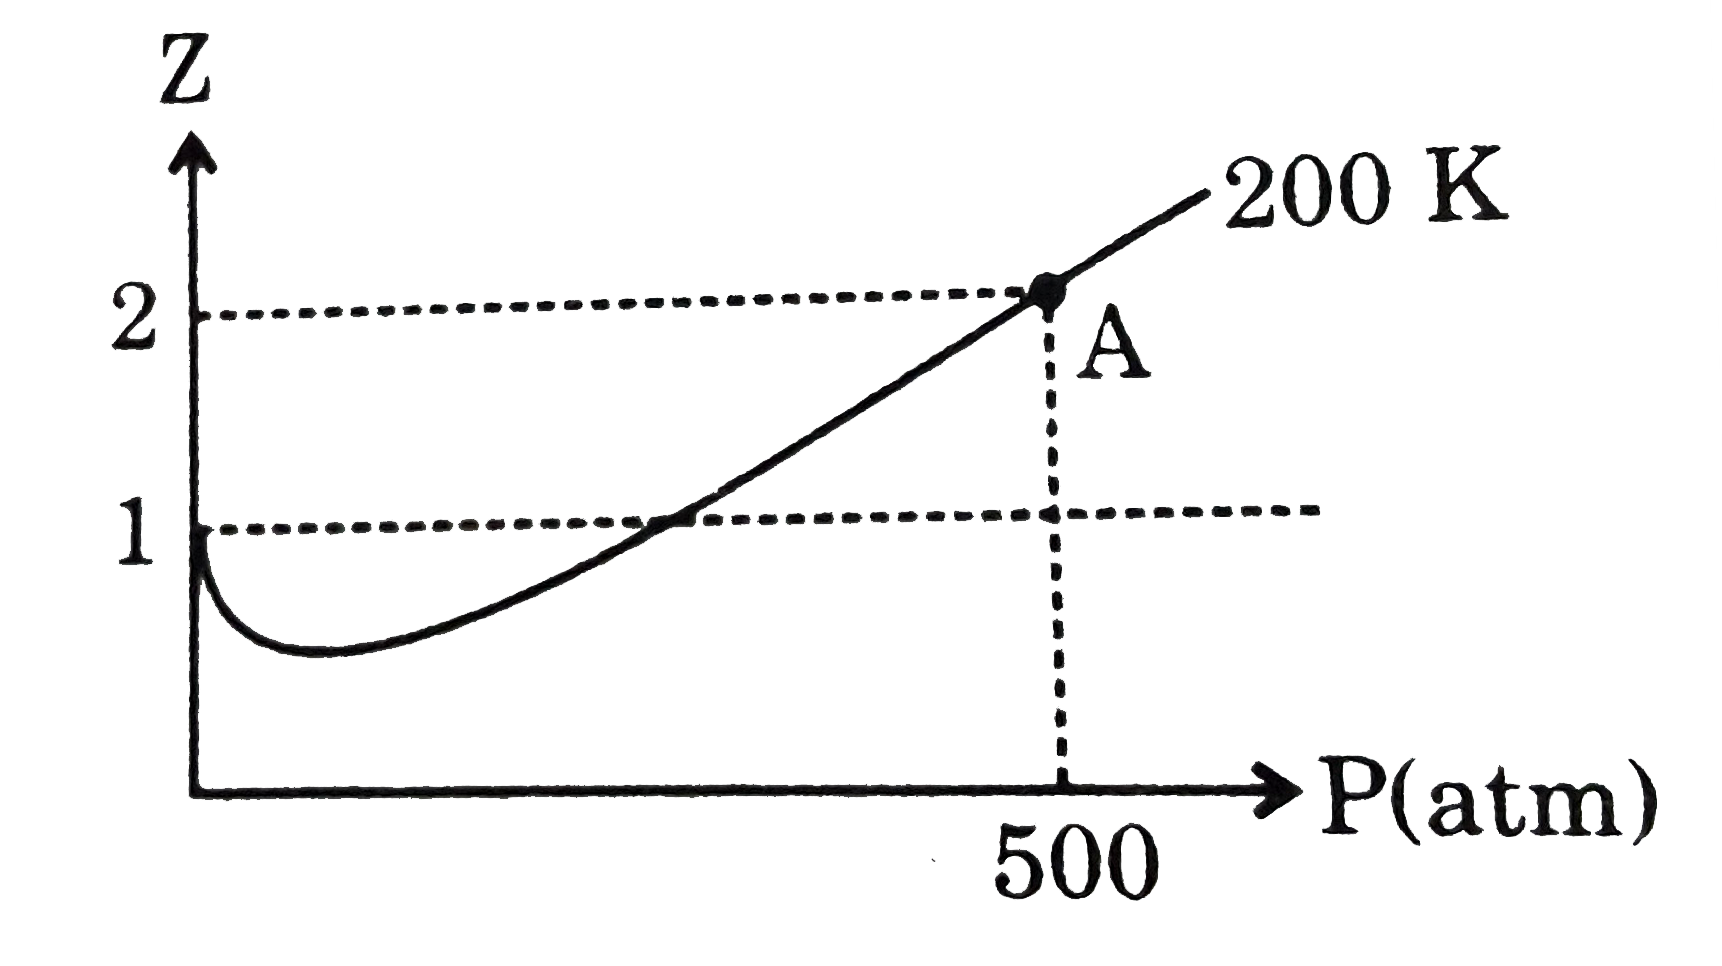
View SolutionZ us P graph is plotted for 1 mole of hypothetical gas. Volume of gas at this point A is: `[R = 0.08 atm L//"mole"-K]`
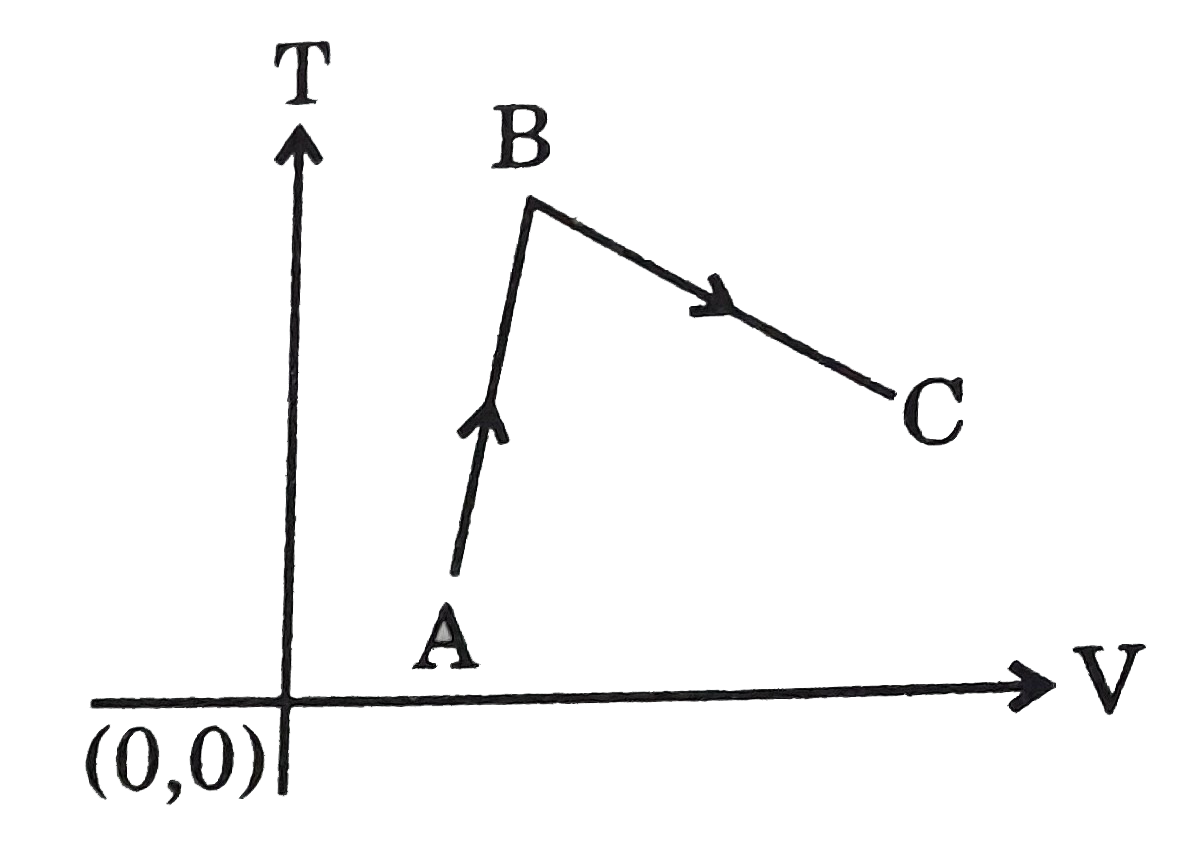
View SolutionIn the given isobaric process shown by graph between T and V.
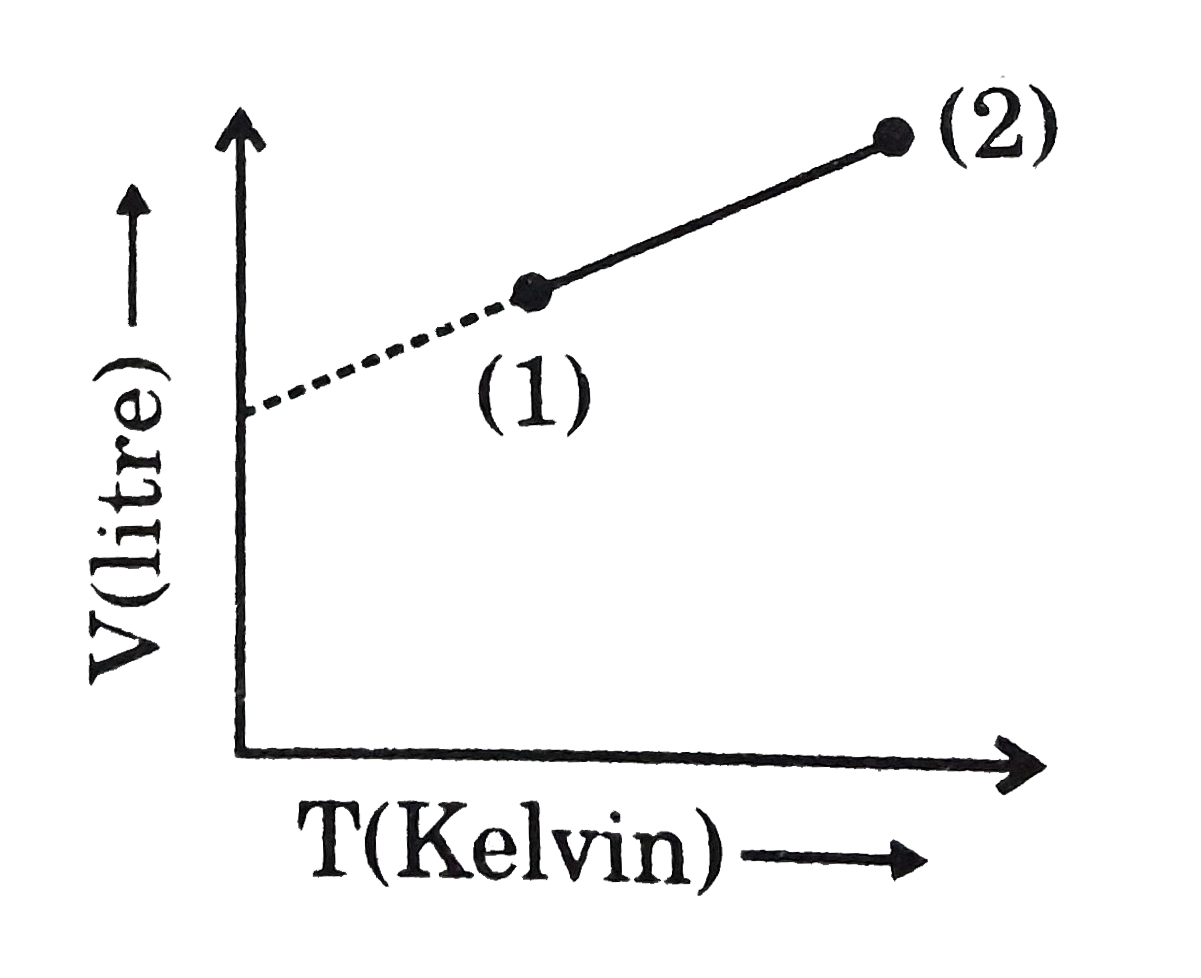
View SolutionFor the below graph which of the following combination is correct, (n represents mole and P represent pressure)
(I) If n is constant throughout then P at 2nd point must be greater than at 1st point.
(II) If n is doubled in moving from 1st point to 2nd point then P also doubles in the process.
(III) If n is constant then P is maximum at point (1).
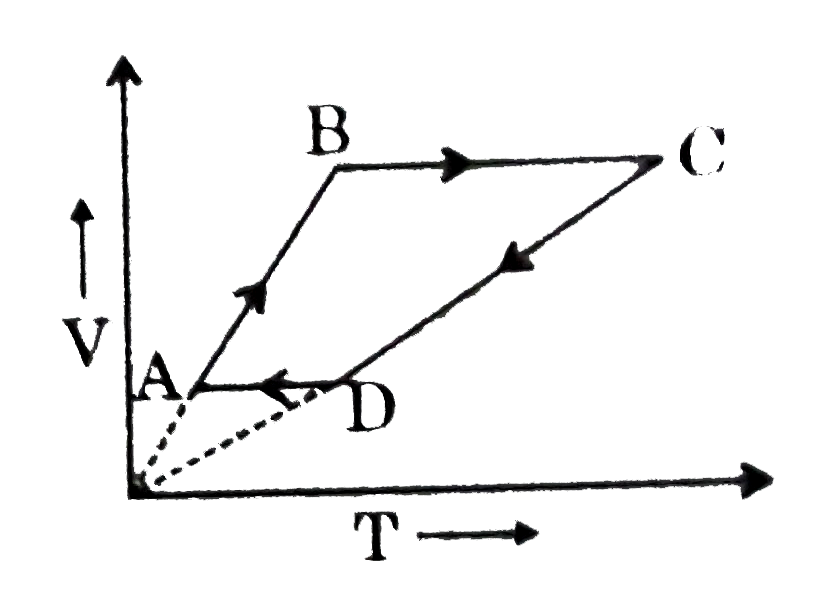
View SolutionA cyclic process ABCD is shown in VT diagram for an ideal gas. Which of the following diagram represents the same process ?
View SolutionA gas is taken isochorically from state A to state C as shown in the graph. Choose the correct statement:
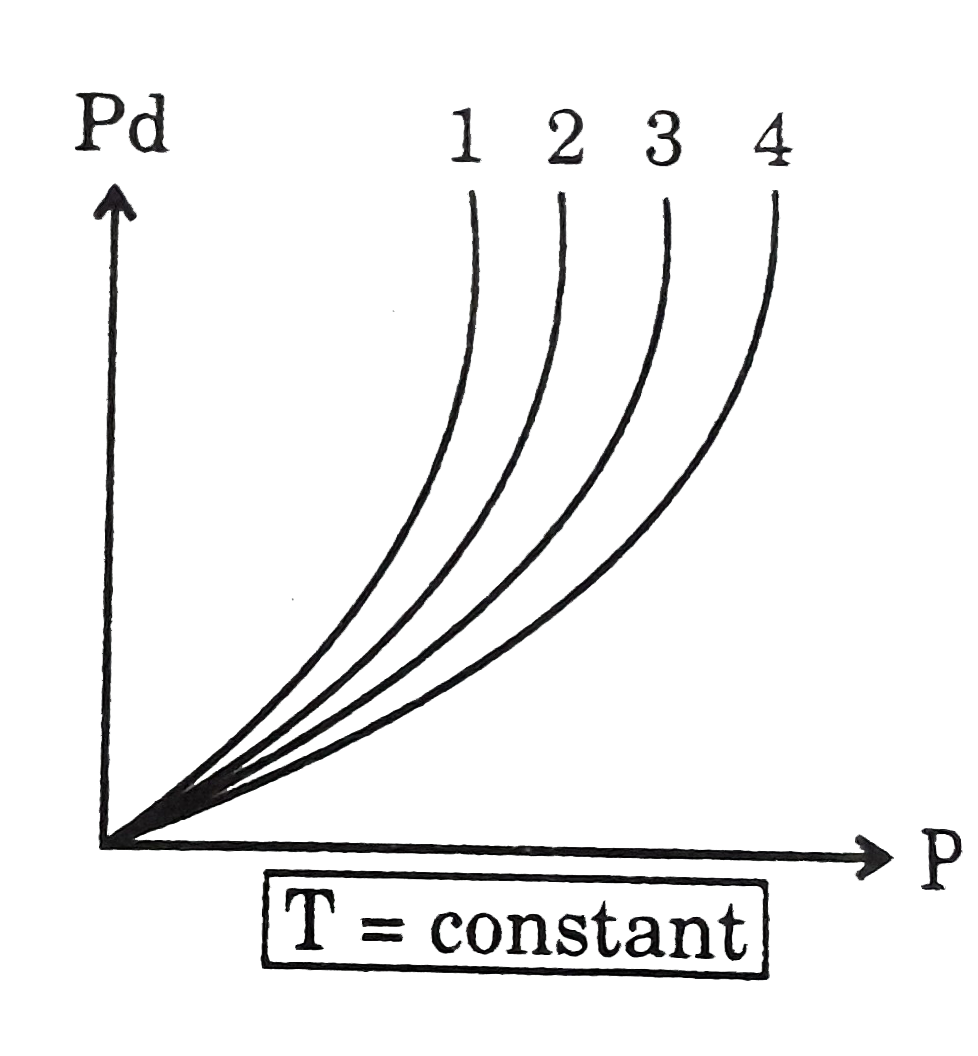
View SolutionAt 273 K, Pd vs P is plotted for various gases 1,2,3,4 assuming ideal behaviour for gases `N_(2), He,CO_(2)` and `H_(2)`. The correct combination is [P denotes combination in atmosphere and d denotes density in gm/L:
View Solution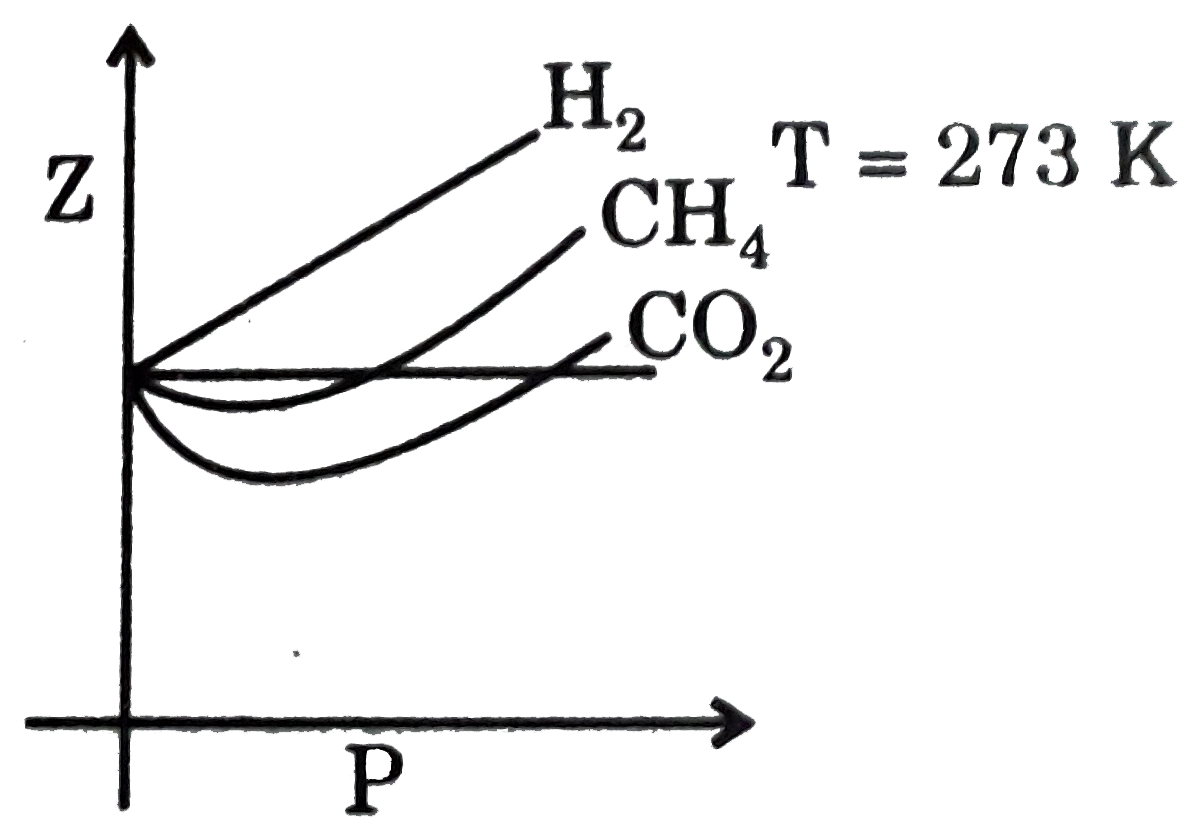
If the above plot is replotted at 373 K, then which of the following plots may show the correct behaviour at 373 K ?
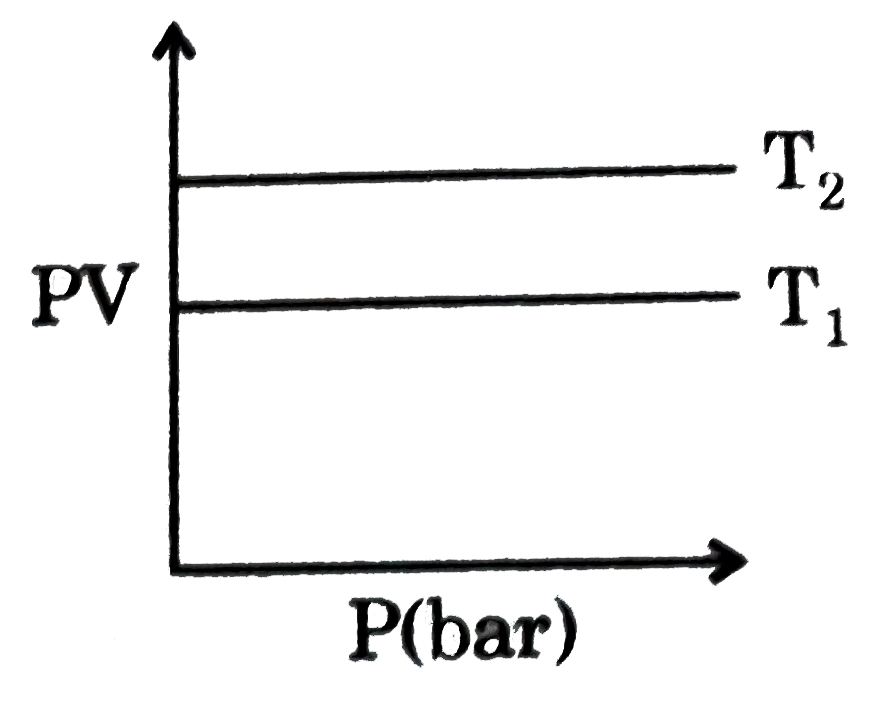
View SolutionThe product of PV is plotted against P at two temperatures `T_(1)` and `T_(2)` and the result is shown in figure. What is correct about `T_(1)` and `T_(2)`?
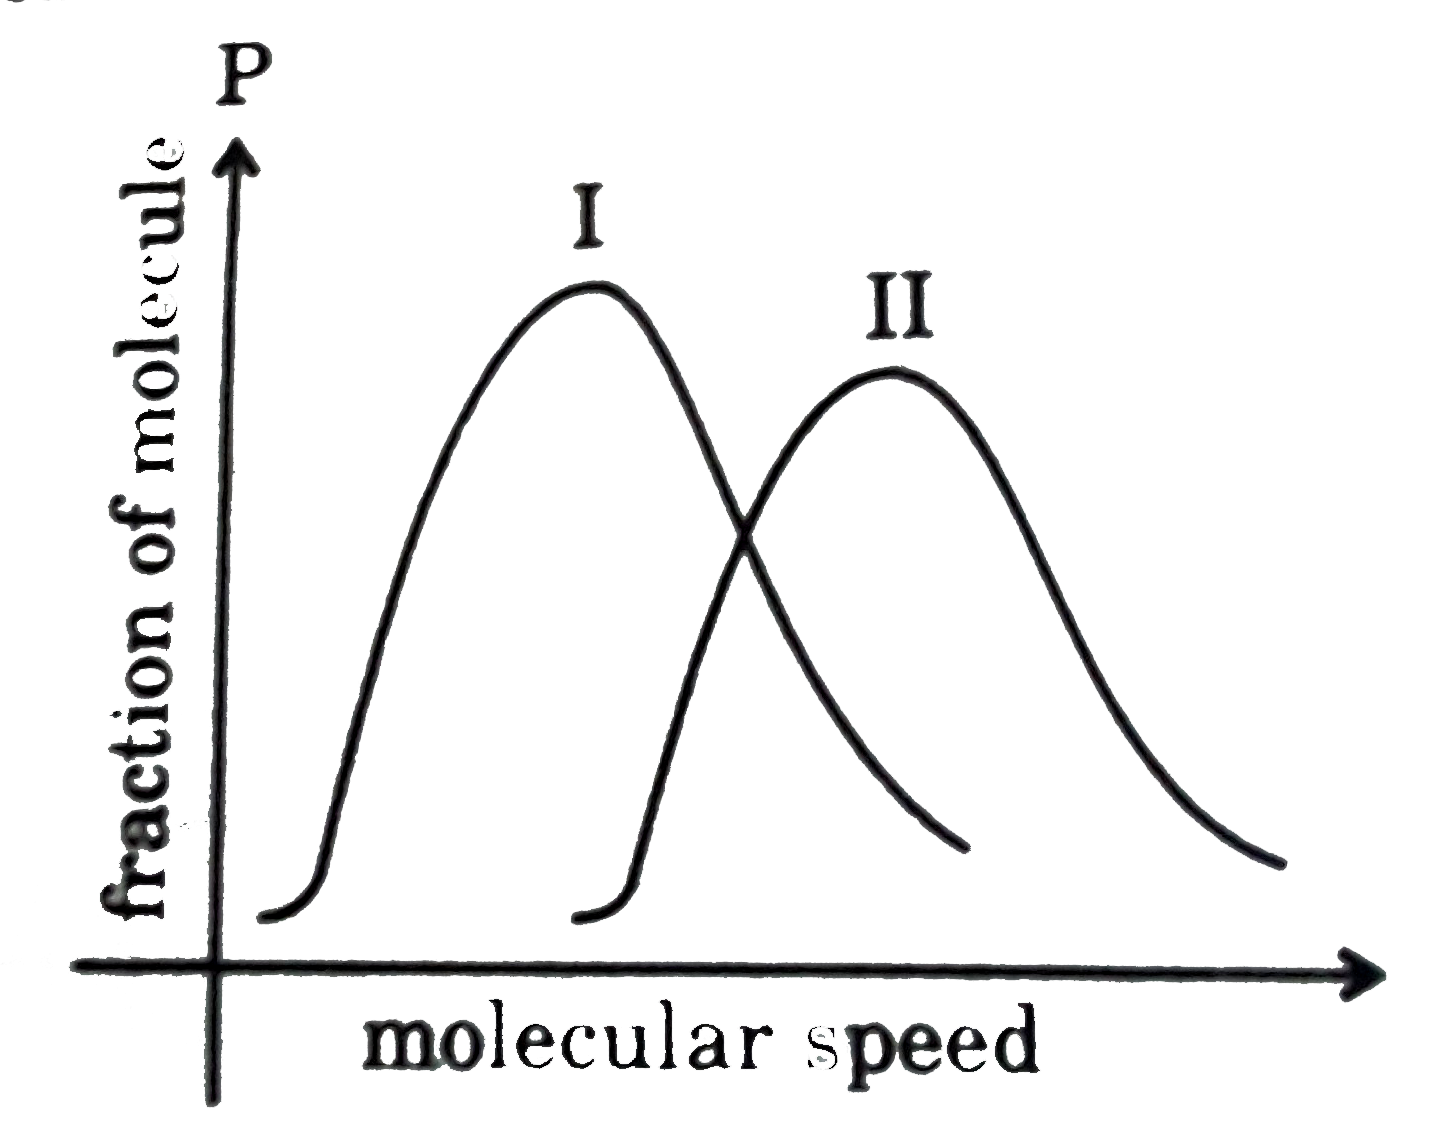
View SolutionThe graphs representing distribution of molecular speeds at 300 K for gases `CI_(2)` and `N_(2)` are as shown below (Atomic mass `N = 14, CI = 35.5)`:
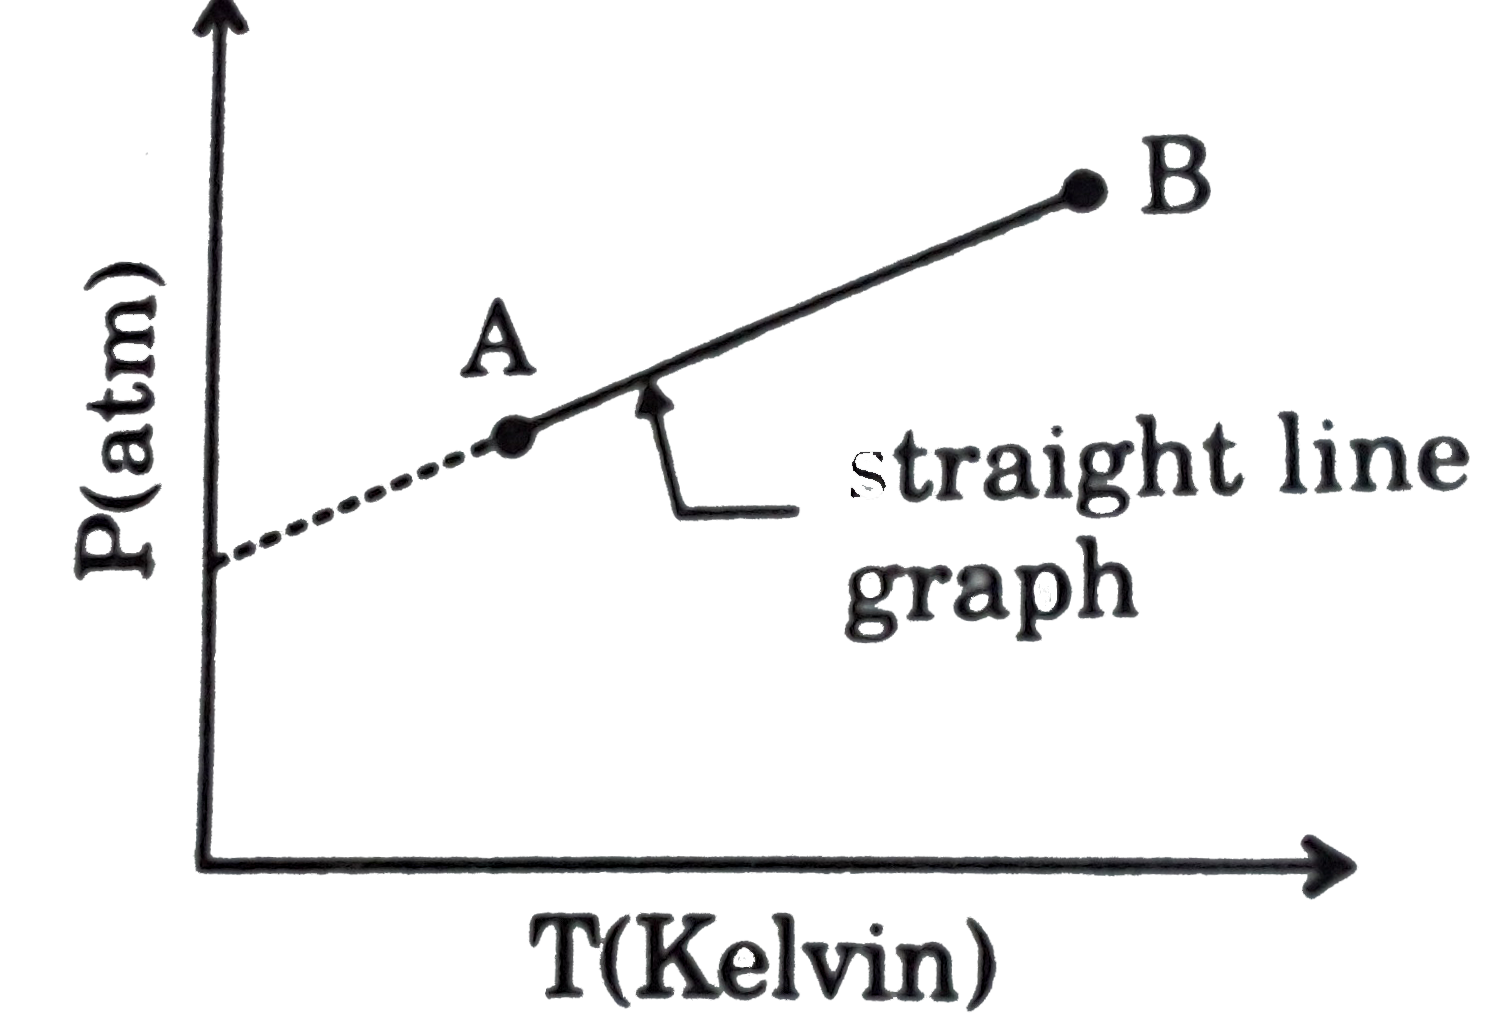
View SolutionFor a fixed amount of an ideal gas P us T plot is given as shown. Identify the correct option.
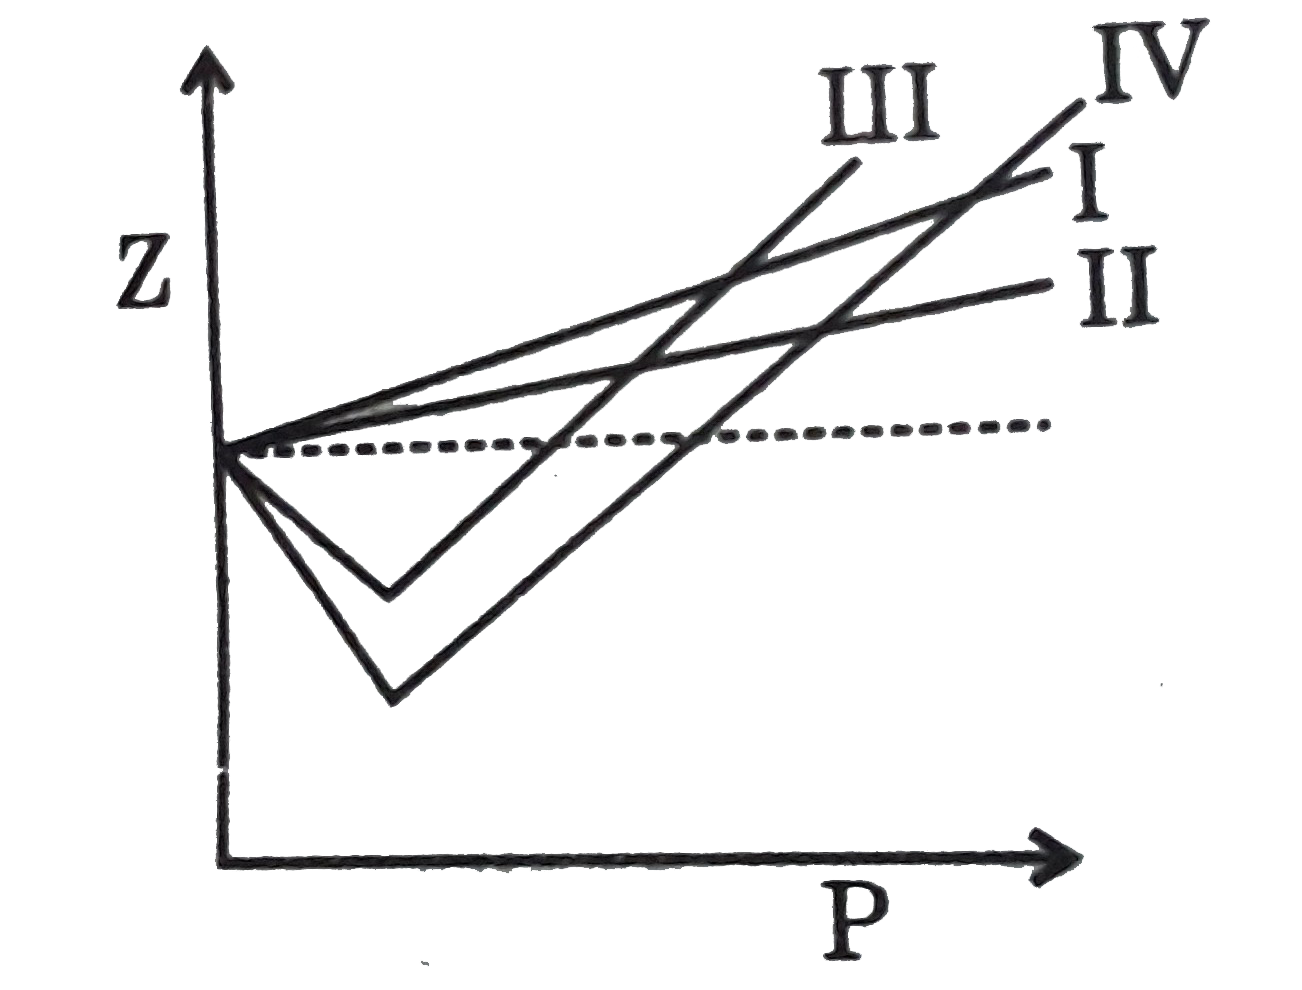
View SolutionWhich of the following options correctly match the graph of Z us P at normal temperature with gases ?
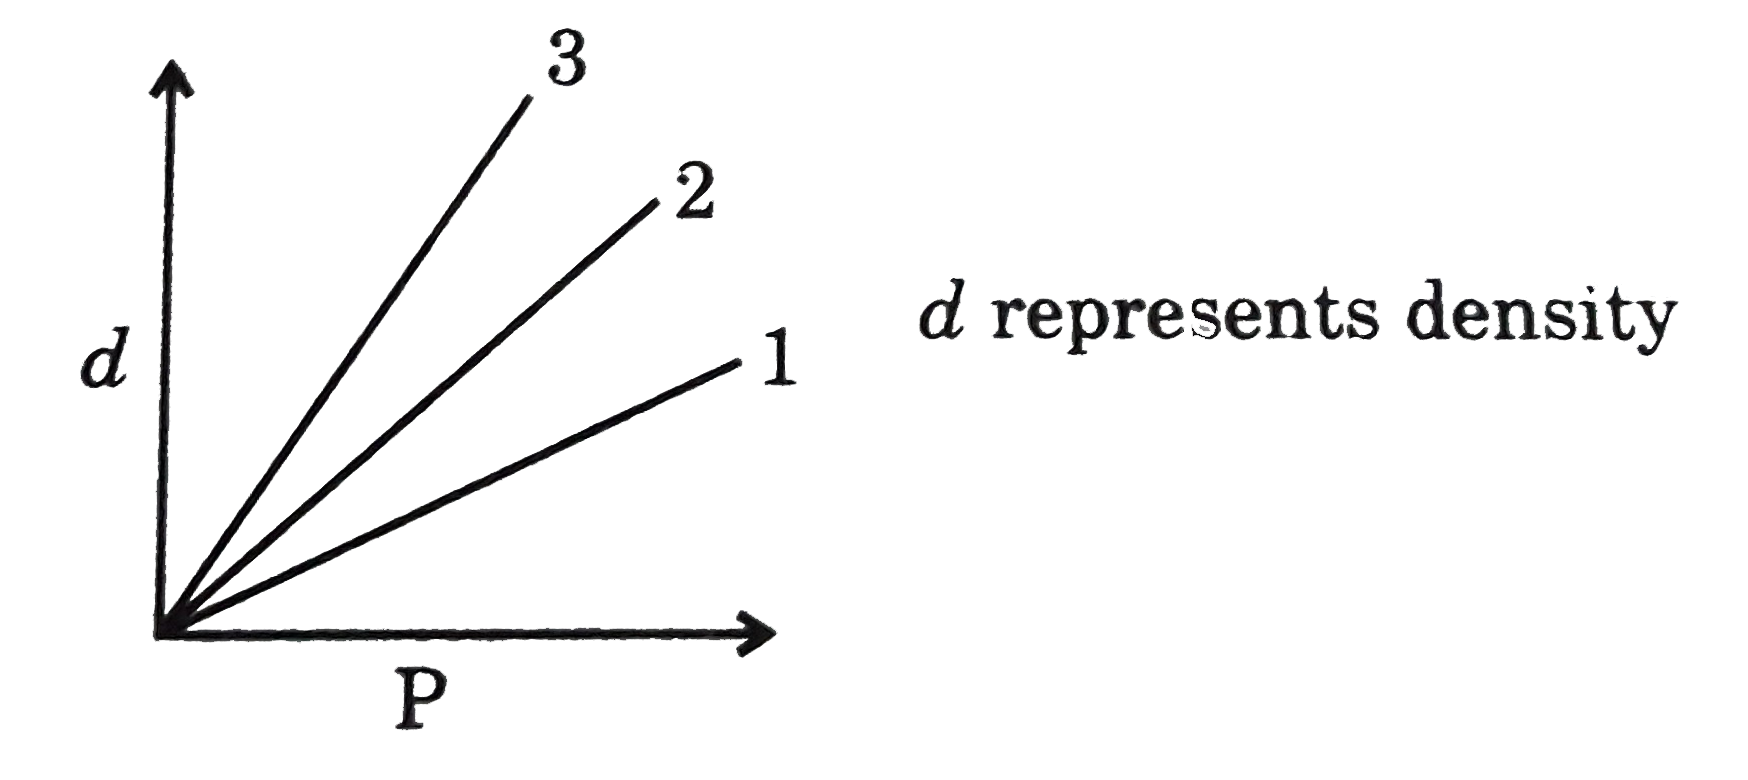
View SolutionFollowing graphs are obtained when different gases are subjected to change in pressure at constant temperature. Identify the option which has correctly matched gas wth the graph.
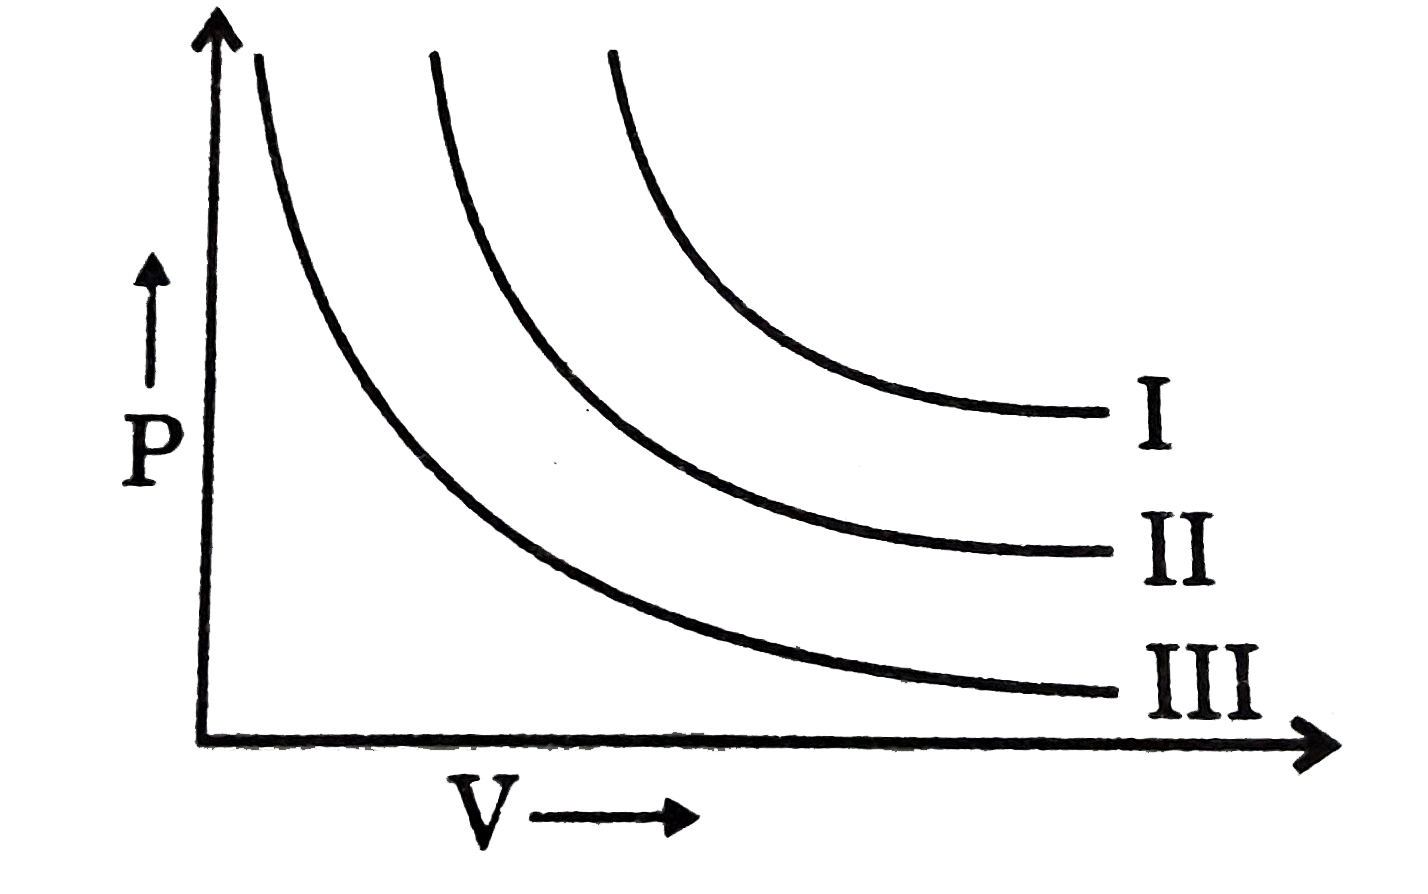
View SolutionI,II,III are three isotherms respectively at `T_(1),T_(2)` and `T_(3)` for a fixed mass of gas, as shown in graph. Temperature will be in order :
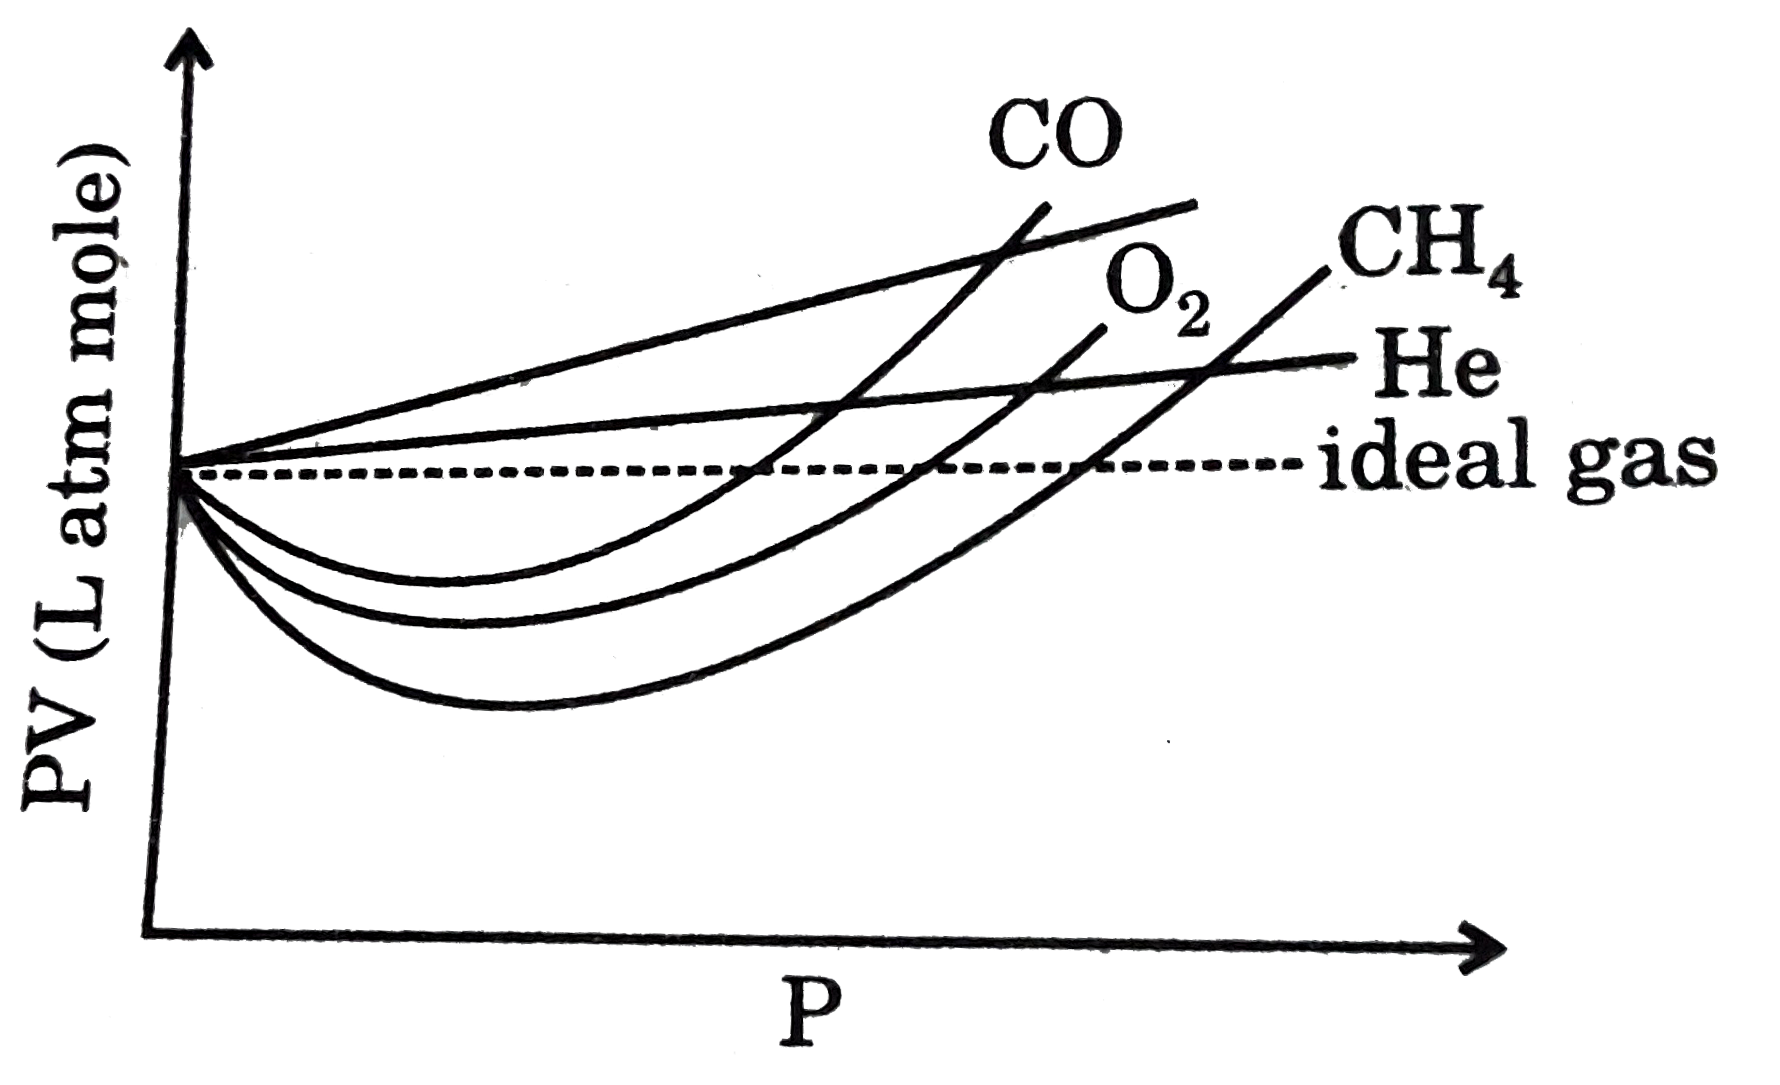
View SolutionThe curve of pressure volume (PV) against pressure (P) of the gas at a particular temperature is as shown, according to the graph. Which of the following is incorrect (in the low pressure region)?
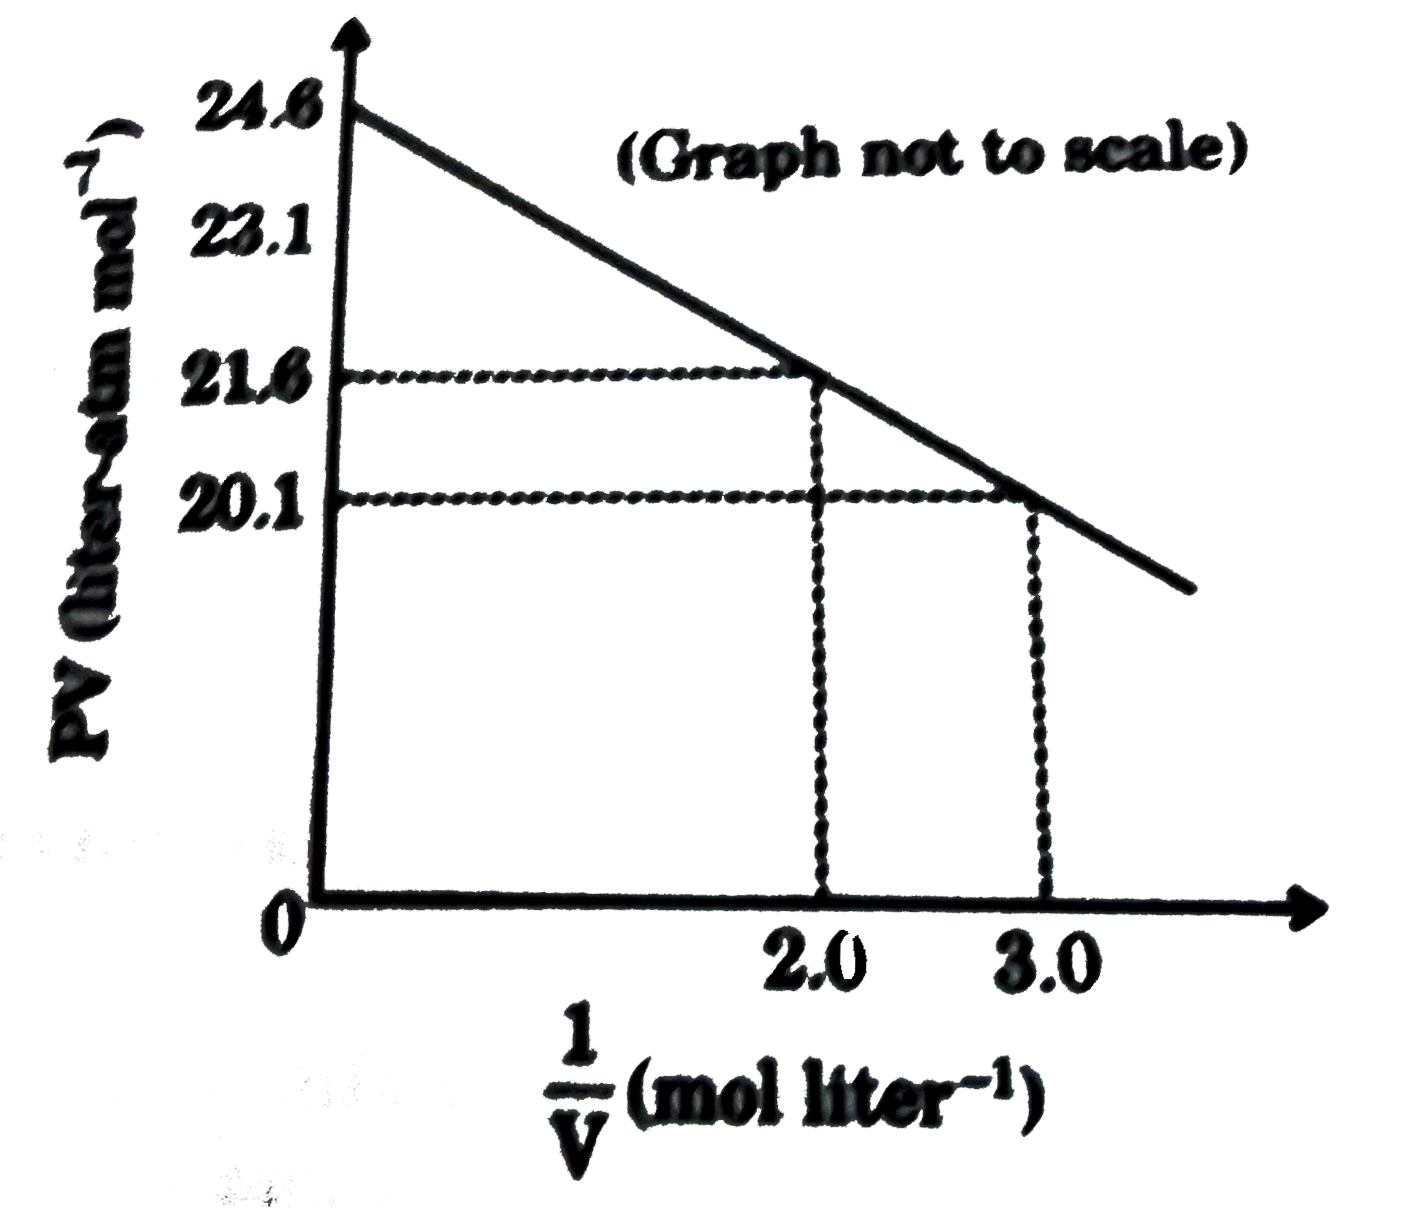
View SolutionFor one mole of a van der Waal's gas when `b = 0` and `T = 300K`, the `PV` us `1//V` plot is shown ahead. The value of the van der Waal's constant a(atm. `"litre"^(2) mol^(-2))` is:
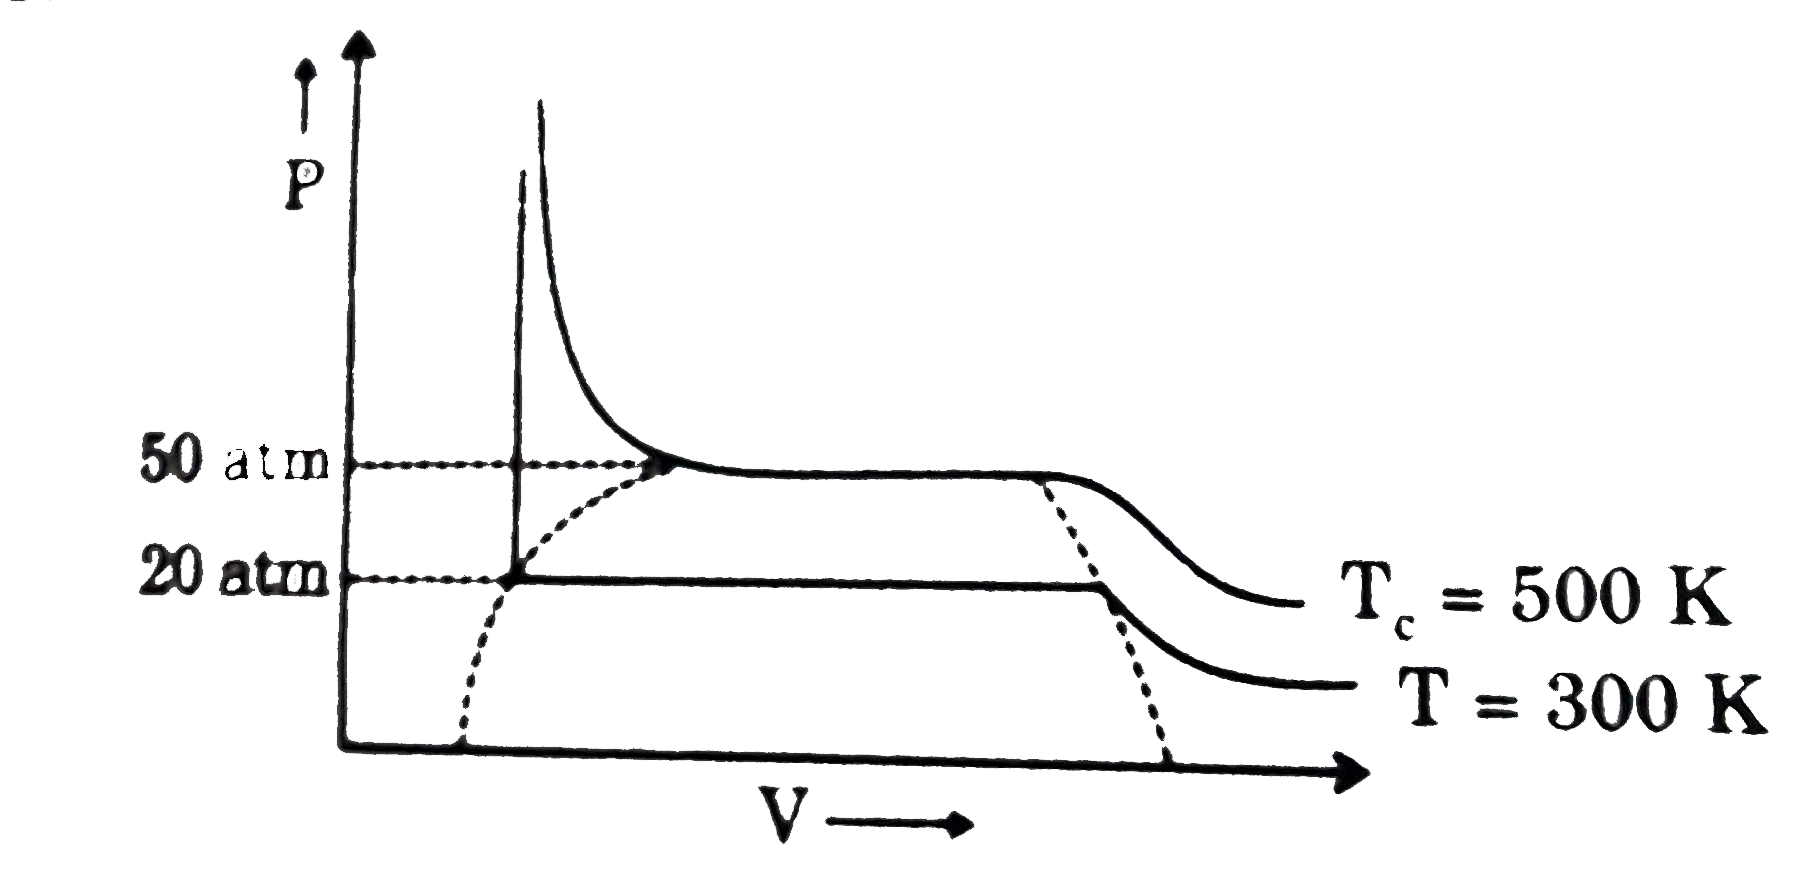
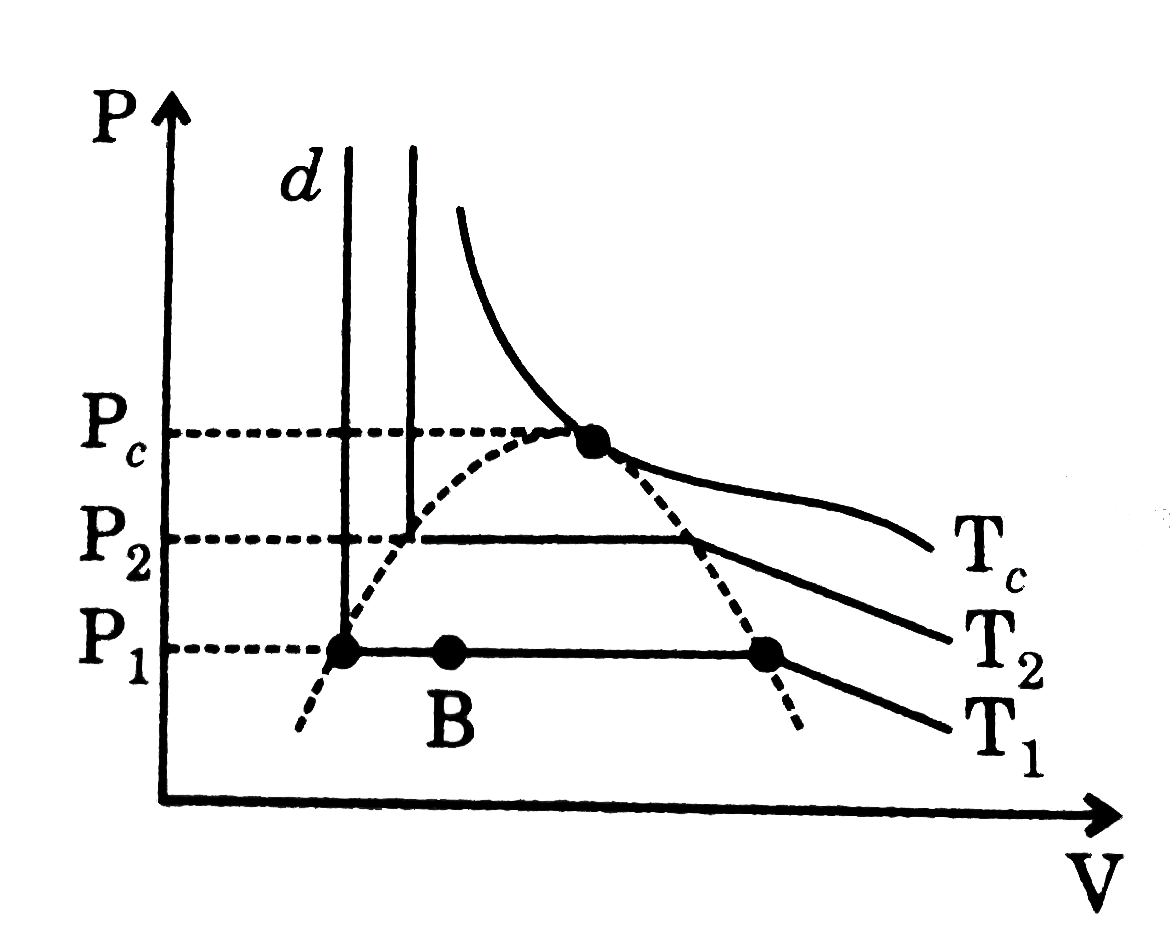
View SolutionFor a real gas the P-V curve was experimentally plotted and it had the following appearance. With respect to liquefaction, choose the correct statement.
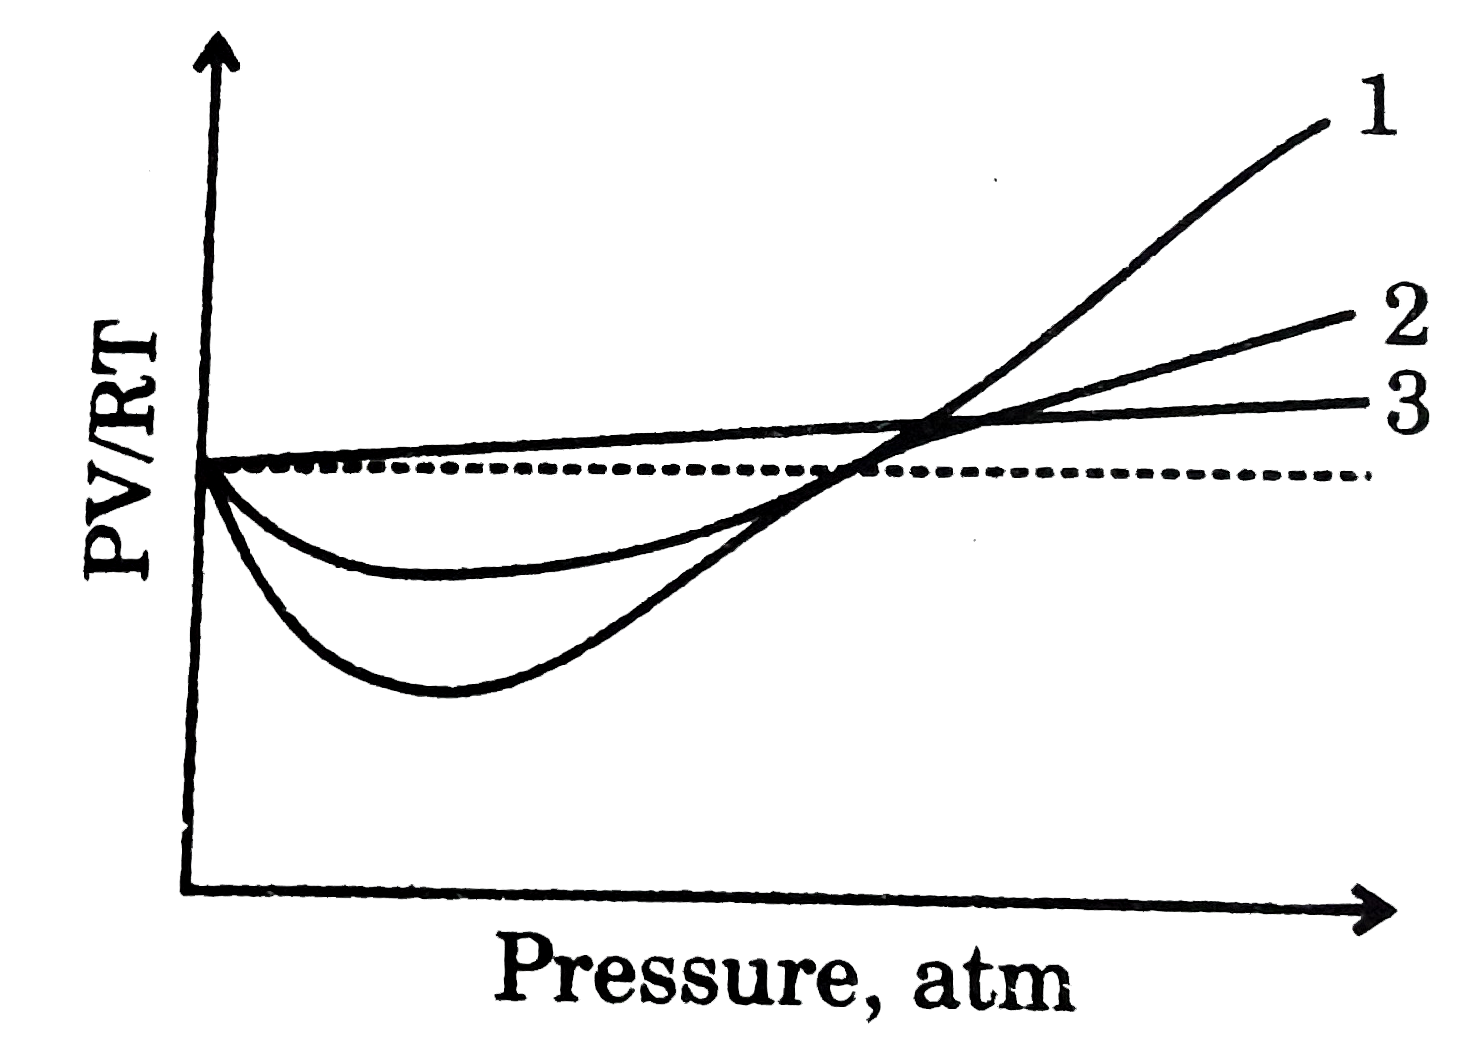
View SolutionThe curve in the accompanying diagram represent the `PV//RT` behaviour of the gases: `He, CH_(4)` and `C_(3)H_(8)`. Which assignment of behavior for gas is correct ?
View SolutionGas A (1 mol) dissociates in a closed rigid container of volume `0.16` lit. as per following reaction.
`2A(g) rarr 3B(g) +2C(g)` If degree of dissociation of A is `0.4` and remains constant in entire range of temperature then the correct P us T graph is: [Given `R = 0.08` lit-atm/mol/K]
View SolutionWhich of following graphs correctly represent variation of `alpha = (-(dV//dP)_(T))/(V)` with P for fixed amount of an ideal gas at constant temperature ?
View SolutionWhich of the following volume-temperature `(V-I)` plots represents the behaviour of `1 "mole"` of an ideal gas at the atmospheric pressure?
View SolutionSelect the incorrect statements on the basis of curve given below for real gas(A).
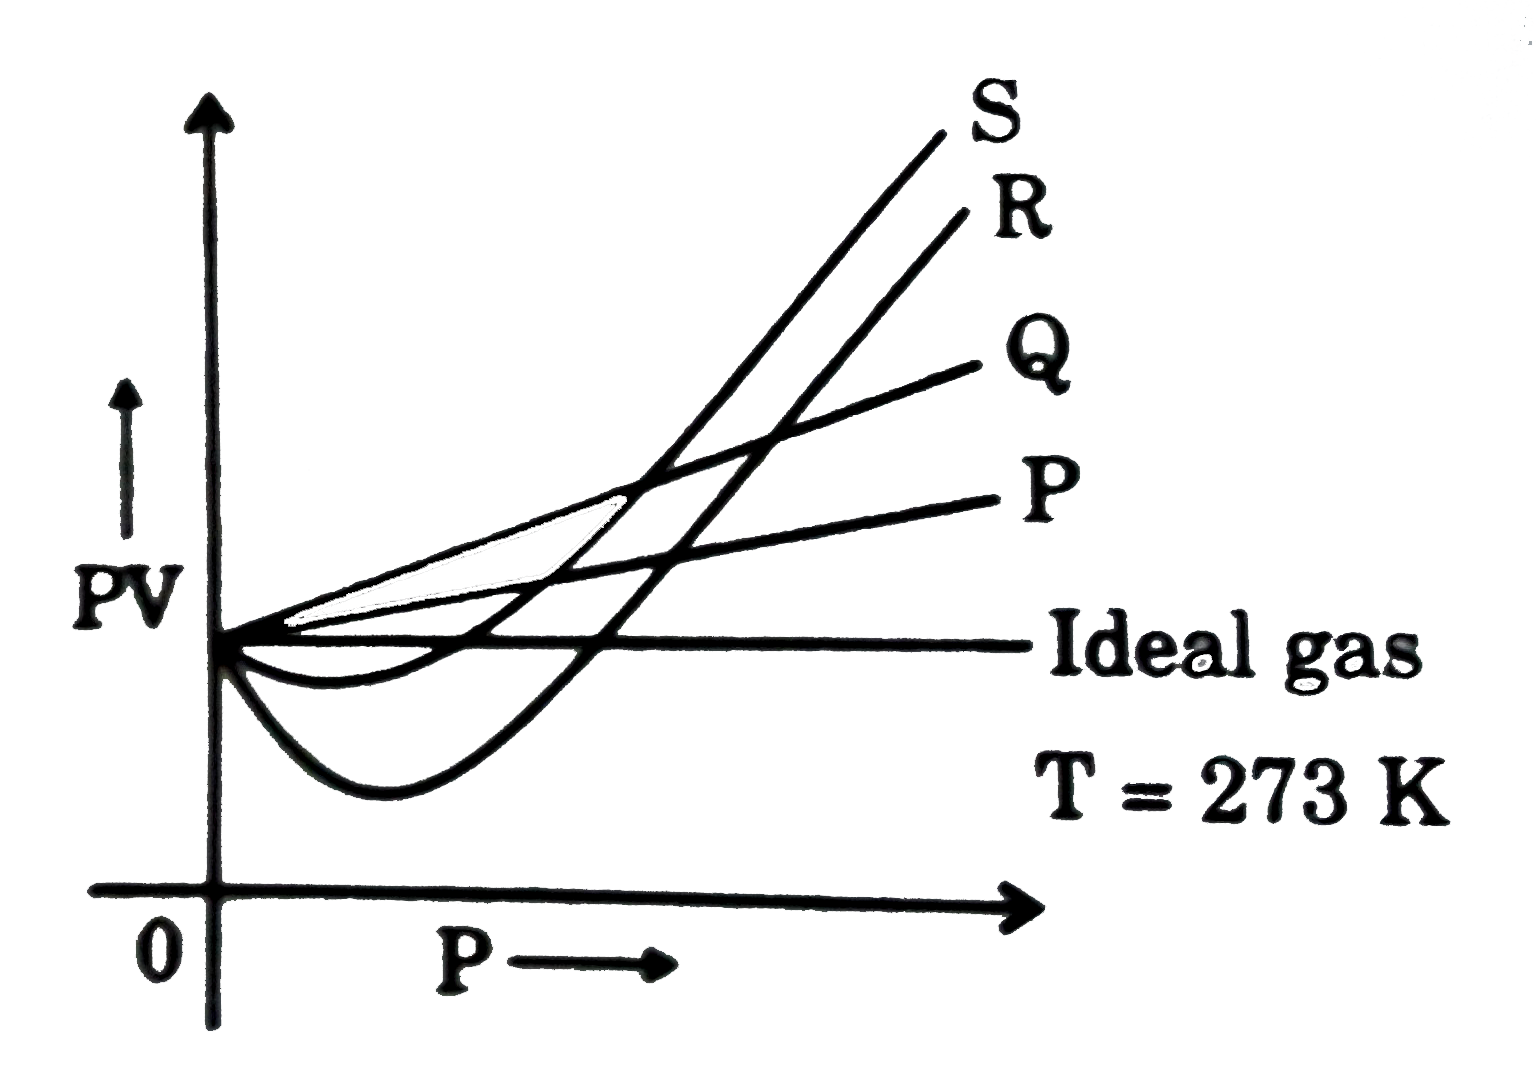
View SolutionFor the given plot, match the most appropriate graph for respective gases: (Among `H_(2),He, CO, CH_(4))`
View Solution
Gaseous State questions and complete solutions for chapter GRAPHICAL INTERPRETATION of GRB CHEMISTRY (HINGLISH) of Class 12
All Exercises from GRB PUBLICATION Class 12 CHEMISTRY GRAPHICAL INTERPRETATION
- A. Thermodynamics
- Atomic Sturcture
- B. Gaseous State
- C. Atomic Sturcture
- Chemical Equilibrium
- Chemical Kinetics
- Comprehension
- Comprehension 1
- Comprehension 10
- Comprehension 11
- Comprehension 12
- Comprehension 13
- Comprehension 14
- Comprehension 15
- Comprehension 16
- Comprehension 17
- Comprehension 18
- Comprehension 19
- Comprehension 2
- Comprehension 20
- Comprehension 21
- Comprehension 22
- Comprehension 23
- Comprehension 24
- Comprehension 25
- Comprehension 26
- Comprehension 27
- Comprehension 28
- Comprehension 29
- Comprehension 3
- Comprehension 4
- Comprehension 5
- Comprehension 6
- Comprehension 7
- Comprehension 8
- Comprehension 9
- D. Liquid Solutions
- E. Surface Chemistry
- Electrochemistry
- F. Ionic Equilibrium
- G. Chemical Equilibrium
- Gaseous State
- H. Chemical Kinetics
- I.Electrochemistry
- Ionic Equilibrium
- Liquid Solutions
- Match The Column Type
- Multiple Objective Type
- Subjective Type
- Surface Chemistry
- Thermodynamics