Complete Solutions to Comprehension of chapter GRAPHICAL INTERPRETATION of Class 12 book with complete answers and questions
| Class 12 | CHEMISTRY |
| Chapter | GRAPHICAL INTERPRETATION |
| GRB PUBLICATION | Comprehension |
| Number Of Questions | 49 |
| Academic Year | 2023-24 |
Every reaction whether started by taking only reactants or by taking only products or any other combination always has a tendency to move towards equilibrium. Hence, equilibrium state can be considered as the one with most stable composition. In case of isomers, based on stability data position of equilibrium can als be decided.
Which of the following graphs are correct for the isomeric conversions at 1 bar and 298 K?
View SolutionOne mole of an ideal gas undergoes a process (10L, 4atm) to (4L, 10 atm ). The process may be represented by straight line in P-V diagram
The only incorrect statement is :
(R = 0.08 L-atm/K-mol)
View SolutionOne mole of an ideal gas undergoes a process (10L, 4atm) to (4L, 10 atm ). The process may be represented by straight line in P-V diagram
The incorrect graph regarding the process is ltbgt
View SolutionIn order to perdict variation of Gibbs free energy with progress of reaction at constant temperature and 1 bar pressure, it is important to know realtive stability of the components involved in chemical reaction at standard useful work then the change in Gibbs free energy should be calculated
In the thermite reaction used obtaining energy, aluminium oxide. From the given data identify the option 9s) which is (are) correct.
[Given :
Density of aluminimum = 2/7 gm/ml, Density of
View SolutionOne of the important approach of the study of real gases involves the analysis of a parameter Z called the compressibility factor
View SolutionOne of the important approach of the study of real gases involves the analysis of a parameter Z called the compressibility factor
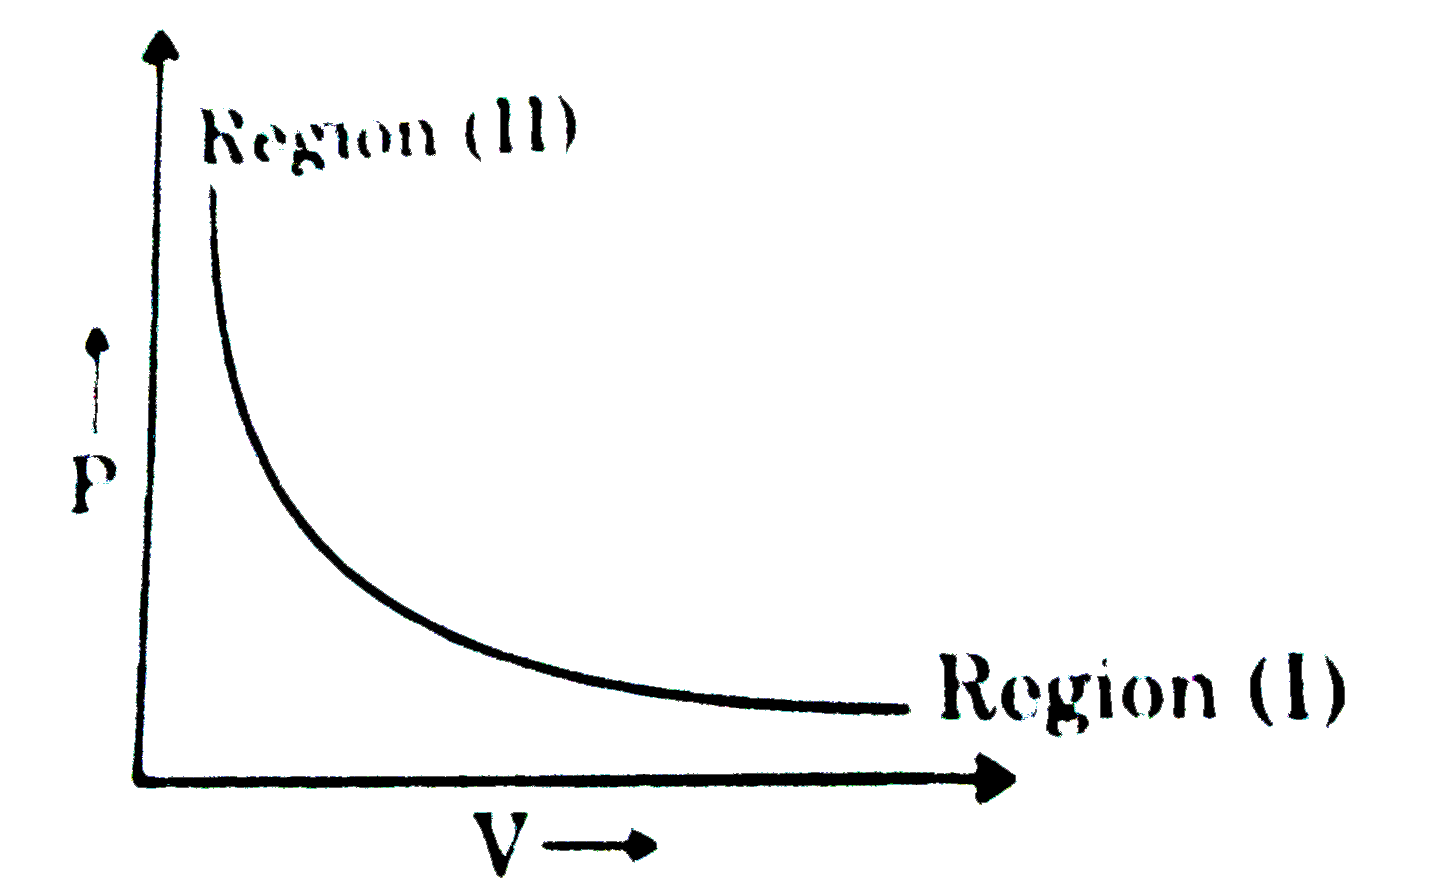
Following graph represents a pressure (P) volume (V) relationship at a fixed temperature (T) for moles of a real gas.The graph has two regions masked (I) and (II). Which of the folloing option true ?
View SolutionWhen perssure is increase at constant temperature, volume of gas decreases, AB
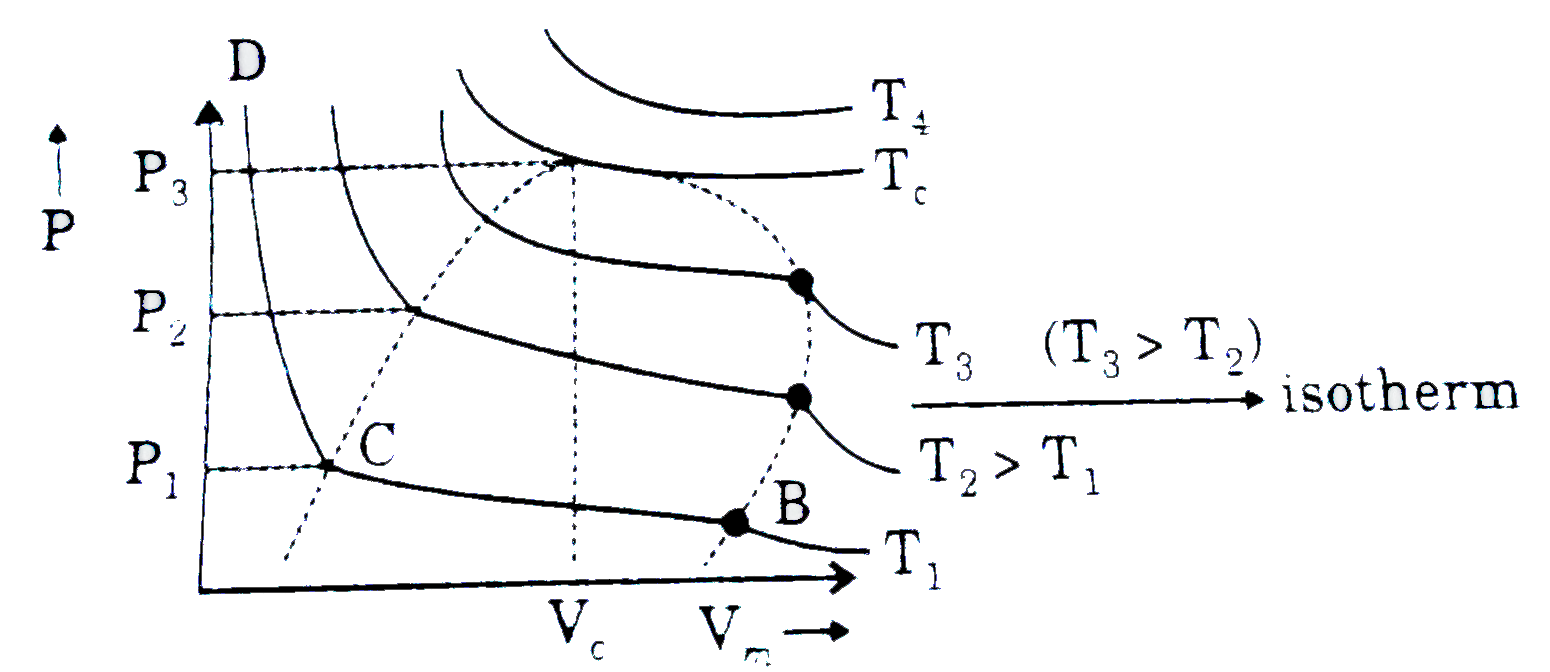
Critical constant Using van der Waals' Equations
Since equation is cubic in
But at critical point all three roots of the equation should be equal, hence equation should be :
Comparing with equation (i)
from eqns.(iv) and (v0,
from eq. (iv)
from e.q (iii)
At critical point, the slope of PV curve (slope of isotherm) will be zero at all other point slpoe will be negative zero is the maximum value of slope
[Mathematically such points are known as point of inflection (where first two derivatives becomes zero) Using the two
If the critical constants for a hypothetical van der Waals' gas are
View SolutionWhen perssure is increase at constant temperature, volume of gas decreases, AB
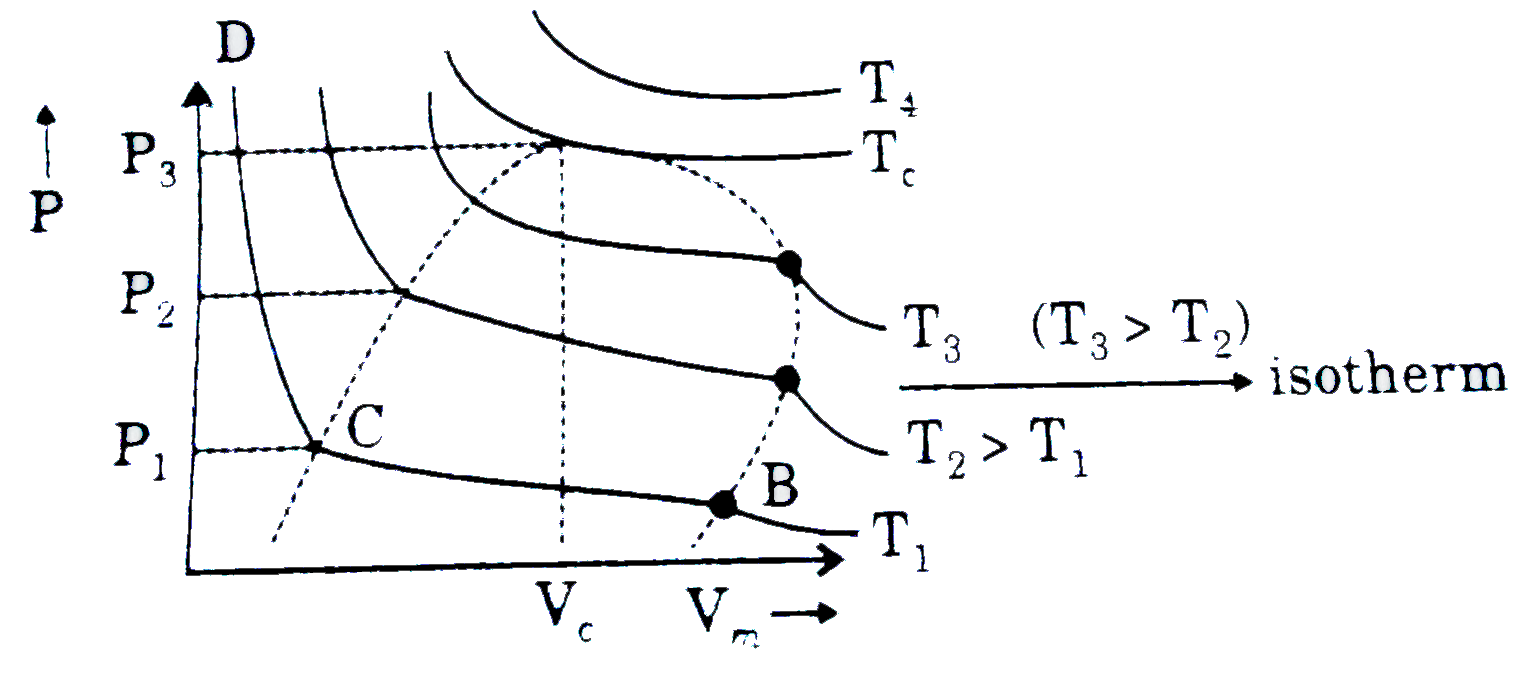
Critical constant Using van der Waals' Equations
Since equation is cubic in
But at critical point all three roots of the equation should be equal, hence equation should be :
Comparing with equation (i)
from eqns.(iv) and (v0,
from eq. (iv)
from e.q (iii)
At critical point, the slope of PV curve (slope of isotherm) will be zero at all other point slpoe will be negative zero is the maximum value of slope
[Mathematically such points are known as point of inflection (where first two derivatives becomes zero) Using the two
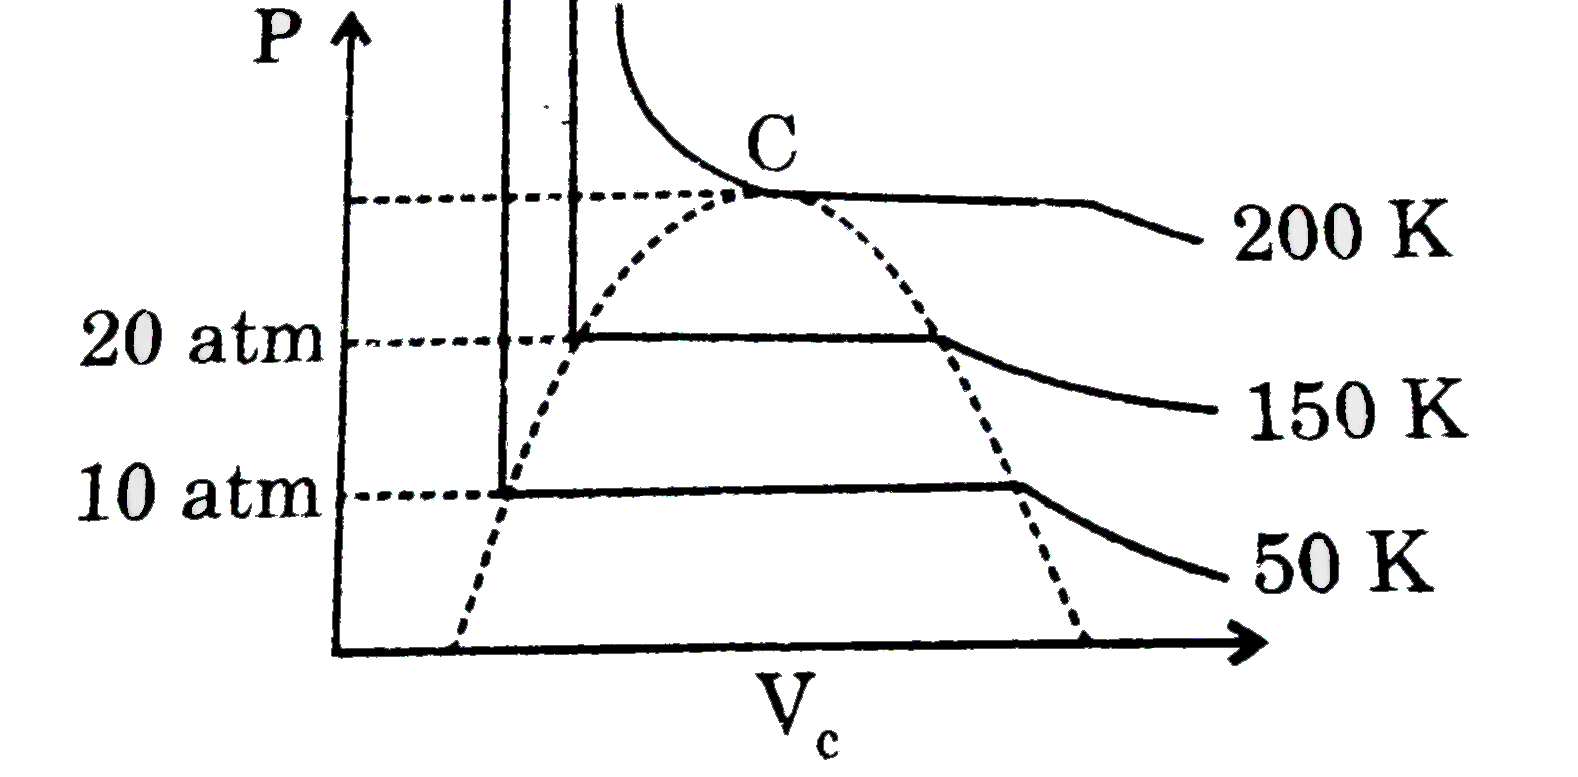
Identify the wrong statement related to the following graph
View SolutionIn the photoelectric effect the eletrons are emiited intantaneously from a given matal plate when it is irradiated with radiation of frequency equal to or greater then some minimum ferquency, is called the threshold frequency.According to Planck's idea, light may be considered to be made up discrete particles called photons.Each photon carries energy equal ti hv.When this photon cllides with the electron of the metal, the electron acquires energy of the emitted electron is given by :
If the incident rediation is of threshold frequency the electron will be emitted without any kinetic energy
i.e
A plot of kinetic energy of the emitted electron versus frequency of the incident radiation yields a straight line given as :
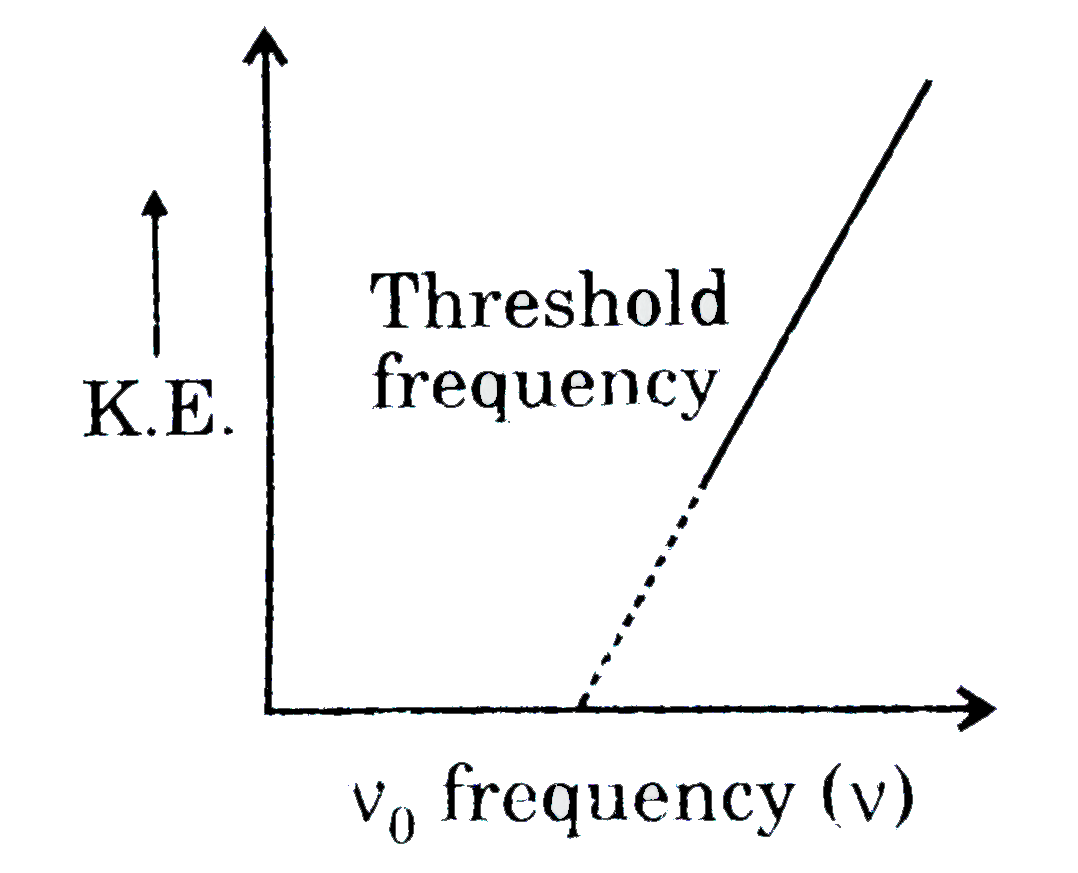
A laser producting monochromatic lights of different wavelenght is uesd to eject electrons from the sheet of glod having threshold frequency
View SolutionIn the photoelectric effect the eletrons are emiited intantaneously from a given matal plate when it is irradiated with radiation of frequency equal to or greater then some minimum ferquency, is called the threshold frequency.According to Planck's idea, light may be considered to be made up discrete particles called photons.Each photon carries energy equal ti hv.When this photon cllides with the electron of the metal, the electron acquires energy of the emitted electron is given by :
If the incident rediation is of threshold frequency the electron will be emitted without any kinetic energy
i.e
A plot of kinetic energy of the emitted electron versus frequency of the incident radiation yields a straight line given as :
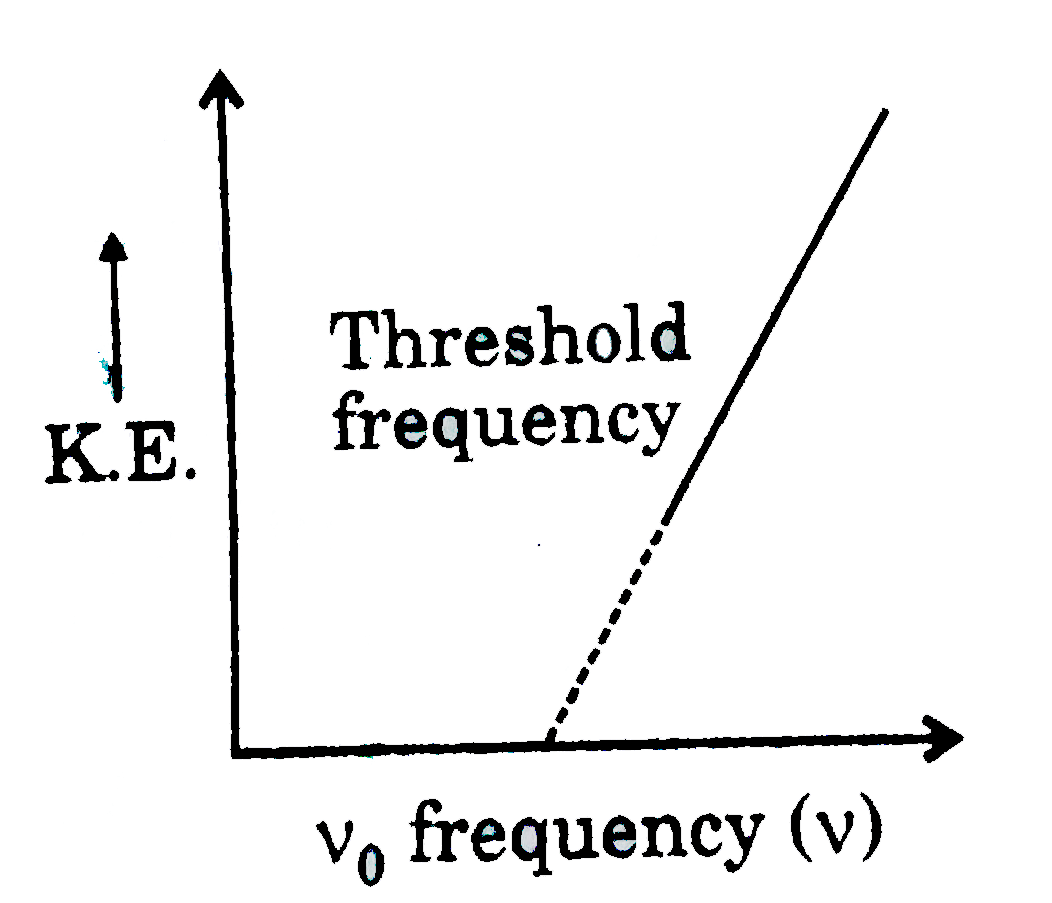
The number of photoelectrons emitted depends upon :
View SolutionEffect of temperature on the equilibrium process analysed by using the thermodynamics
From the thermodynamics reaction
From eqns.(i) and(ii)
Clearly, if a plot of k vs 1/T is made then it is a straight lone having slope
If at temperature
Substracting e.q (iv) from (v), we get
from the relation we can conclude that the of equilibrium constant increase in temperature for endothermic reaction eith but value of equilibrium constant decrease with the increase in temperature for exothermic reaction
For exothermic reaction if
View SolutionEffect of temperature on the equilibrium process analysed by using the thermodynamics
From the thermodynamics reaction
From eqns.(i) and(ii)
Clearly, if a plot of k vs 1/T is made then it is a straight lone having slope
If at temperature
Substracting e.q (iv) from (v), we get
from the relation we can conclude that the of equilibrium constant increase in temperature for endothermic reaction eith but value of equilibrium constant decrease with the increase in temperature for exothermic reaction
If for a particular reversible reaction
View SolutionThe variation of rate constant with temperature can be explained by Arrhenius equation. However , the can be explained by Activation energy is found to be temperature dependent/In such cases
If for a reaction in
View SolutionThe variation of rate constant with temperature can be explained by Arrhenius equation. However , the can be explained by Activation energy is found to be temperature dependent/In such cases
Which if the following statement is not correct ?
View SolutionIf an element can exist in several oxidation states, it is convenient to display the reduction potentials corresponding to the various half reactions in diagrammatic from, known as Latimer diagram. The Latimer diagram for chlorine in acid solution is
In basic solution is :
What is the potential of couple
View SolutionIf an element can exist in several oxidation states, it is convenient to display the reduction potentials corresponding to the various half reactions in diagrammatic from, known as Latimer diagram. The Latimer diagram for chlorine in acid solution is
In basic solution is :
Which of the following statement s correct ?
View SolutionIf an element can exist in several oxidation states, it is convenient to display the reduction potentials corresponding to the various half reactions in diagrammatic from, known as Latimer diagram. The Latimer diagram for chlorine in acid solution is
In basic solution is :
For a hypothetical element, the Frost diagram is shown in figure
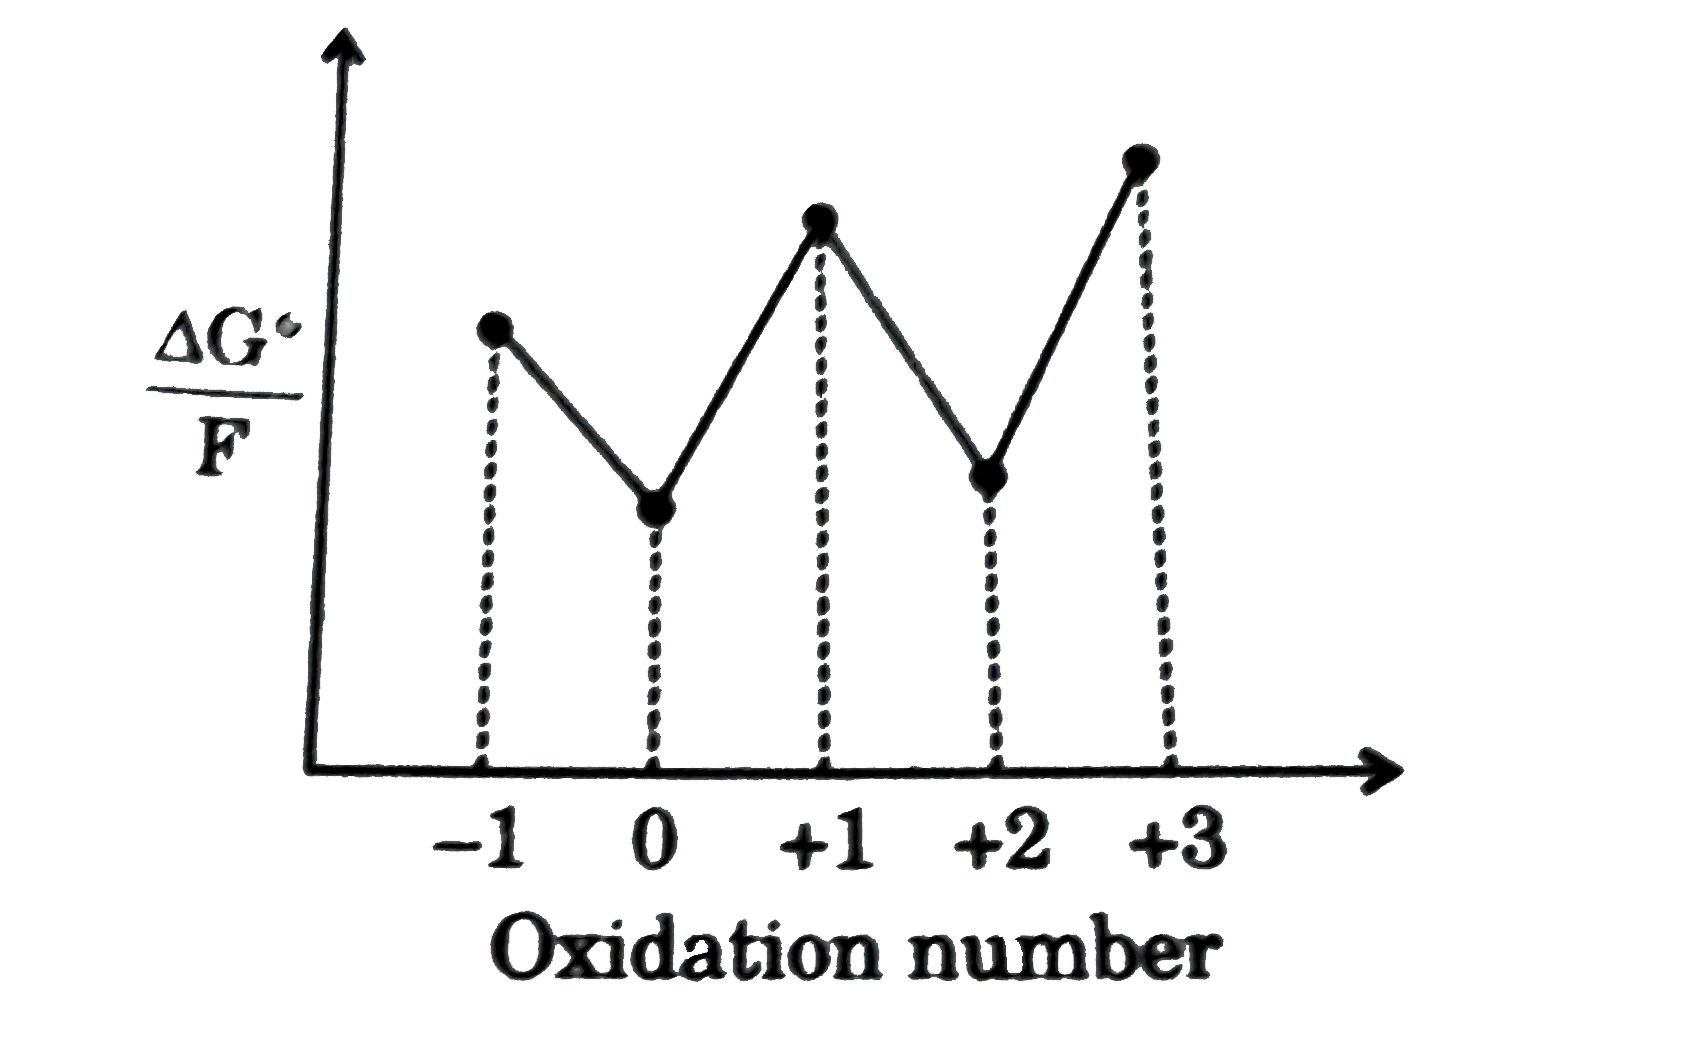
Which of the following oxidation state is least stable ?
View SolutionIf an element can exist in several oxidation states, it is convenient to display the reduction potentials corresponding to the various half reactions in diagrammatic from, known as Latimer diagram. The Latimer diagram for chlorine in acid solution is
In basic solution is :
Which of the following statement is correct according to above question ?
View SolutionThe principle on conductometric titration is based in the fact that during the titration, one of the ions is replaced by the other and invariably thses two ions differ in the ionic conductivity with the result that the conductivity of the solution varies during the course of the titration.Take,for example,the titration between strong acid, say HCl. and a strong base, say NaOH.Before NaOH is added the conuctance of HCl solution has a high value due ti the persence if highly hydrogen ions.As NaOH is added,
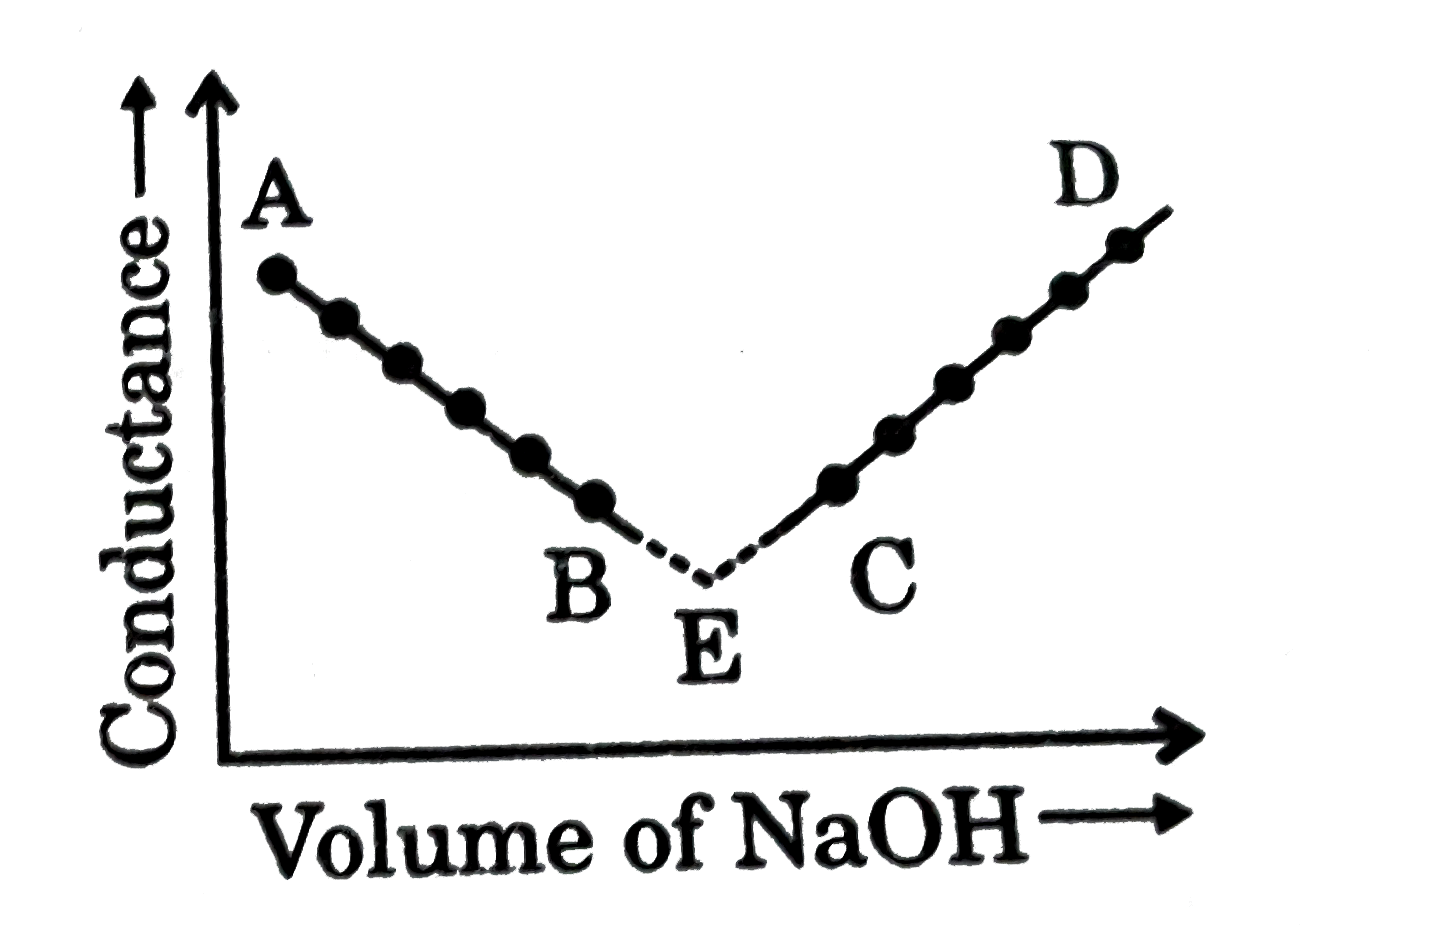
LET us take the specific exaanple of acetic acid being titration against NaOH.Before the addition the of alkali, the solution shows poor conductance due to feeble inization of acetic acid.Initially the addtion of alkali causes not only the replacement of
In all thses graphs it been assumed that the vloume change due addition of solution from burette in negligible heane vloume change of the sloution in beaker the conuctance of which is measured is almost constant throughout the measurement
The most appropriate titration curve ibtained when a mixture of a strong acid (say HCl) and a weak acid (say
View SolutionThe principle on conductometric titration is based in the fact that during the titration, one of the ions is replaced by the other and invariably thses two ions differ in the ionic conductivity with the result that the conductivity of the solution varies during the course of the titration.Take,for example,the titration between strong acid, say HCl. and a strong base, say NaOH.Before NaOH is added the conuctance of HCl solution has a high value due ti the persence if highly hydrogen ions.As NaOH is added,
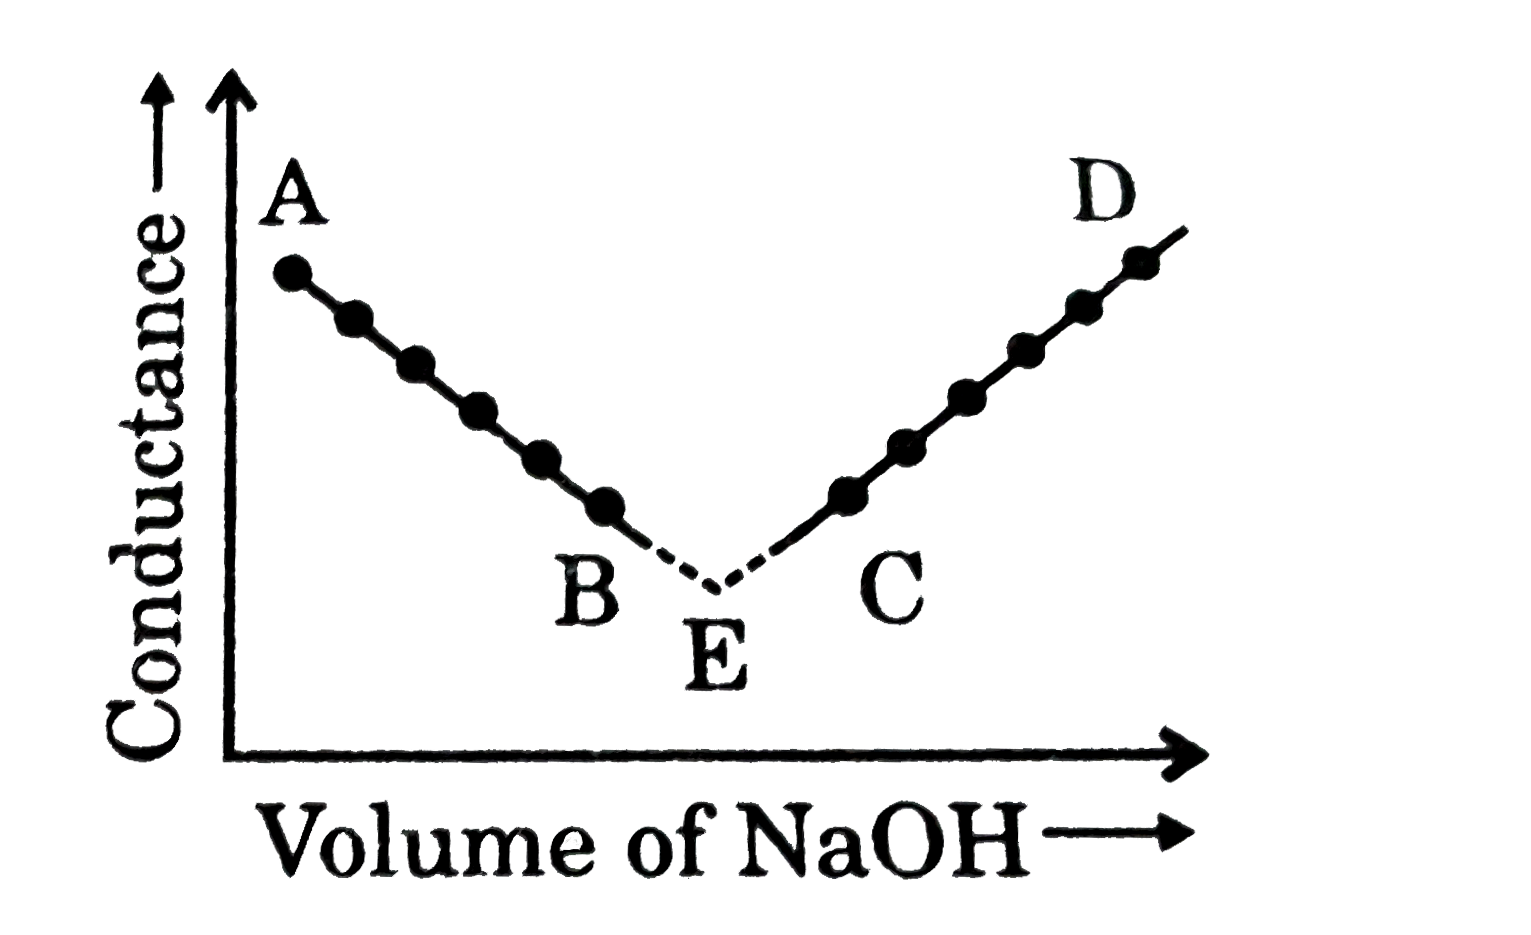
LET us take the specific exaanple of acetic acid being titration against NaOH.Before the addition the of alkali, the solution shows poor conductance due to feeble inization of acetic acid.Initially the addtion of alkali causes not only the replacement of
In all thses graphs it been assumed that the vloume change due addition of solution from burette in negligible heane vloume change of the sloution in beaker the conuctance of which is measured is almost constant throughout the measurement
If a 100 ml solution of 0.1 MHBr is titration using a very concentrated solution of NaOH then the conductivity (specific conductance0 of this solution at the equivalence wil be (assume volume change is negligible due addition of NaOH). Report your answer after mulitiplying it with 100 in
[Given :
View SolutionTitration are one of the methods we can use to discover the precise concentration of solutions. A typical titration involves adding a solution from a burette to another solution in a flask. The end point of the titration is found by watching a colour change taking place.However, a problem arises when a suitable indicator cannot be found, or when the colour change involved are unclear. In these cases, redox potential may sometimes come to the rescue.
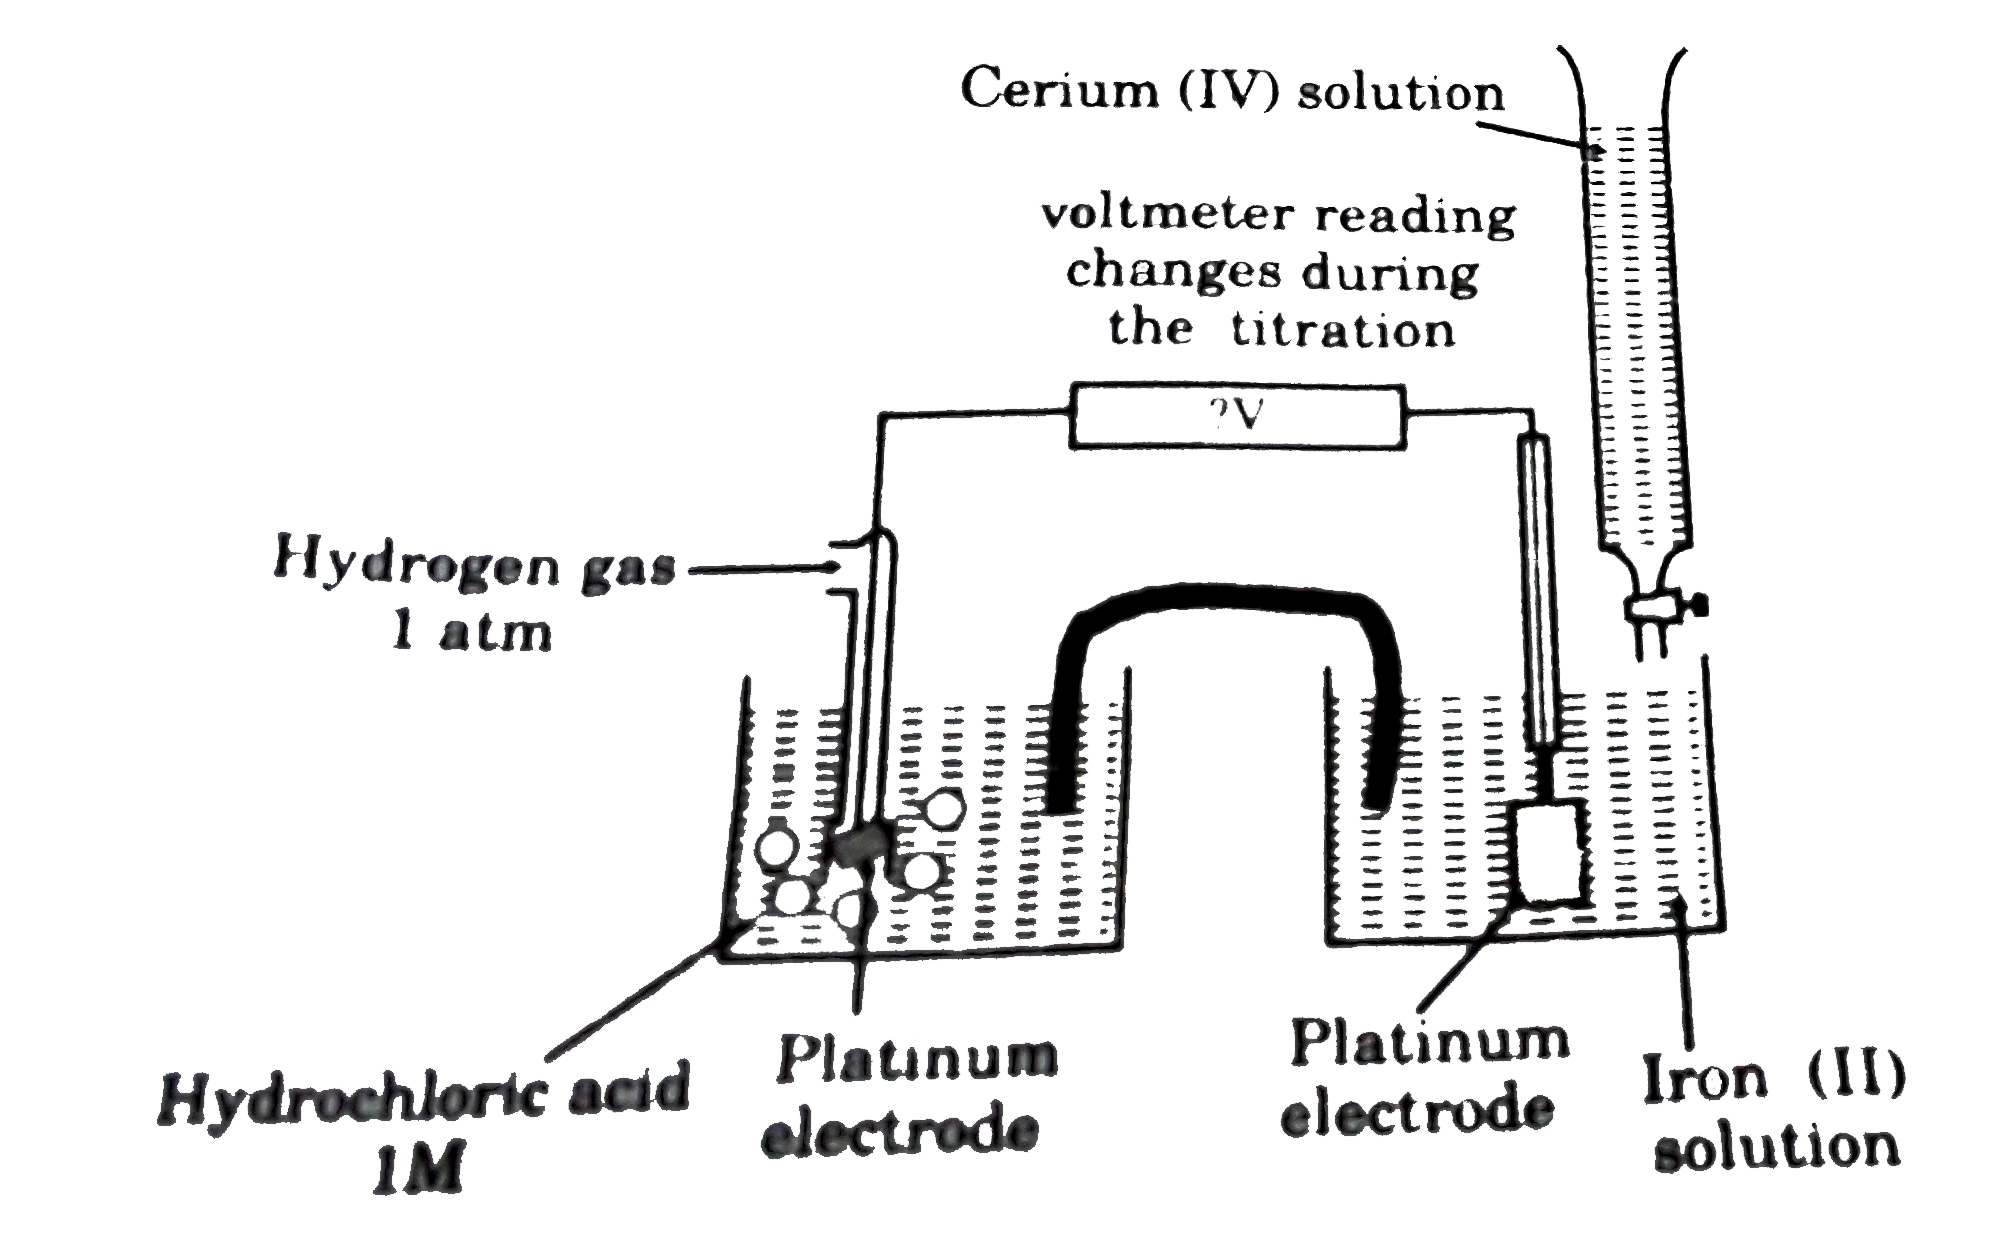
A perticularly well known example (Fig.) is a method of discovering then concentration of iron (II) ions in a solution by titrating them with a solution of cerium (IV). The redox potential that are of interest here are
Now imagine that we know the concentration of the cerium (IV) ions solution in the burette. We want to measure the concentration of the cerium (IV) solution from the burette, some of the iron (II) ions are will be oxidised. As a consequence the beaker would now contain large number of unreacted iron (II) ions , but also some iron (III) ions as well. All of the cerium (III). The solution in the beaker now represents an iron
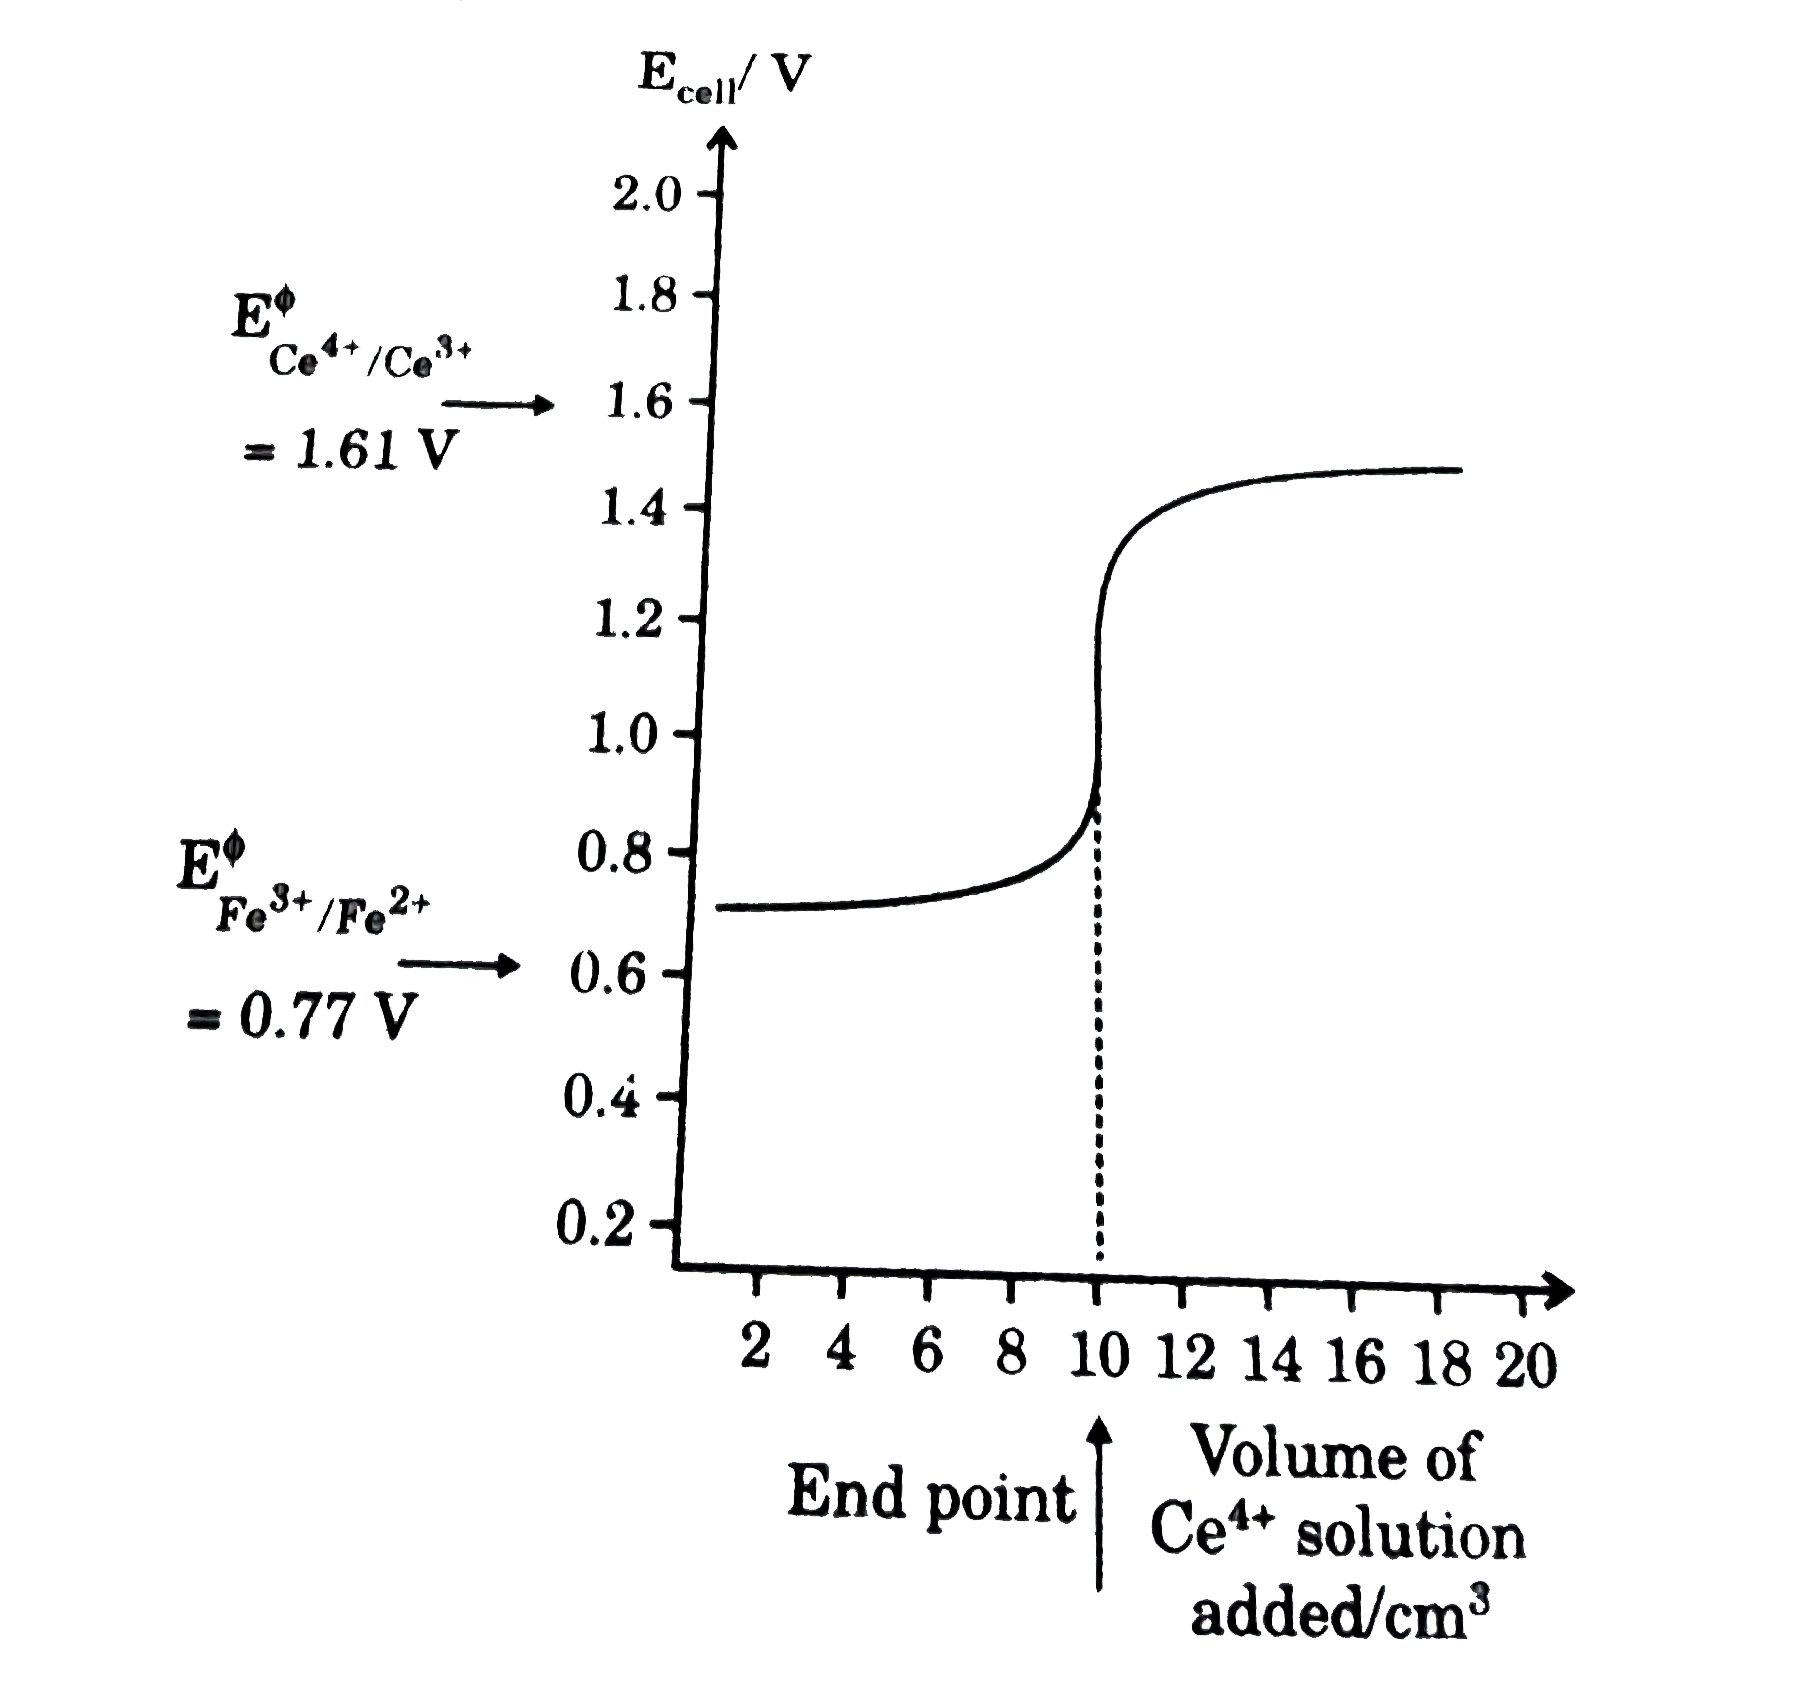
If we continue to add cerium (IV) solution , the number of iron (II) ions is gradually reduced and eventually only a very few are left (Table).At this stage the next few drops of cerium (IV) solution convert all the remaining irom (II) ions into iron (III), and some of the cerium (IV) ions are left unreacted. Once this happens we no longer have an iron
Just before all the iron (II) ions are converted into iron (III) we have a cell with an EMF of around
The cell shown below was set up
what would be the cell emf? If potassium cyanide solution were added to the left hand half cell (with due care!) what would you expect to happen to the emf of the cell ?
View SolutionTitration are one of the methods we can use to discover the precise concentration of solutions. A typical titration involves adding a solution from a burette to another solution in a flask. The end point of the titration is found by watching a colour change taking place.However, a problem arises when a suitable indicator cannot be found, or when the colour change involved are unclear. In these cases, redox potential may sometimes come to the rescue.
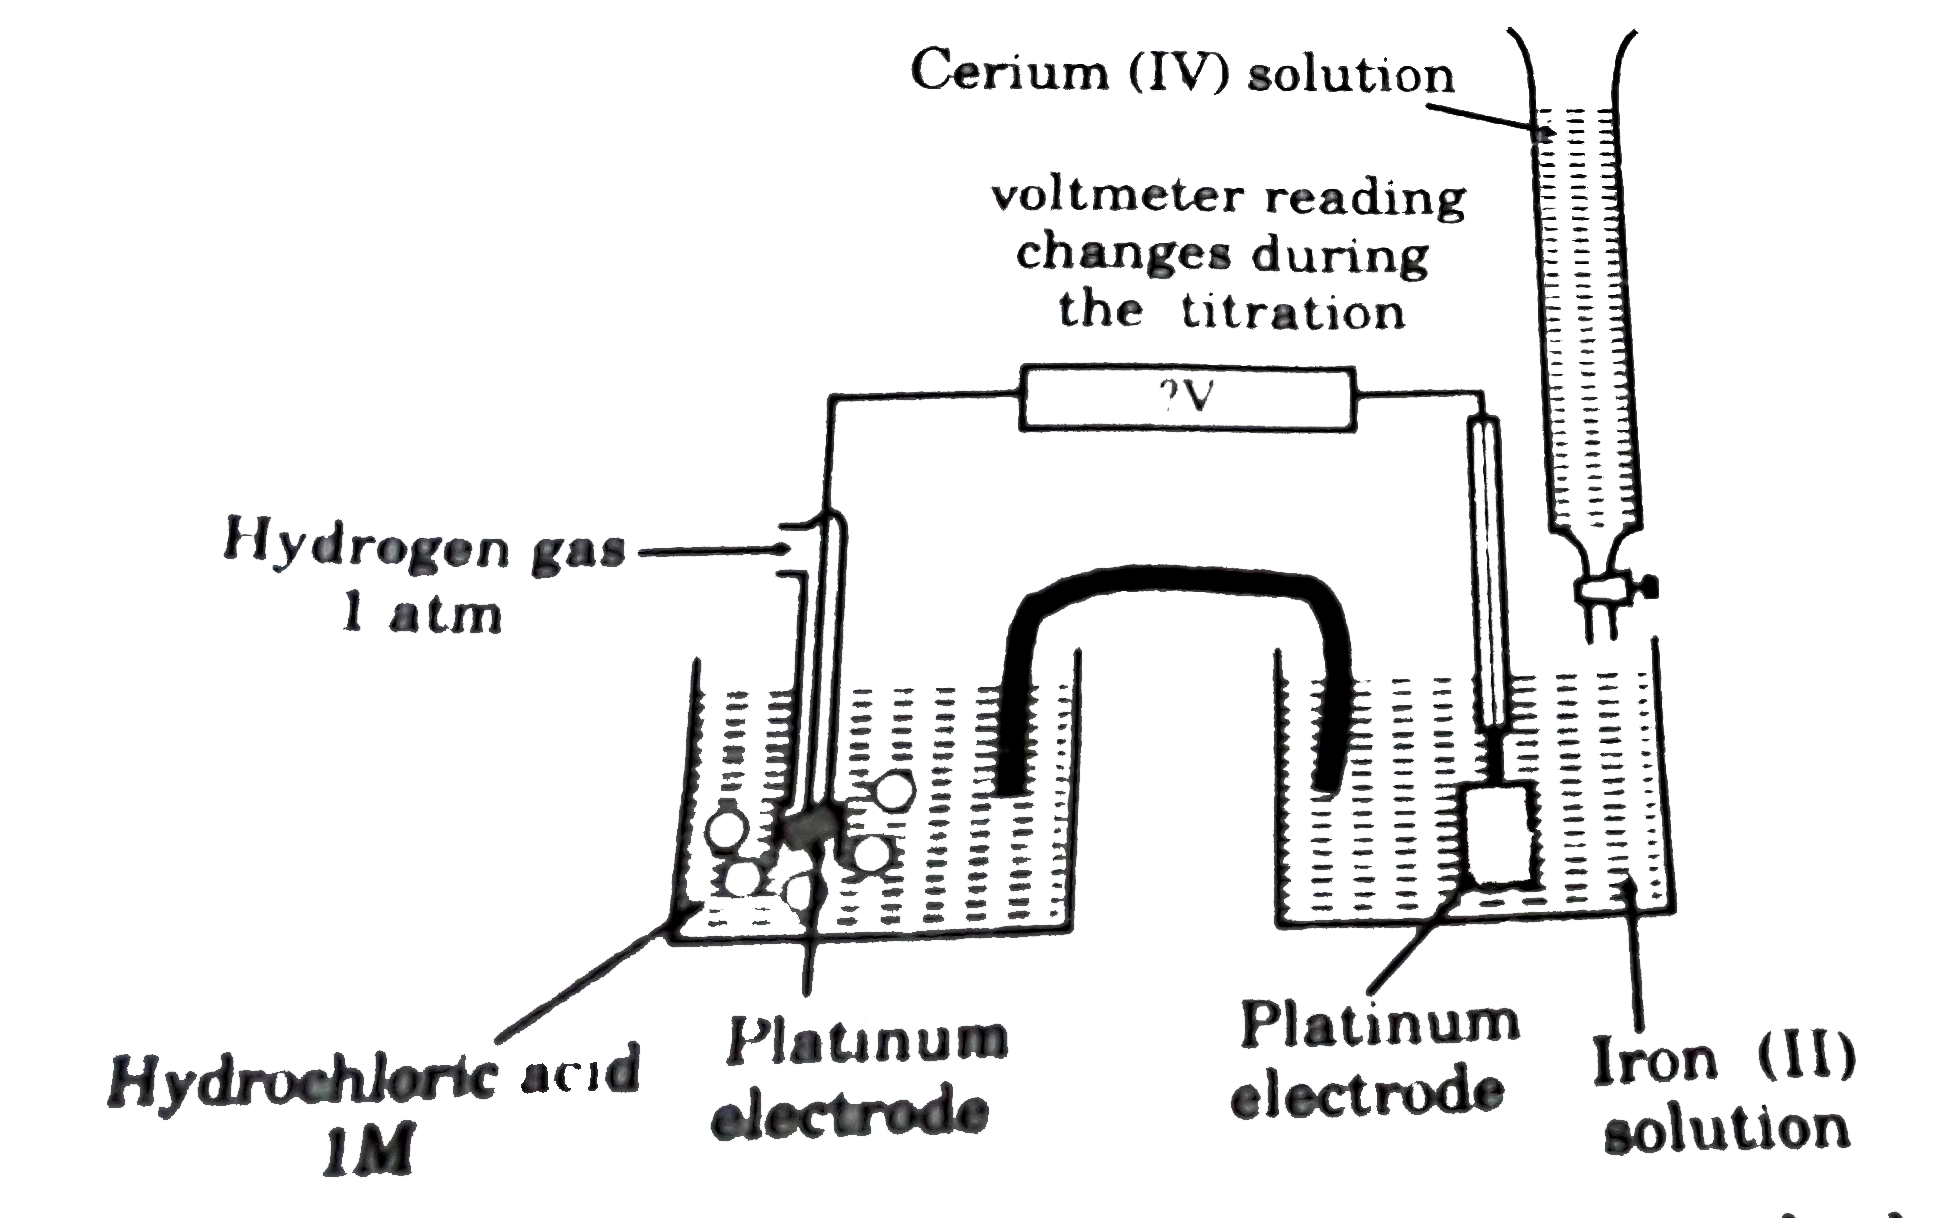
A perticularly well known example (Fig.) is a method of discovering then concentration of iron (II) ions in a solution by titrating them with a solution of cerium (IV). The redox potential that are of interest here are
Now imagine that we know the concentration of the cerium (IV) ions solution in the burette. We want to measure the concentration of the cerium (IV) solution from the burette, some of the iron (II) ions are will be oxidised. As a consequence the beaker would now contain large number of unreacted iron (II) ions , but also some iron (III) ions as well. All of the cerium (III). The solution in the beaker now represents an iron
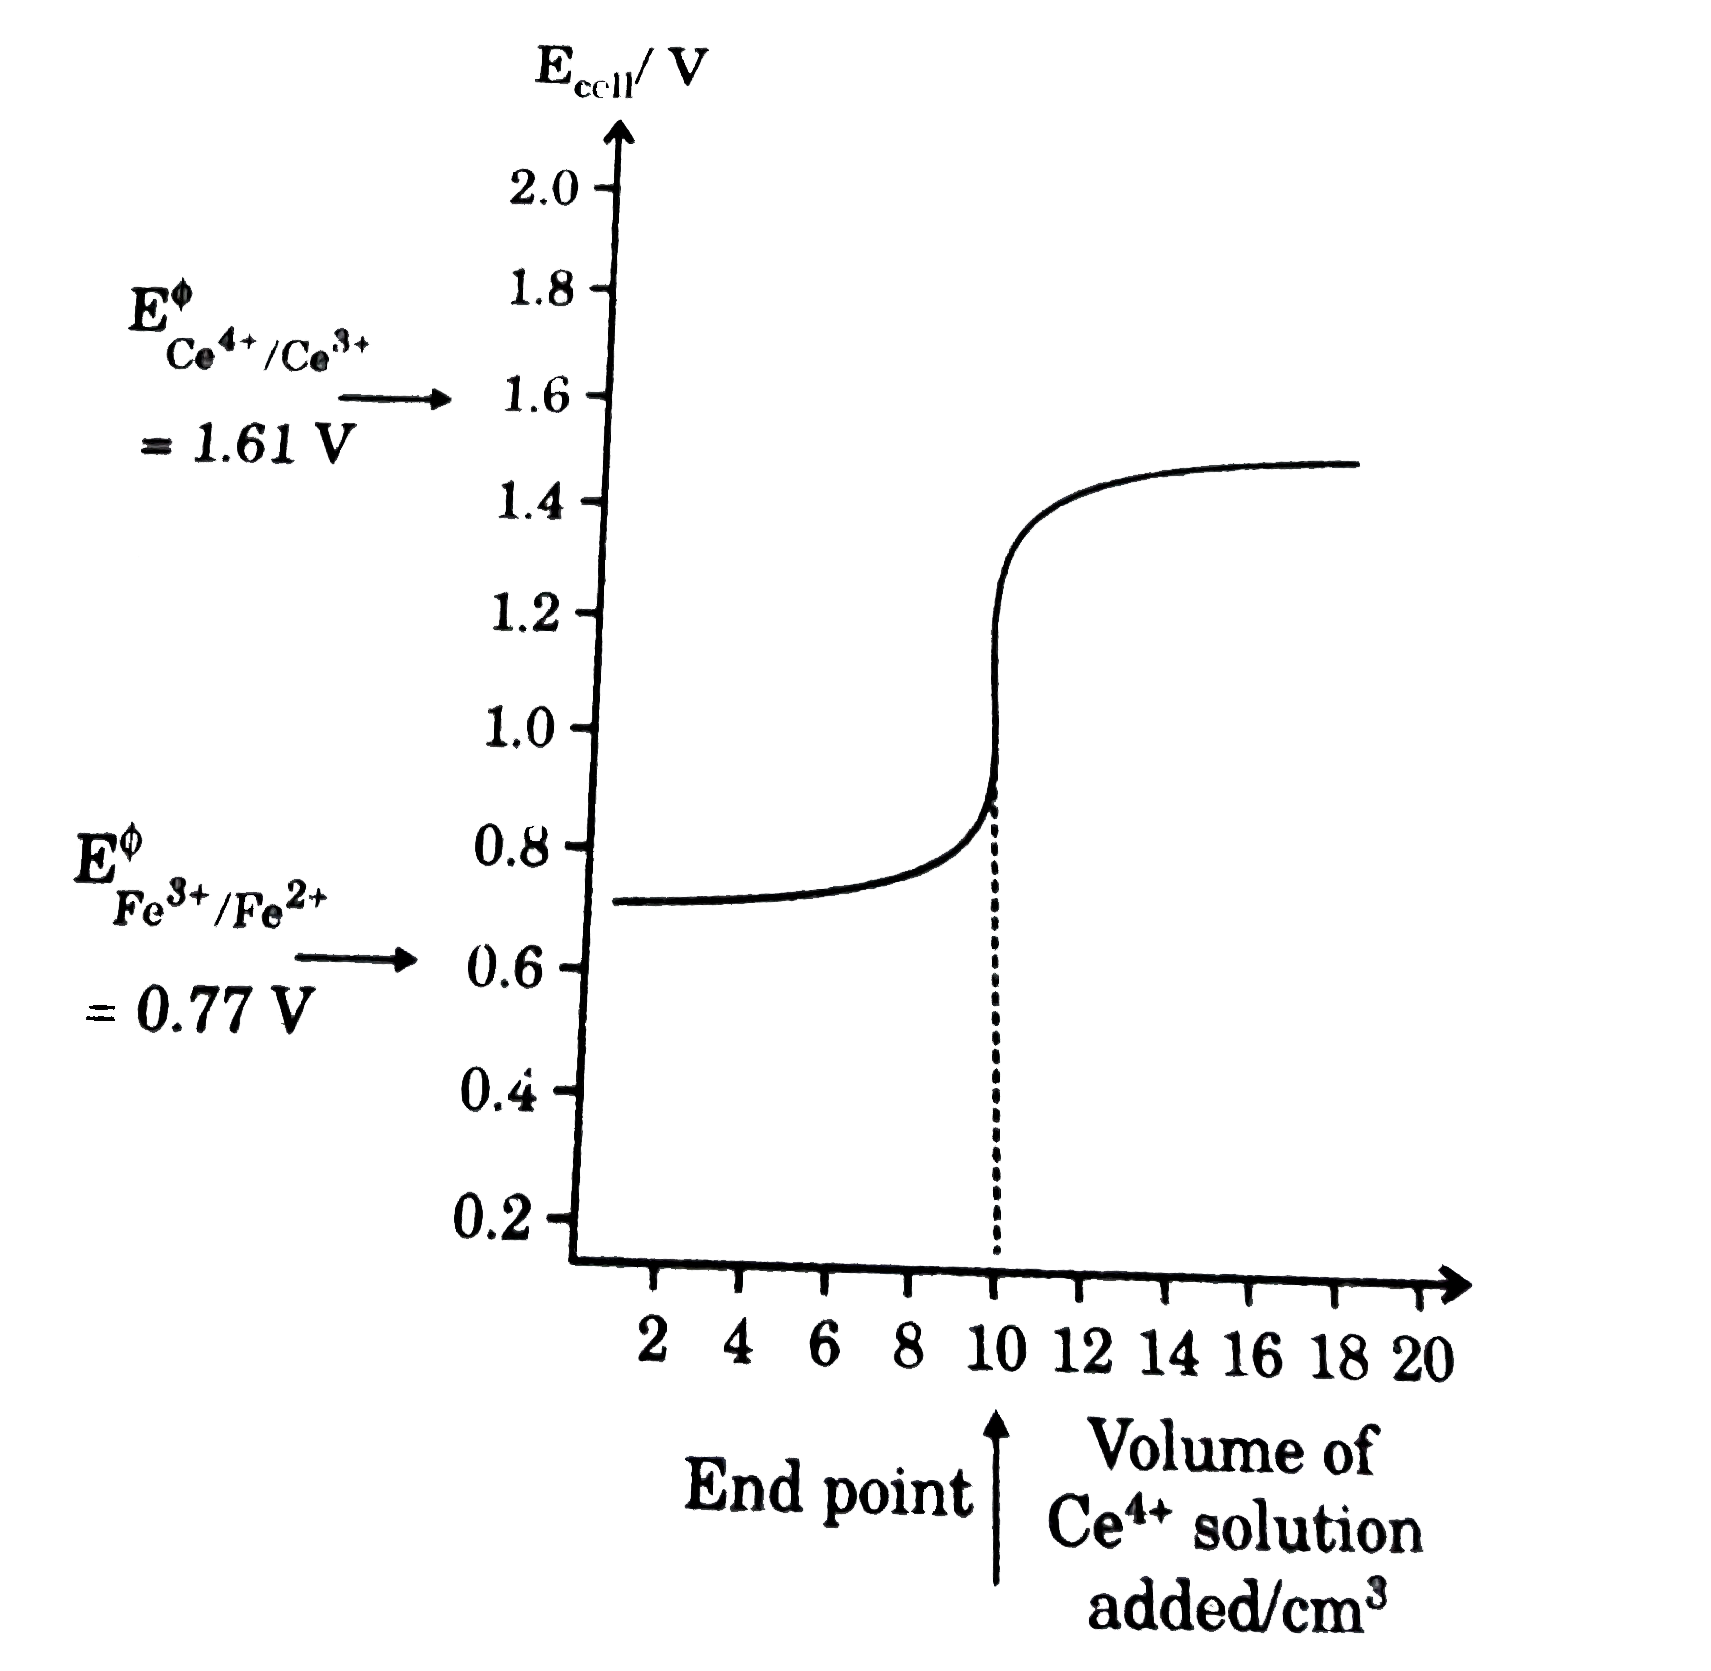
If we continue to add cerium (IV) solution , the number of iron (II) ions is gradually reduced and eventually only a very few are left (Table).At this stage the next few drops of cerium (IV) solution convert all the remaining irom (II) ions into iron (III), and some of the cerium (IV) ions are left unreacted. Once this happens we no longer have an iron
Just before all the iron (II) ions are converted into iron (III) we have a cell with an EMF of around
Imagine you were given a solution of potassium dichromate (VI) in a beaker and a solution of iron (II) sulphate in a burette. You do not know the concentration of dichromate (VI) ions , but the concentration of the iron (II) solution is known. Your task it to carry out a redox titration using the two solutions in order to determine the concentration of dichromate (VI) ions. Sketch a graph showing how the emf changes in the course of the above titration.
View SolutionThe speed of a molecule of a gas changes continuously as a result of collisions with other molecules and with the walls of the container. The speeds of individual molecules therefore change with time.
A direct consequence of the distribution of speeds is that the average kinetric energy is constant for a given temperature.
The average K.E. is defined as
where
The plot of
The majority of molecules have speeds which cluster around
The speed distribution also depends on the mass of the molecules. As the area under the curve is the same (equal to unity) for all gas samples, samples which have the same
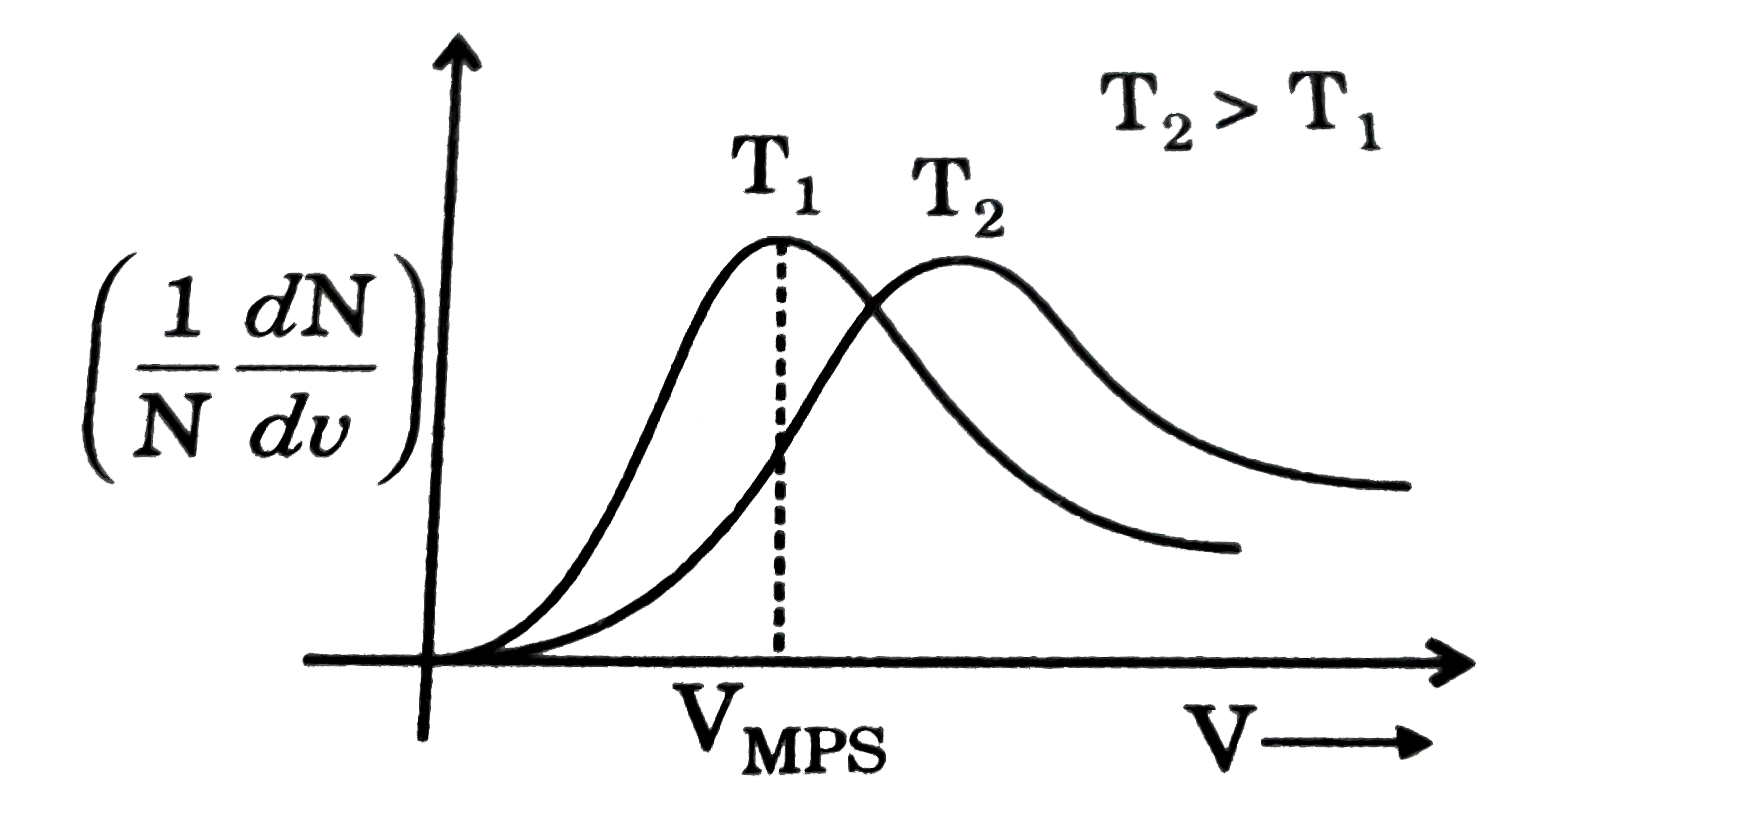
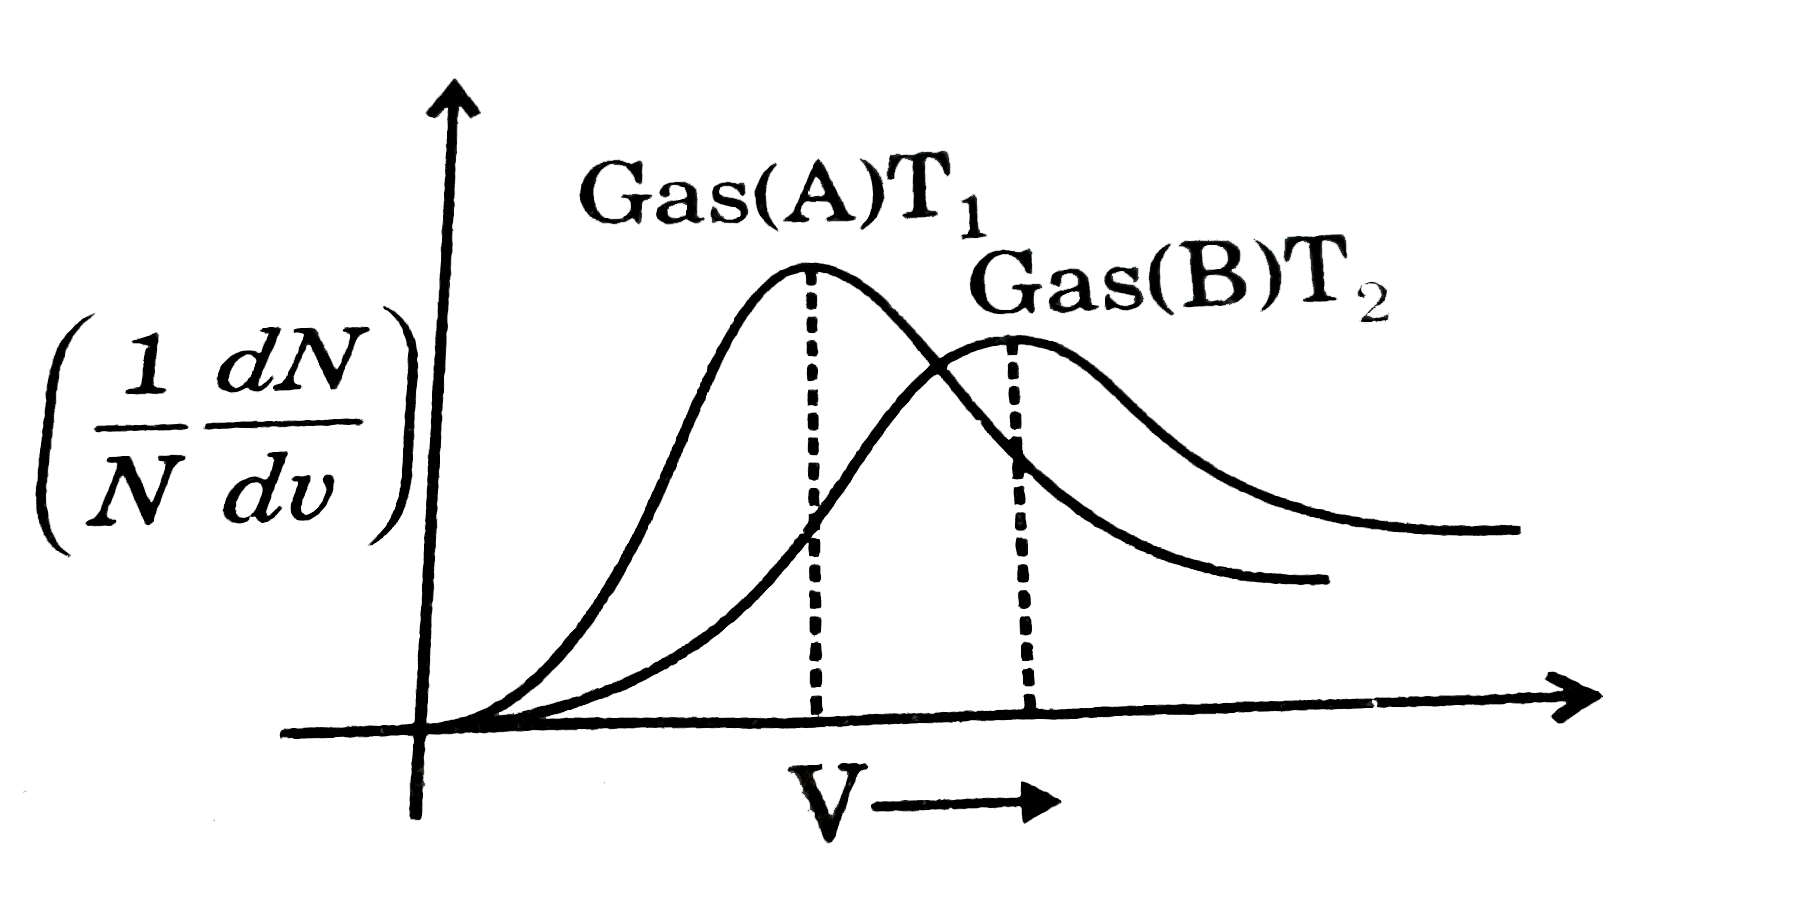
For the above graph, drawn for two different samples of gases at two different temperature
View SolutionThe speed of a molecule of a gas changes continuously as a result of collisions with other molecules and with the walls of the container. The speeds of individual molecules therefore change with time.
A direct consequence of the distribution of speeds is that the average kinetric energy is constant for a given temperature.
The average K.E. is defined as
where
The plot of
The majority of molecules have speeds which cluster around
The speed distribution also depends on the mass of the molecules. As the area under the curve is the same (equal to unity) for all gas samples, samples which have the same
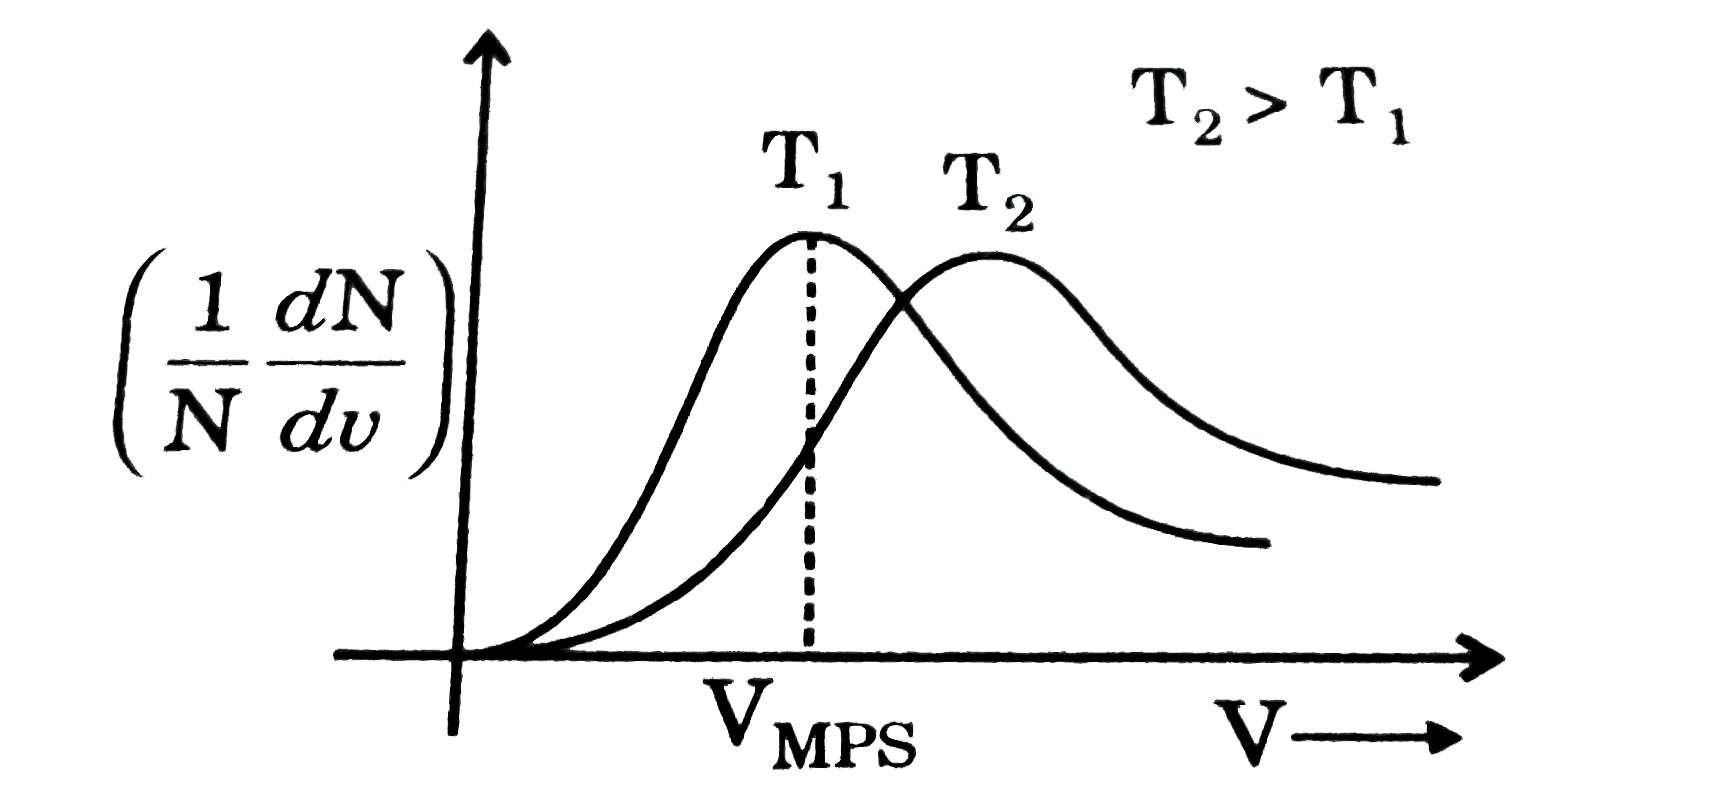
If two gases A and B and at temperature
View SolutionConcentrations measured as a function of time when gaseous
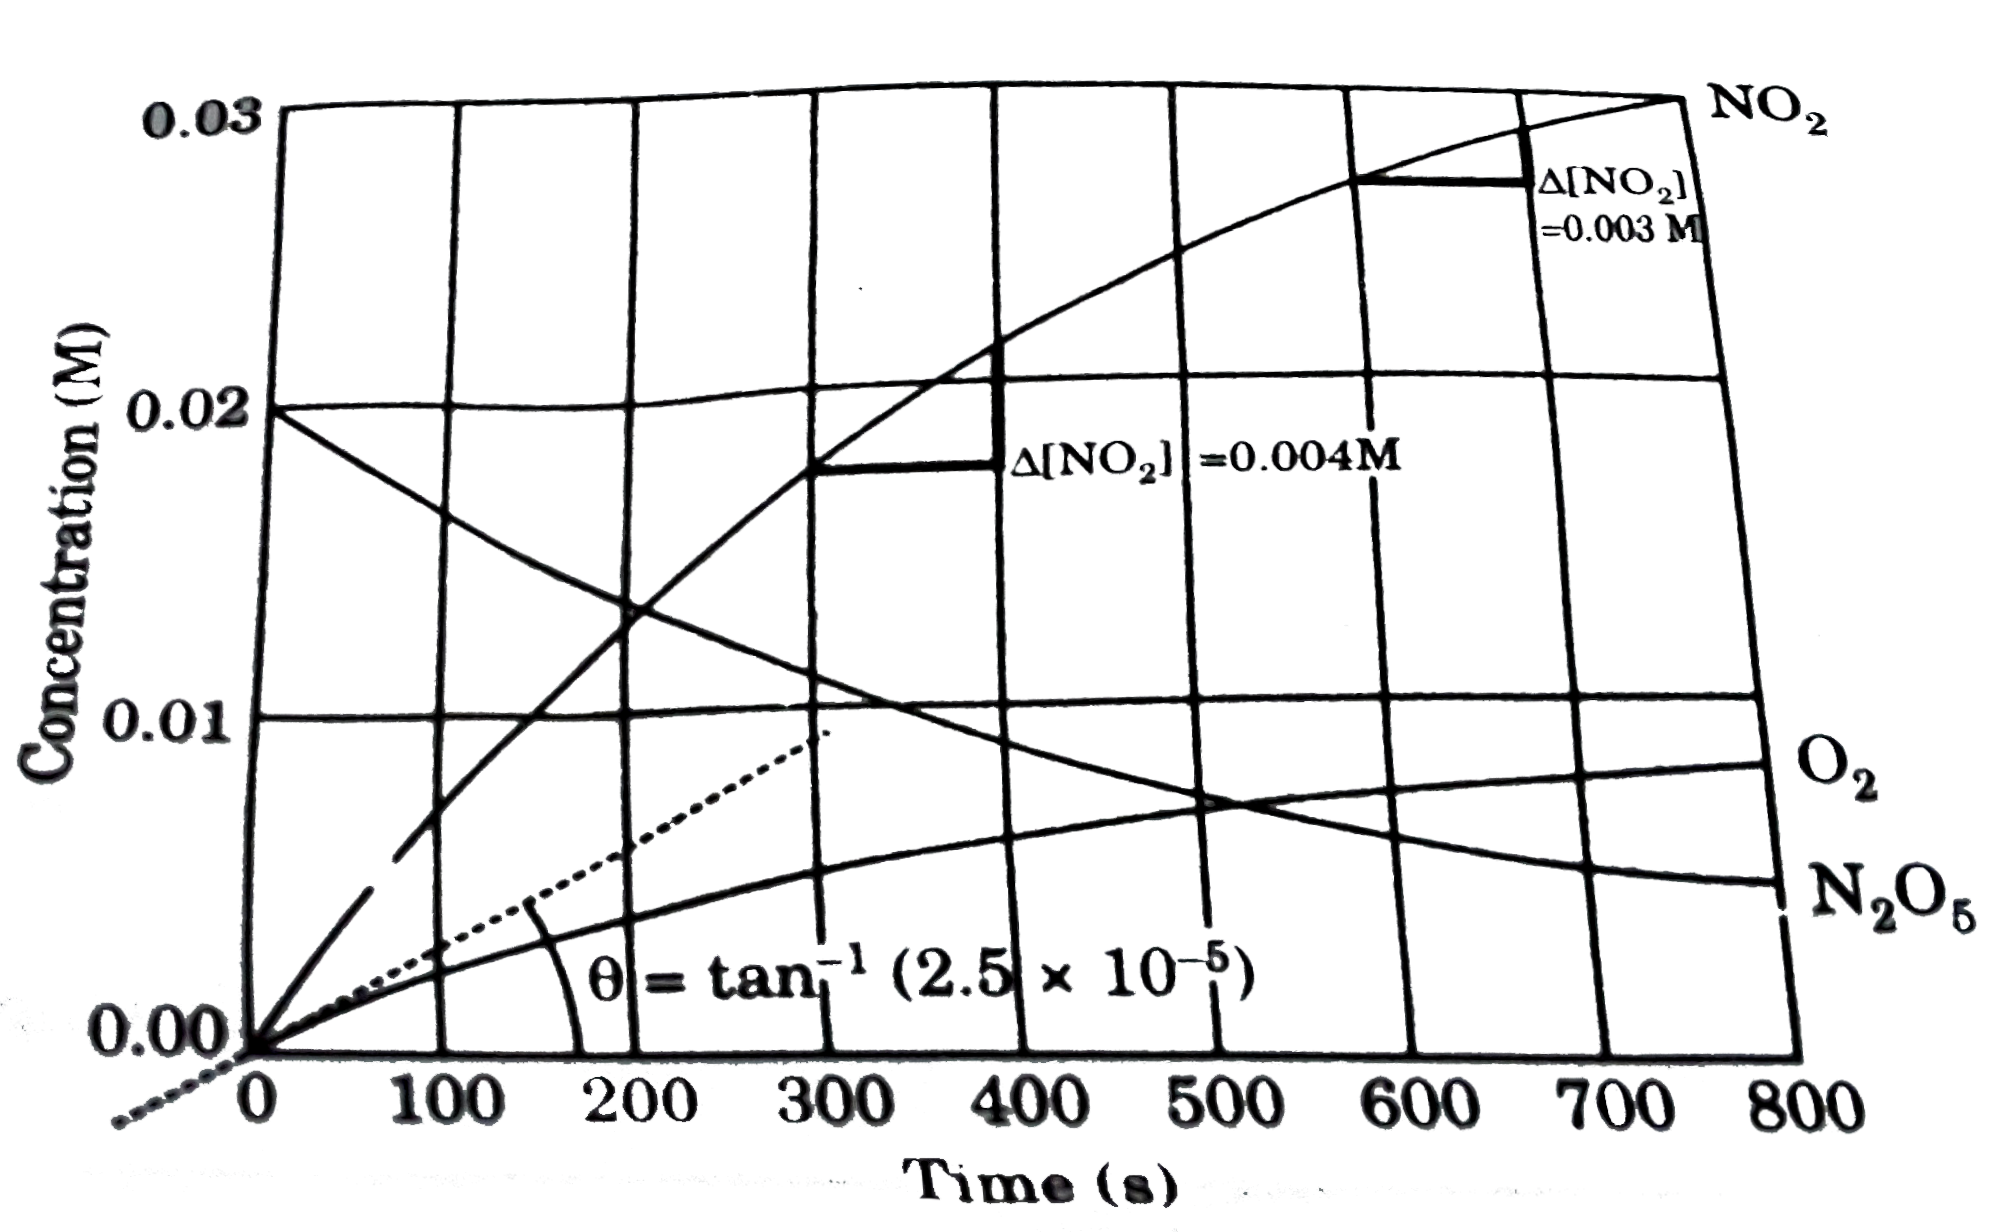
The rate of formation of
View SolutionConcentrations measured as a function of time when gaseous
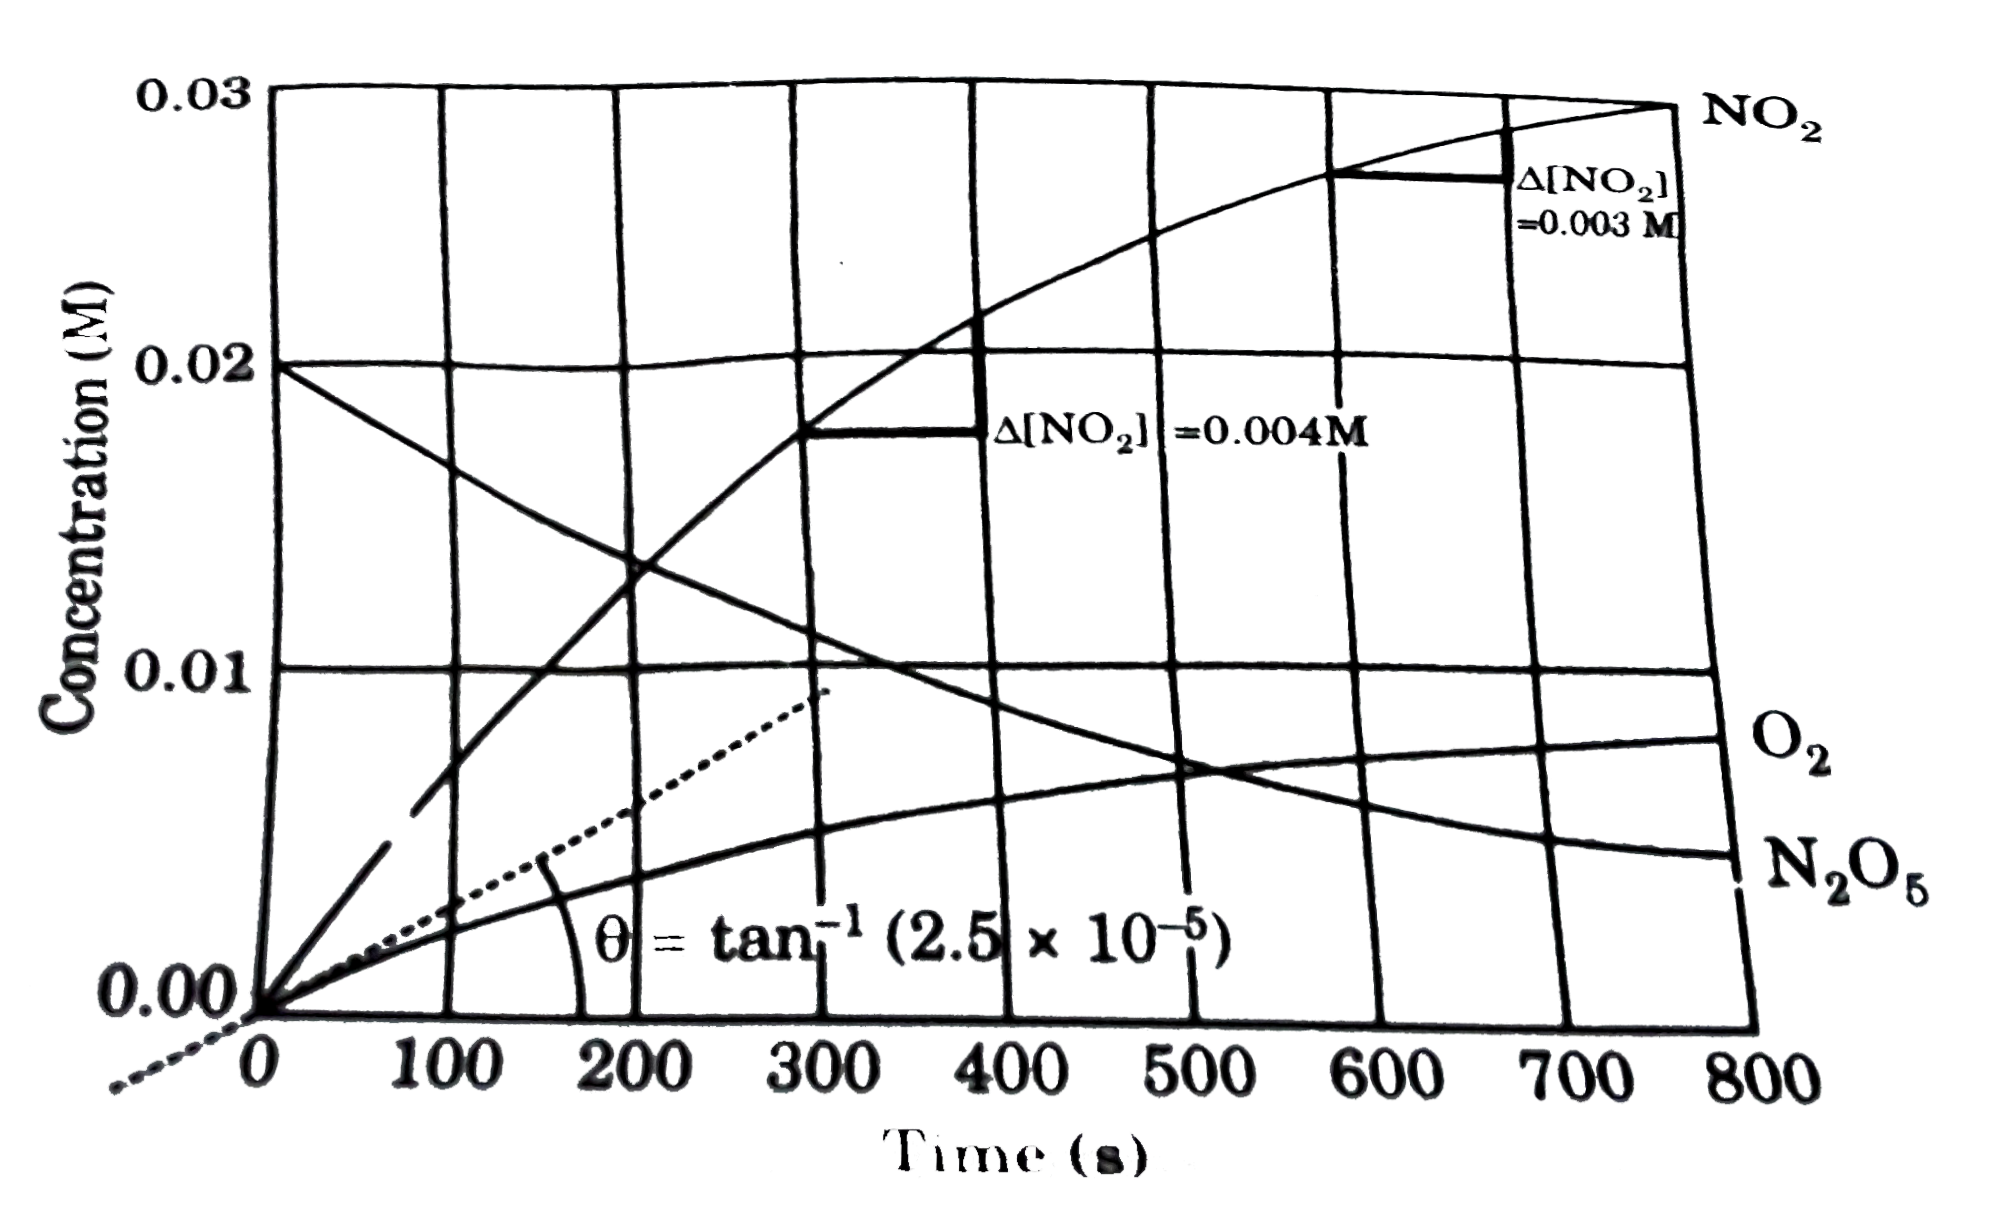
The rate of decomposition of
View Solution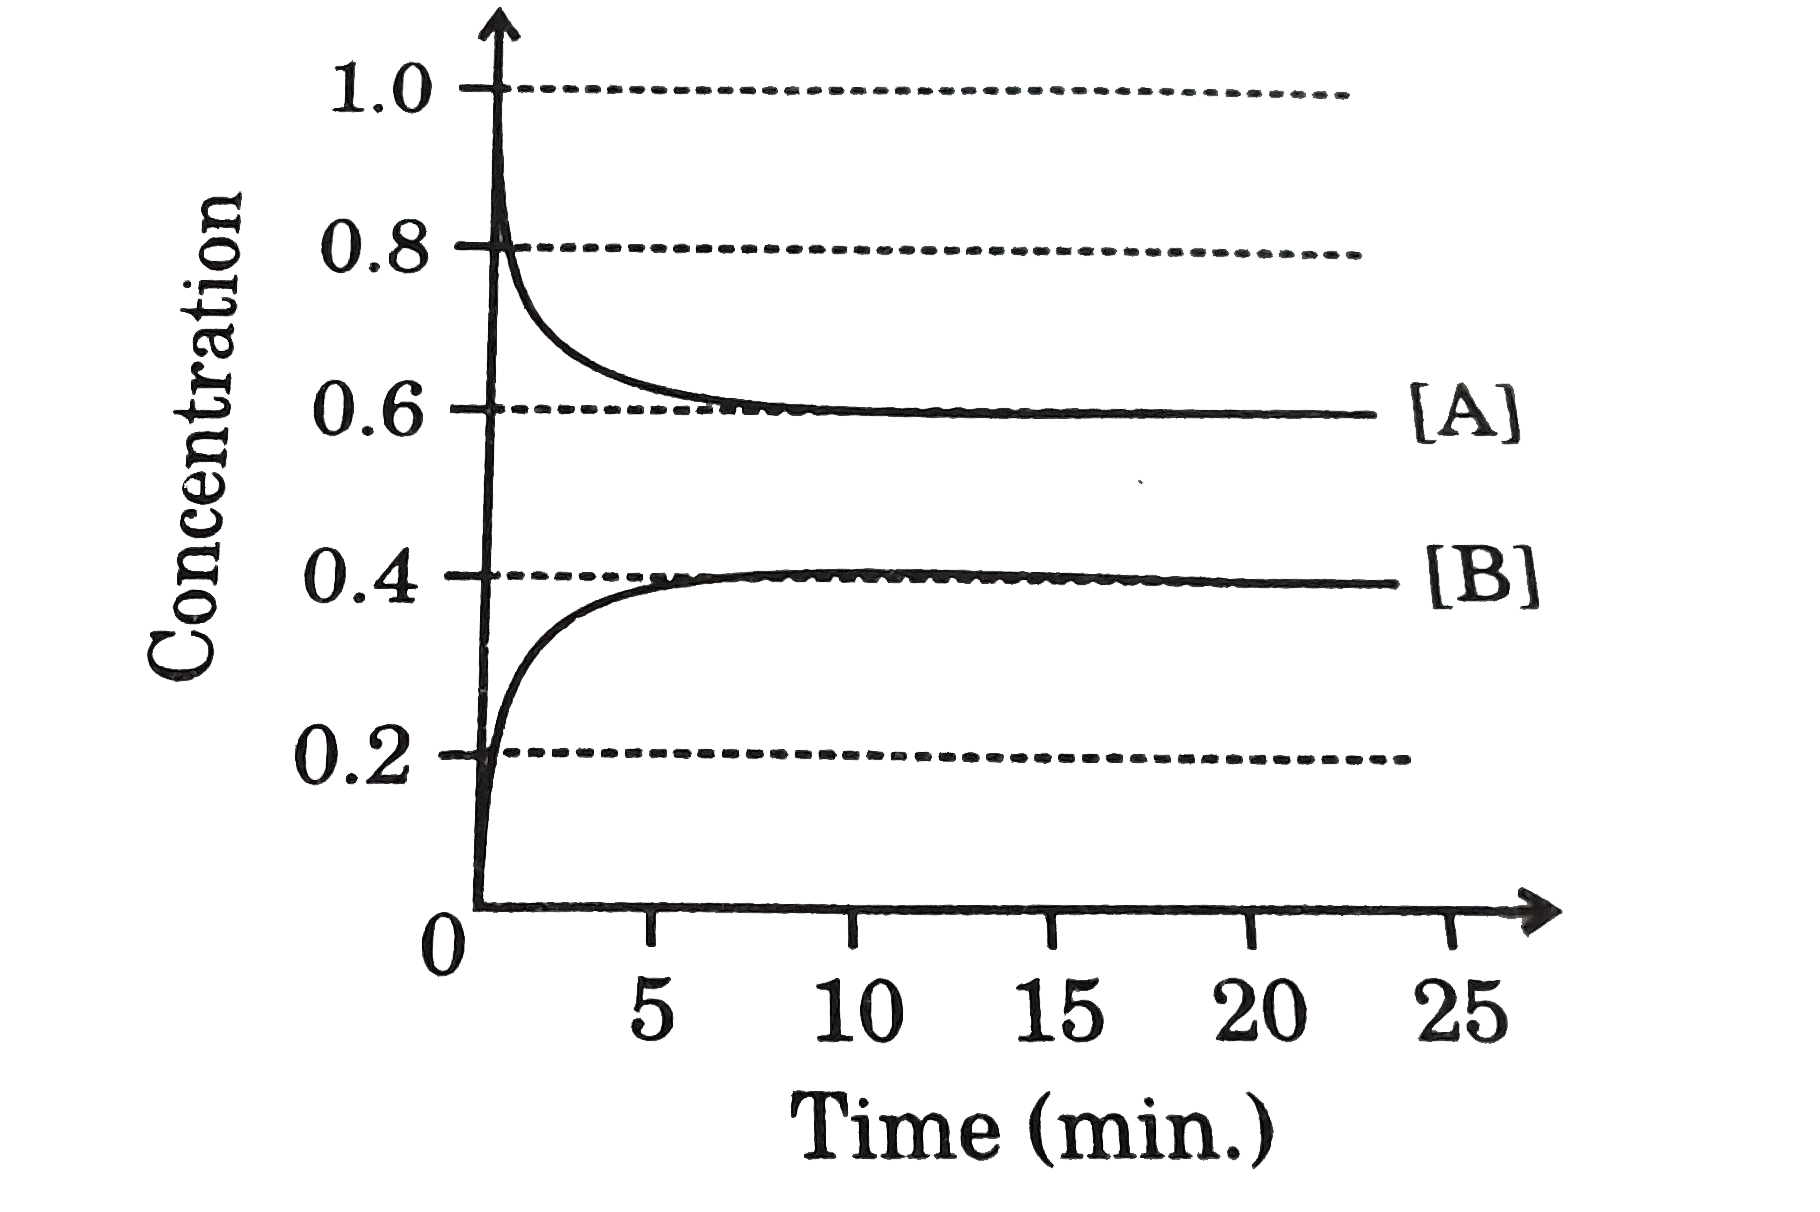
For the reversible reaction
Calculate [B] at time
View SolutionAccording to collision theory for determining the variation of rate of reaction with temperature the rate constant,
Assuming the conditions given above answer the following questions.
(P) The maximum value of k will be equal to A
(Q) At lower temperature rate of reaction will increase with increase in temperature
(R) At higher temperature, rate of reaction will decrease with increase in temperature
View SolutionThe adsorption of a gas at a metal surface is called occlusion. The extent of gas adsorbed at metal surface at a certain temperature depends on pressure as
where K and n are constant for a particular combination of gas and metal at fixed temperature and
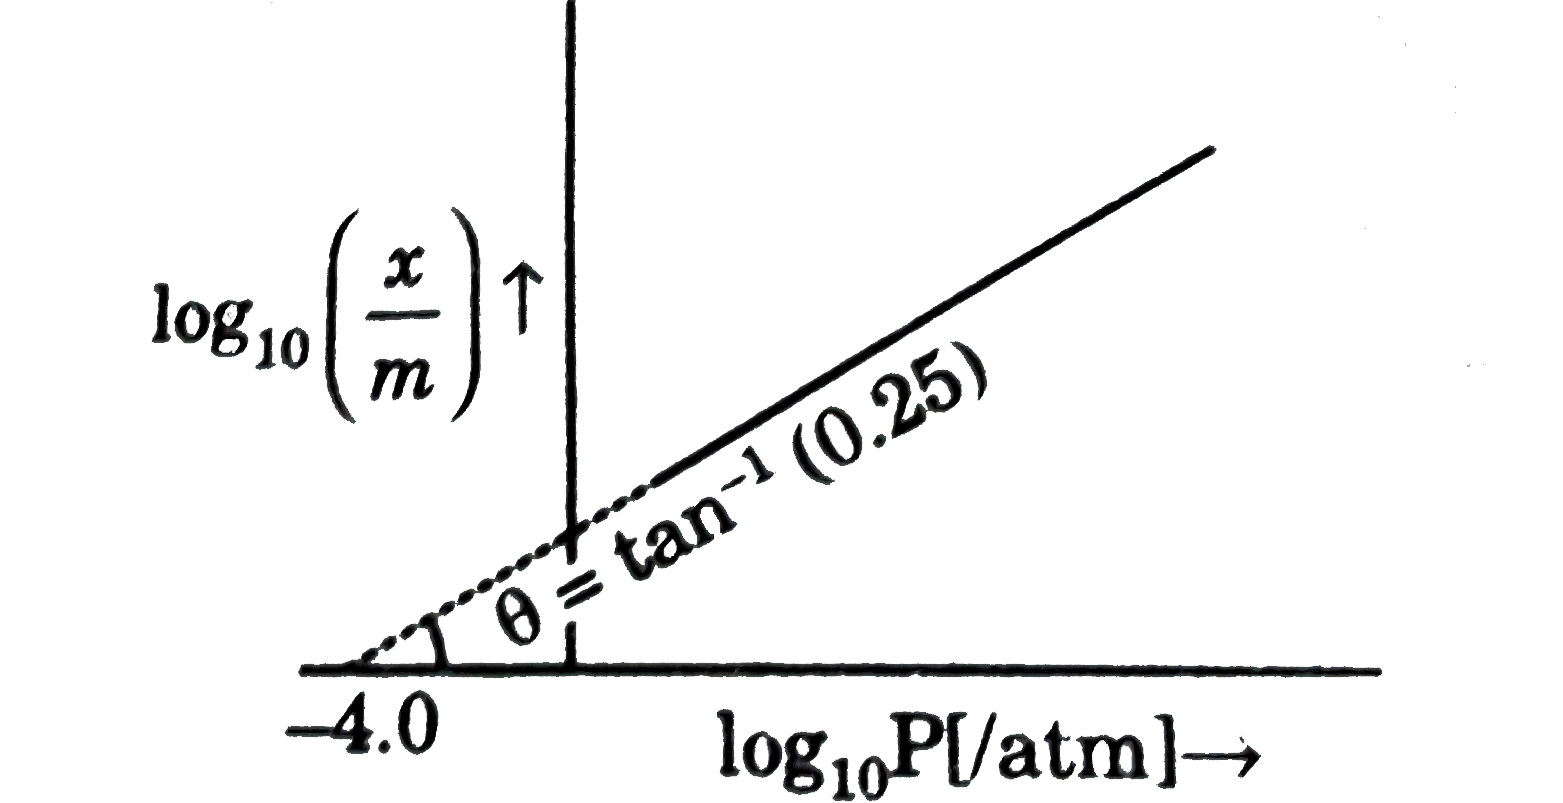
The mass of
View SolutionA,B and C react in the 1:1:1 stoichiometric ratio. The concentration of A,B and C where found to vary with time as shown in the figure below:
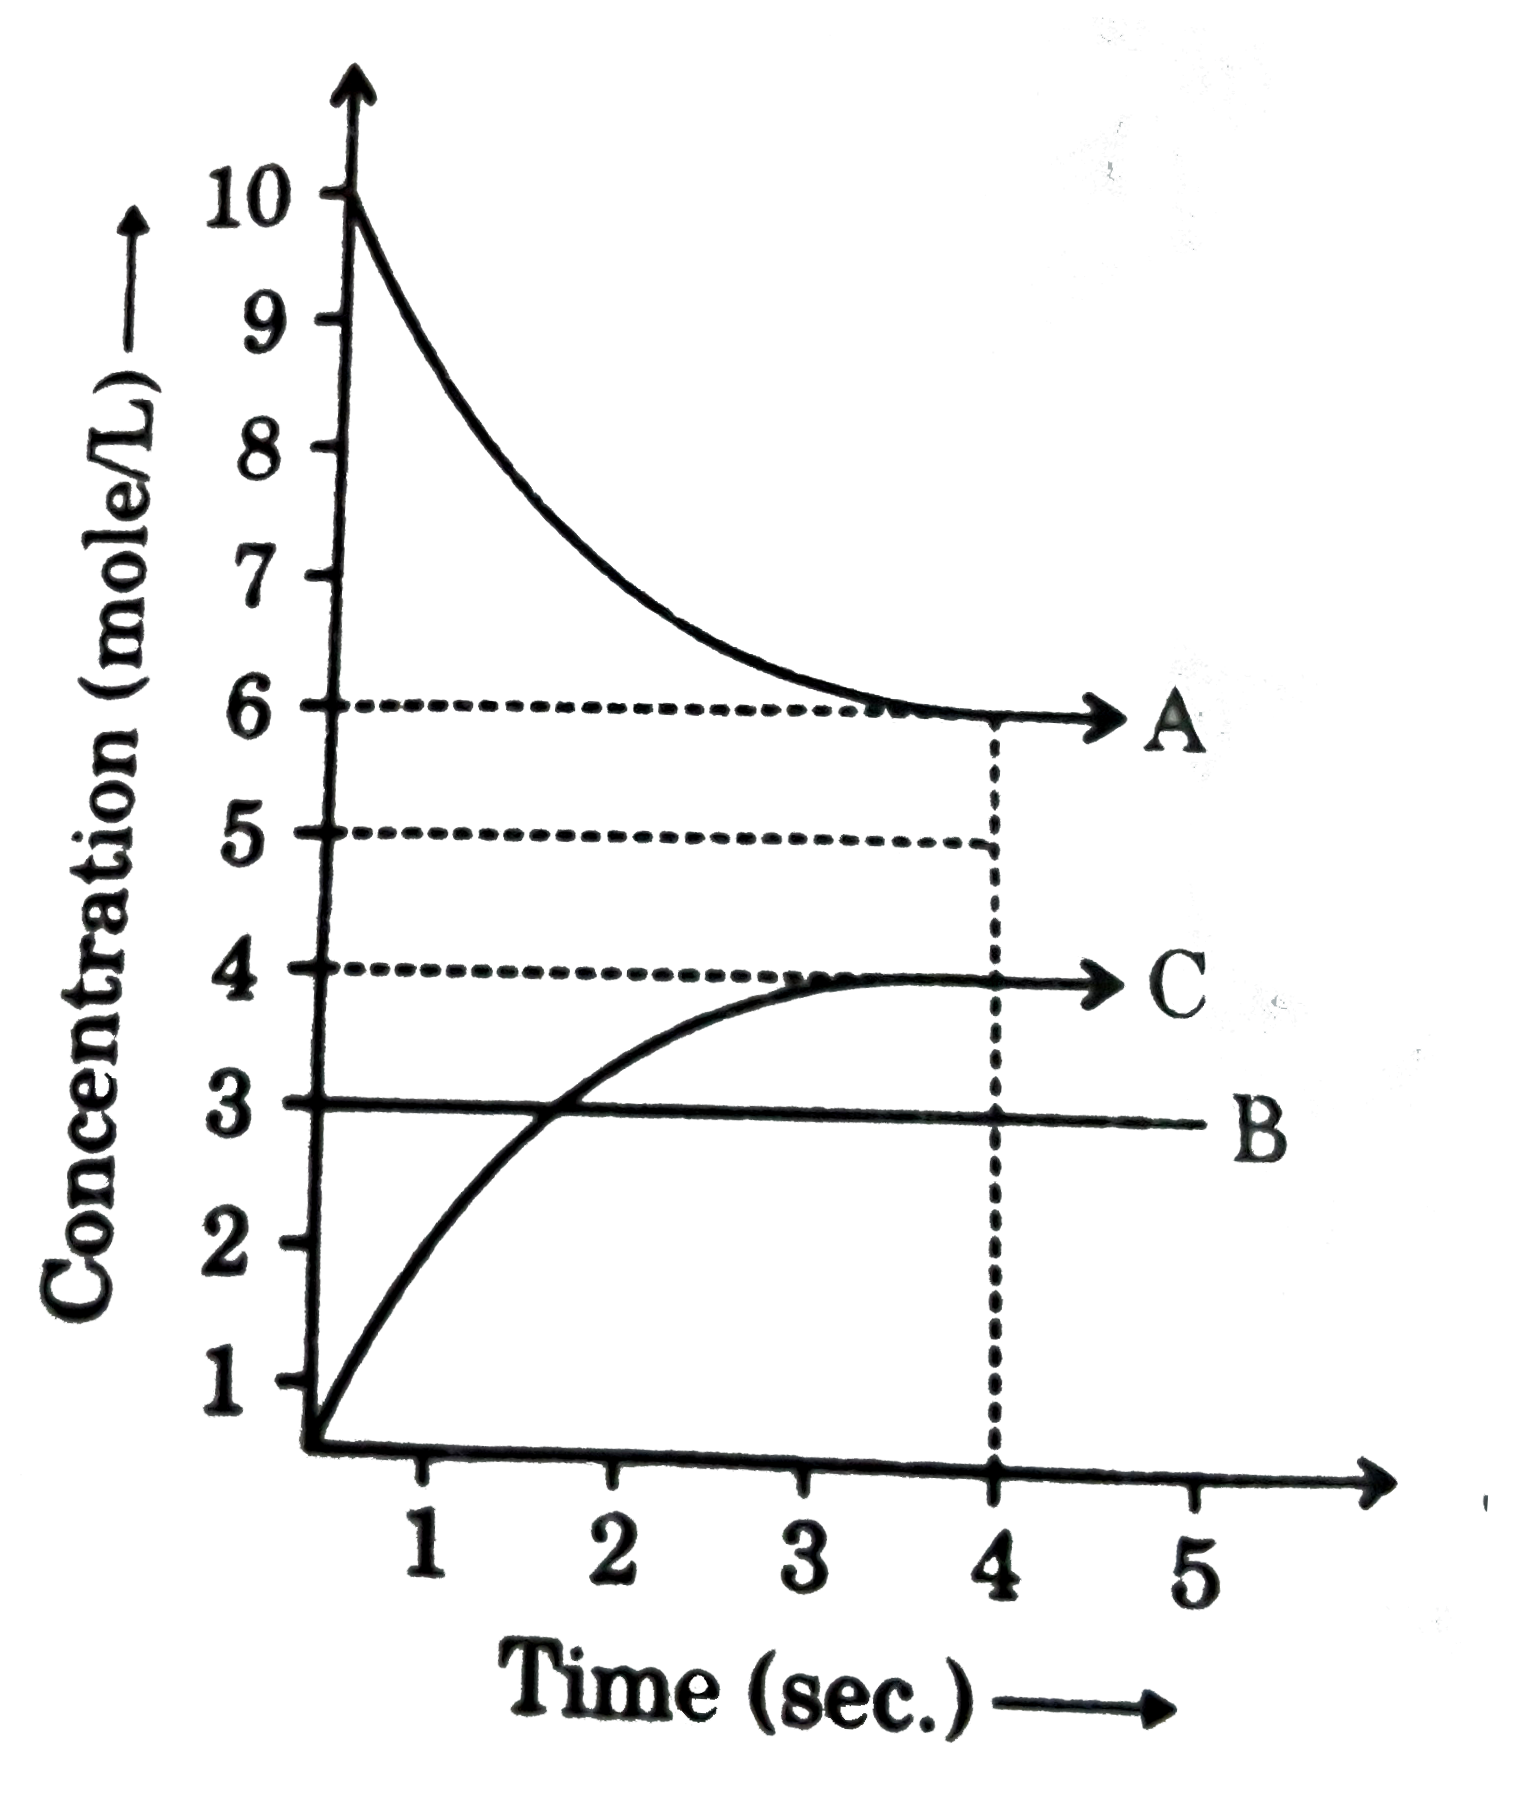
The value of equilibrium repreasented in above sketch will be :
View Solution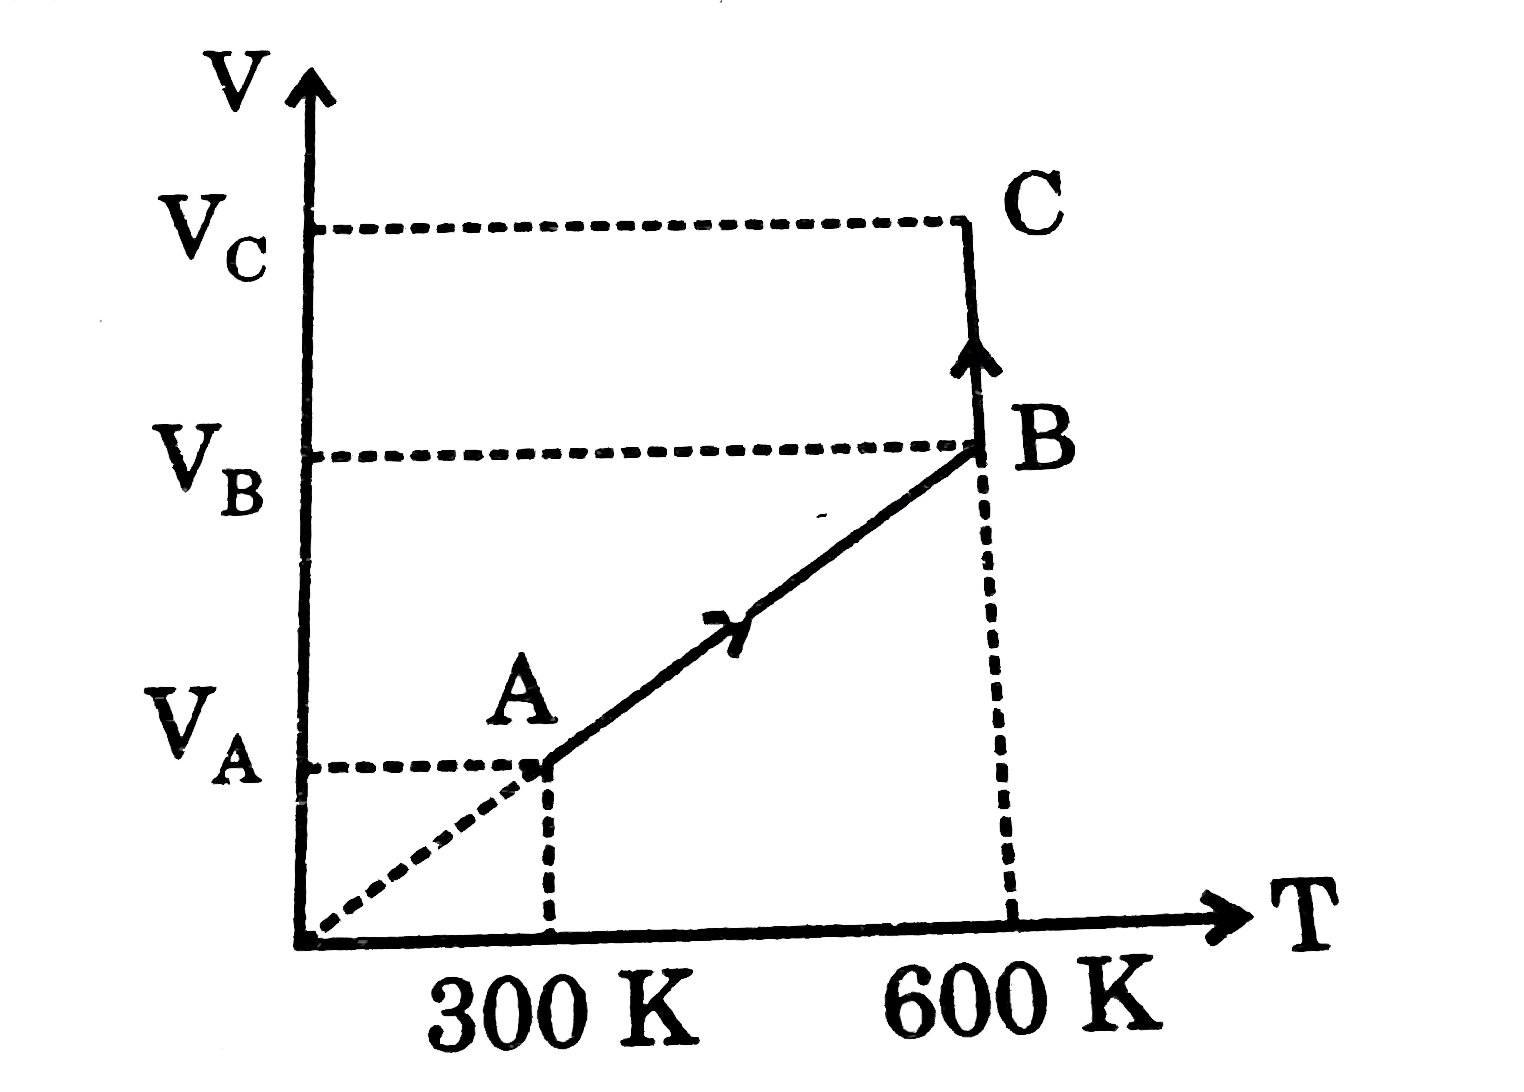
Above graph is plotted for 1 mole of ideal monoatomic gas.
Find net heat exchange for the process
View SolutionThe process by which a gas through a small hole into vacuum is called effusion. The rate of change of pressure (p) of a gas at constant temperature due to effusion of gas from a vessel of constant volume can be related to rate of change of number of molecules by the expression:
where Rate of change of number of molecules
where, k= Boltzmann constant
If under any conditions
View SolutionTitration of diprotic acid
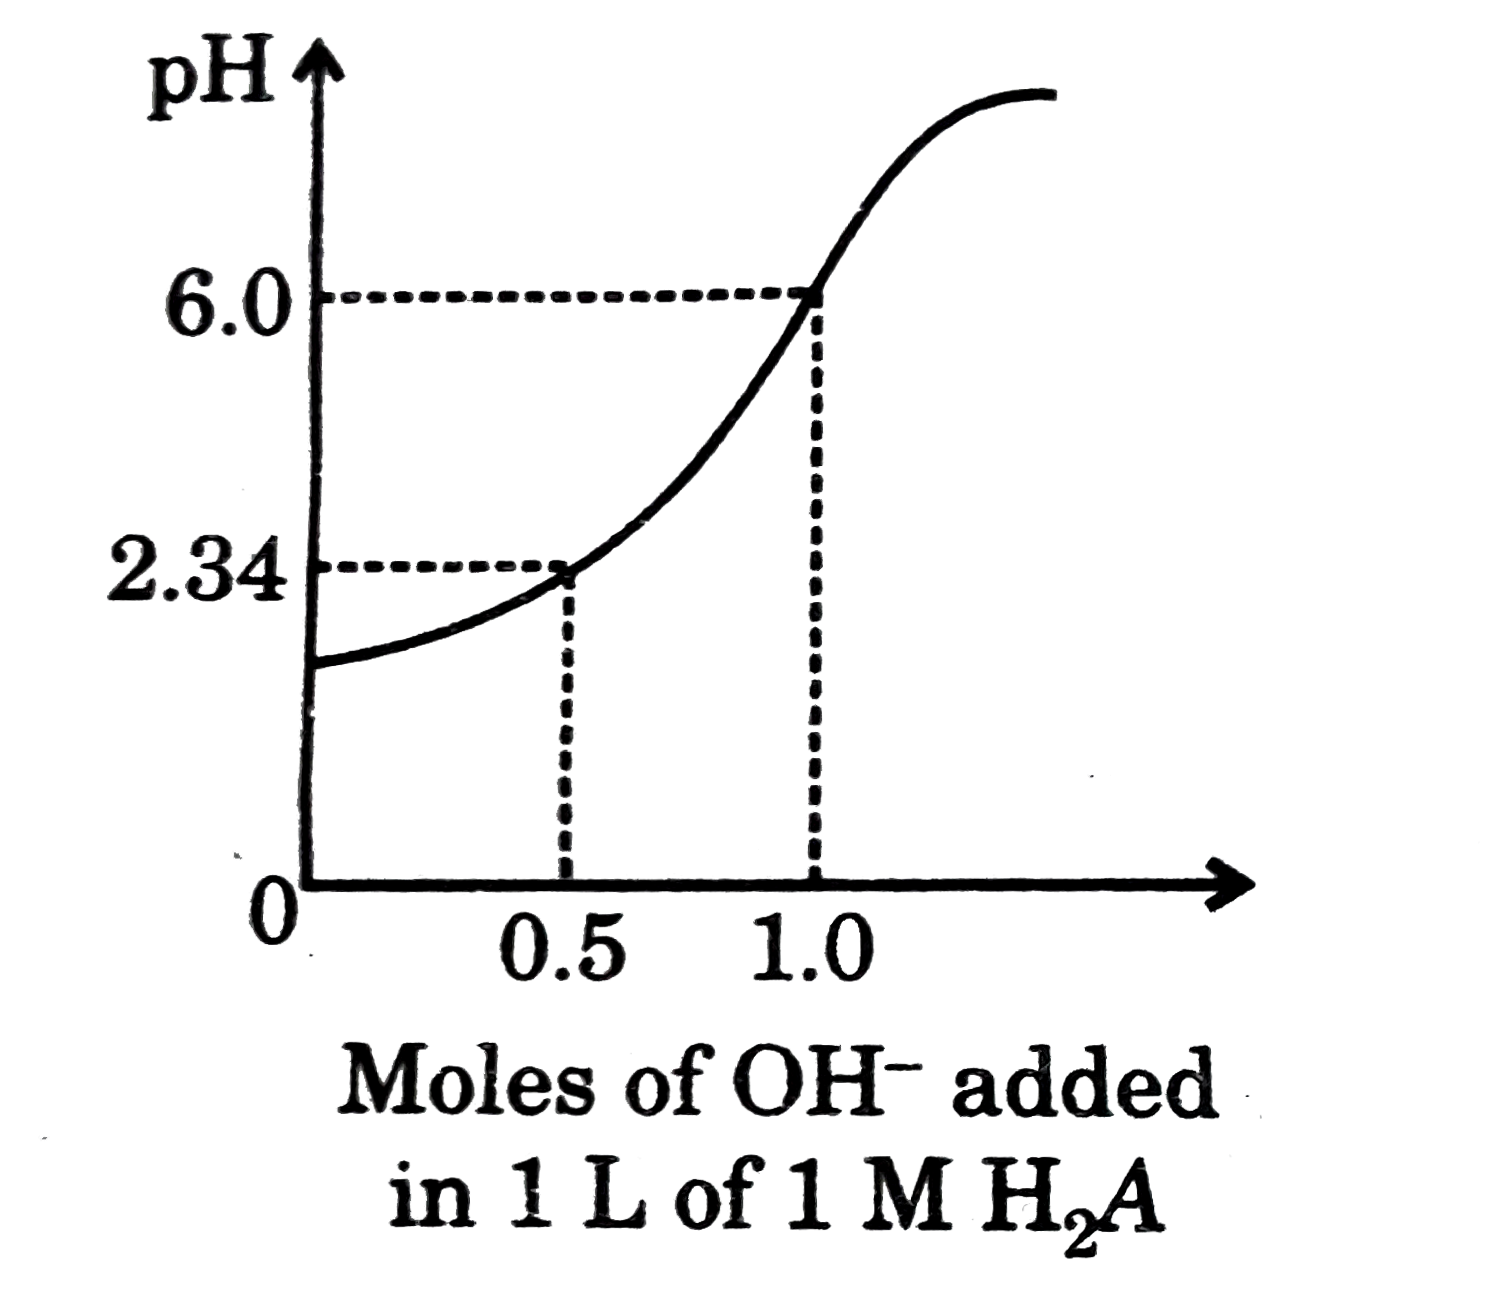
What is the pH at II equivalence point?
View SolutionTitration of diprotic acid
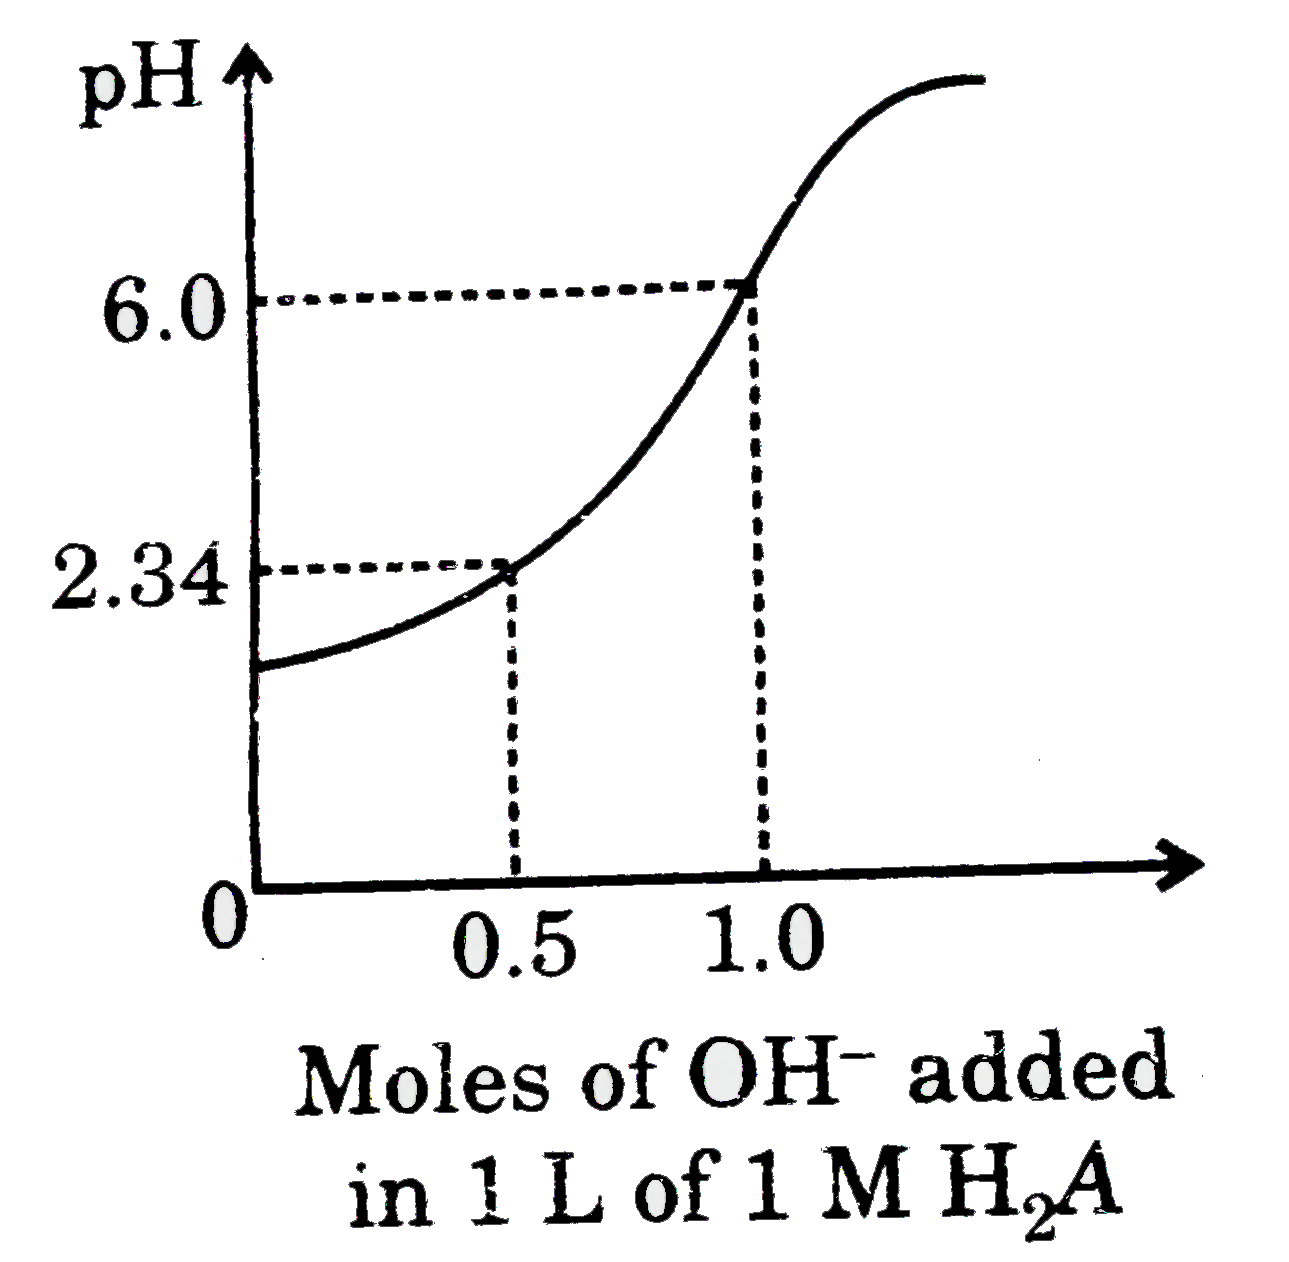
What is composition of mixture when pH of solution is
View SolutionFor an ideal gas if heat given in process AB is 10kJ then answer the following questions.
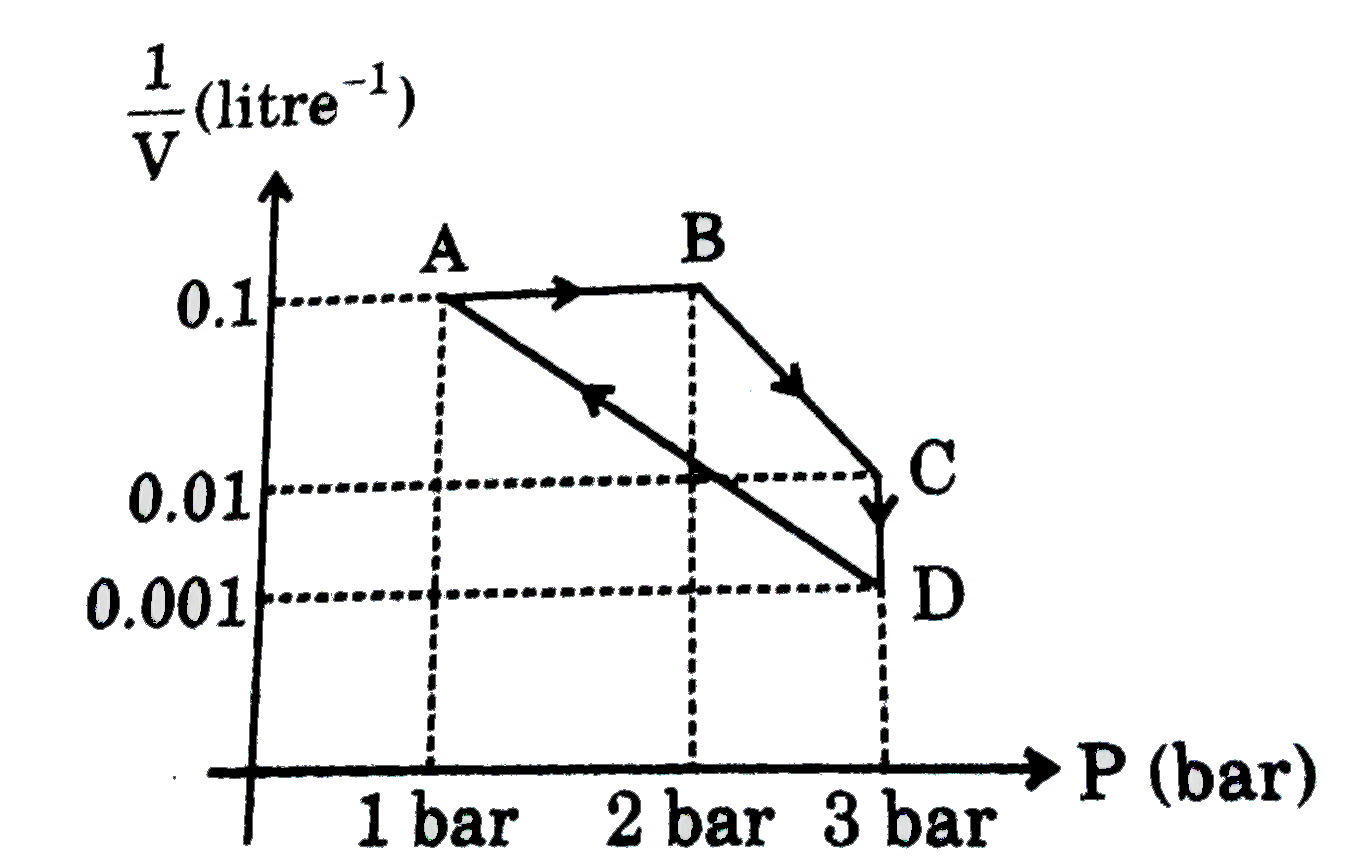
Enthalpy change in process BCD is :
View SolutionThermodynamics stability is often used in chemical reactions to predict extent of reaction or to predict the preferred product in some reaction. Thermodynamically a more stable substance will be the one which has lower Gibb's free energy.In various cases,it might be decided on the basis of enthalpy, however , that may not always be true. The thermodynamic data Therefore can be used for prdicting stability among isotopes and to decide the possible transformation.Based on this information and the data given below, answer the questions that follow.
Date:
All above data at 300K.
Density of
Density of
One such transformation is 'tin pest' which is an autocatalytic, allotropic transformation of the element tin causing deterioration of tin objects at low temperatures.
As temperature is reduced, what can be predicted for objects containing tin ?
View SolutionThis type of deviation is also expected in the following mixture :
View SolutionTotal vapour pressure of mixture of 1 mol of volatile component A(
View SolutionFigure explains elevation in boiling point when a non-volatile solute is added to a solvent. Variation of vapour pressure with temperaure and elevation in boiling point is marked.
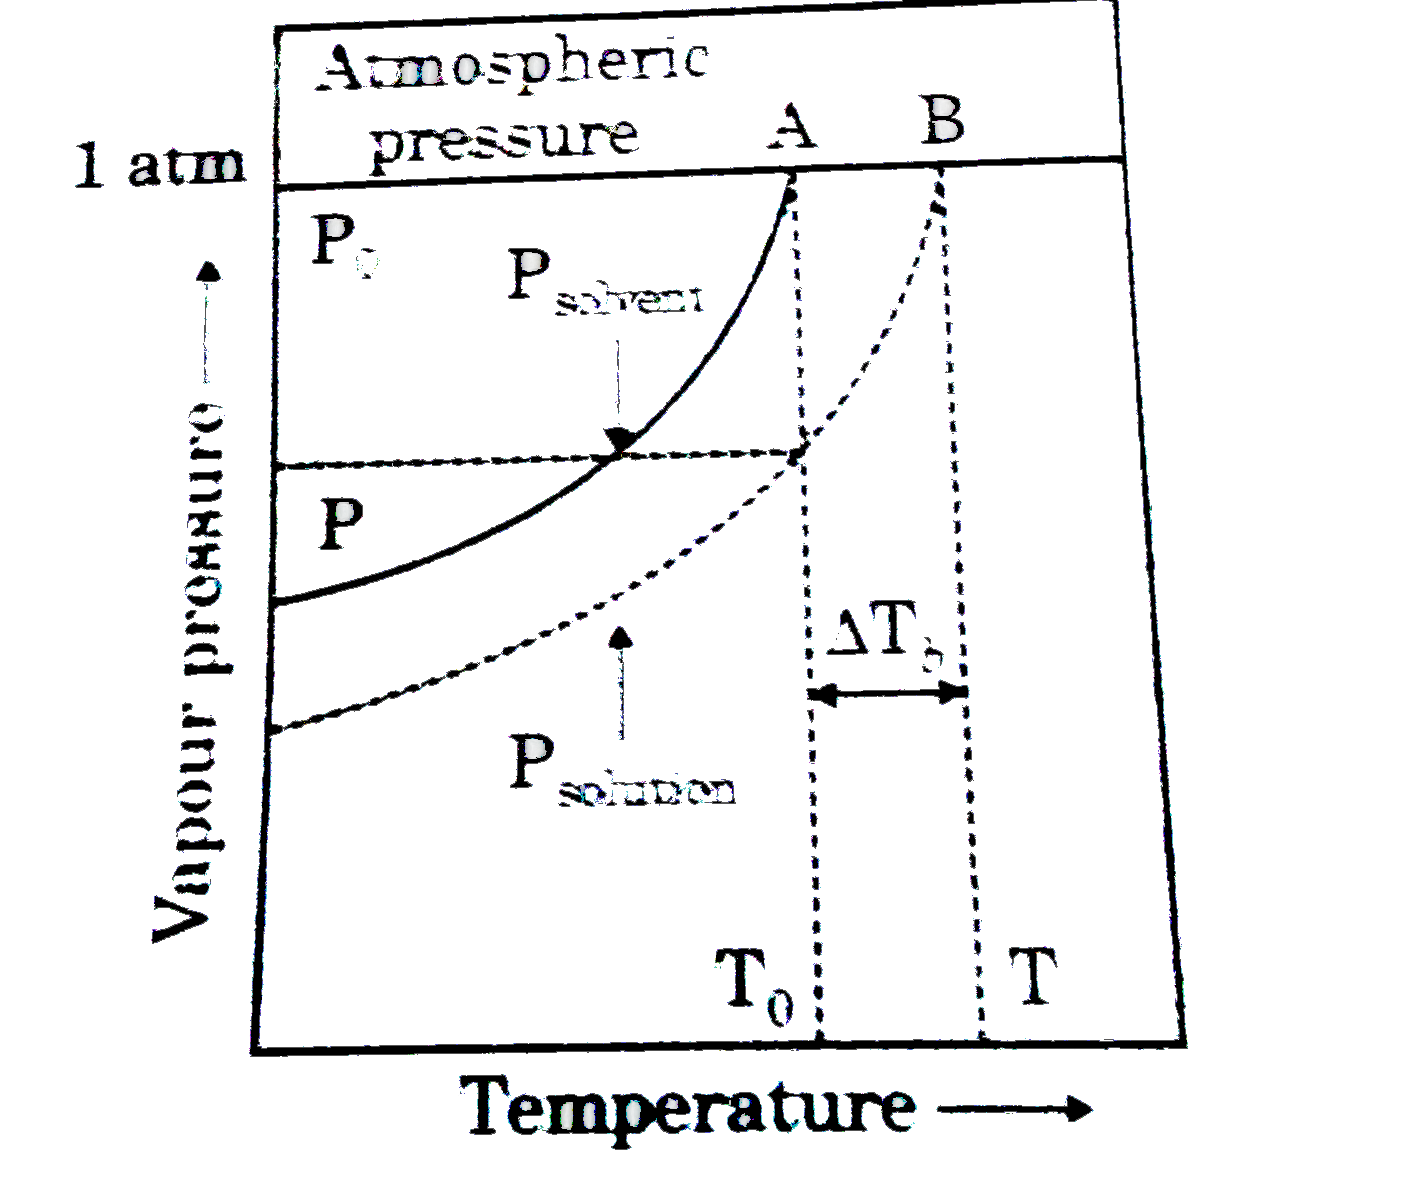
Elevation in b.p of an aqueous urea solution is
View SolutionFigure explains elevation in boiling point when a non-volatile solute is added to a solvent. Variation of vapour pressure with temperaure and elevation in boiling point is marked.
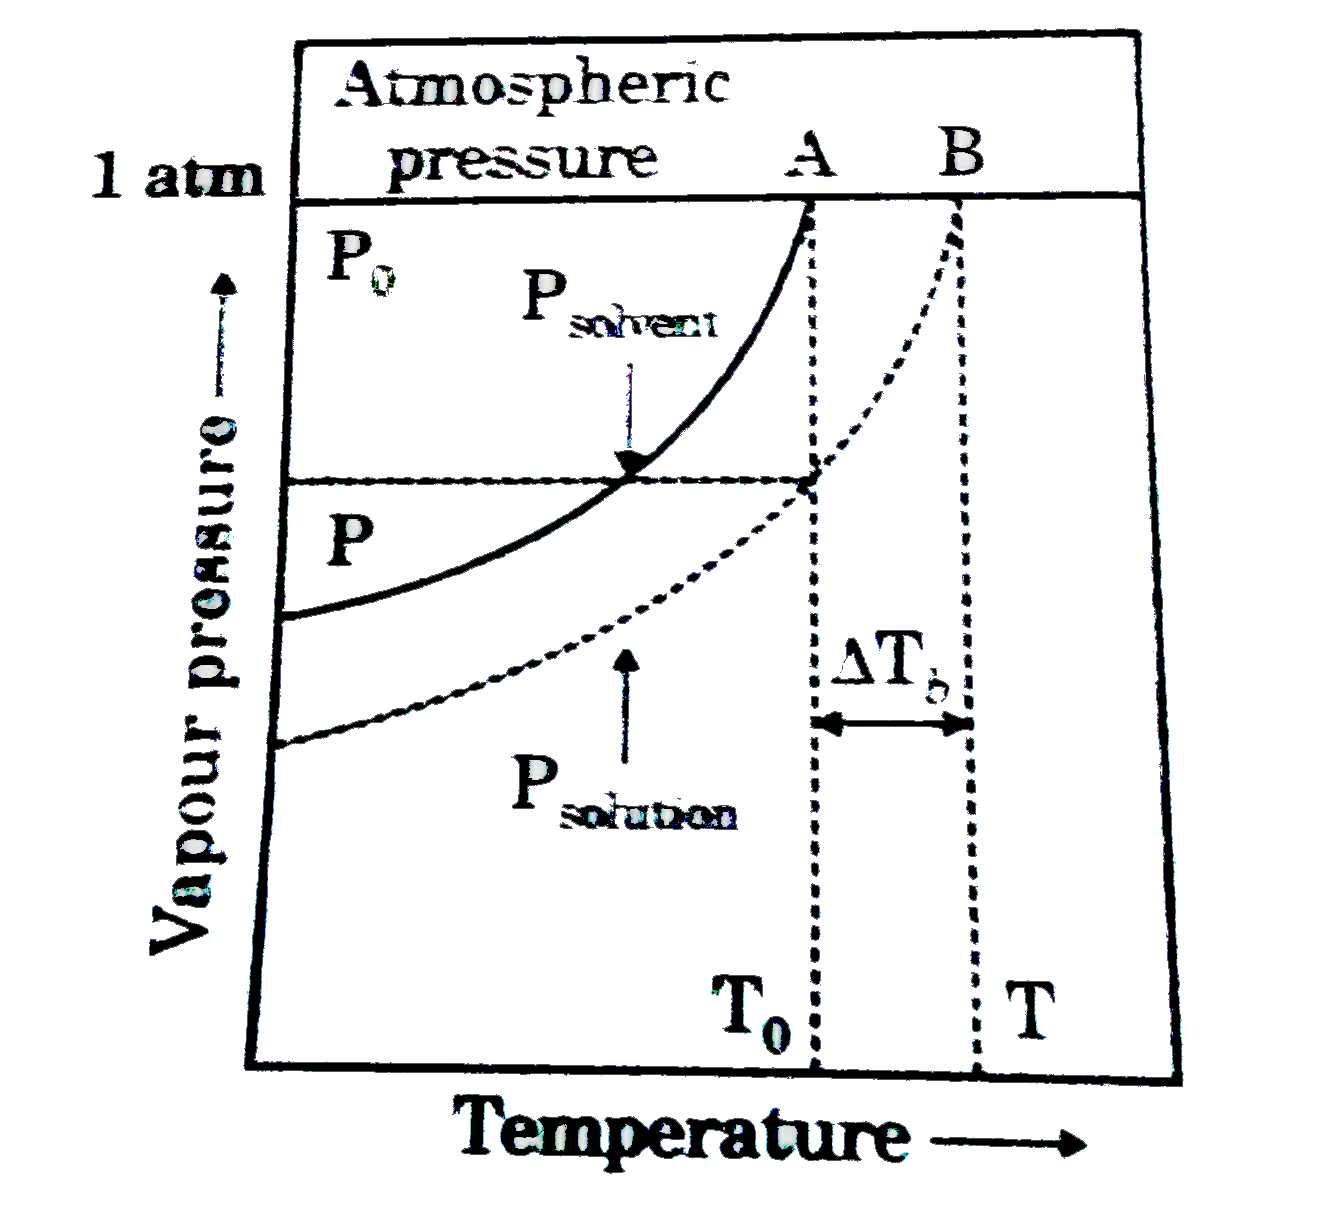
Ratio of
View SolutionAnswer the questions (given below) which are based on the following diagram. Vapour pressure plots of benzene-toluence mixture at
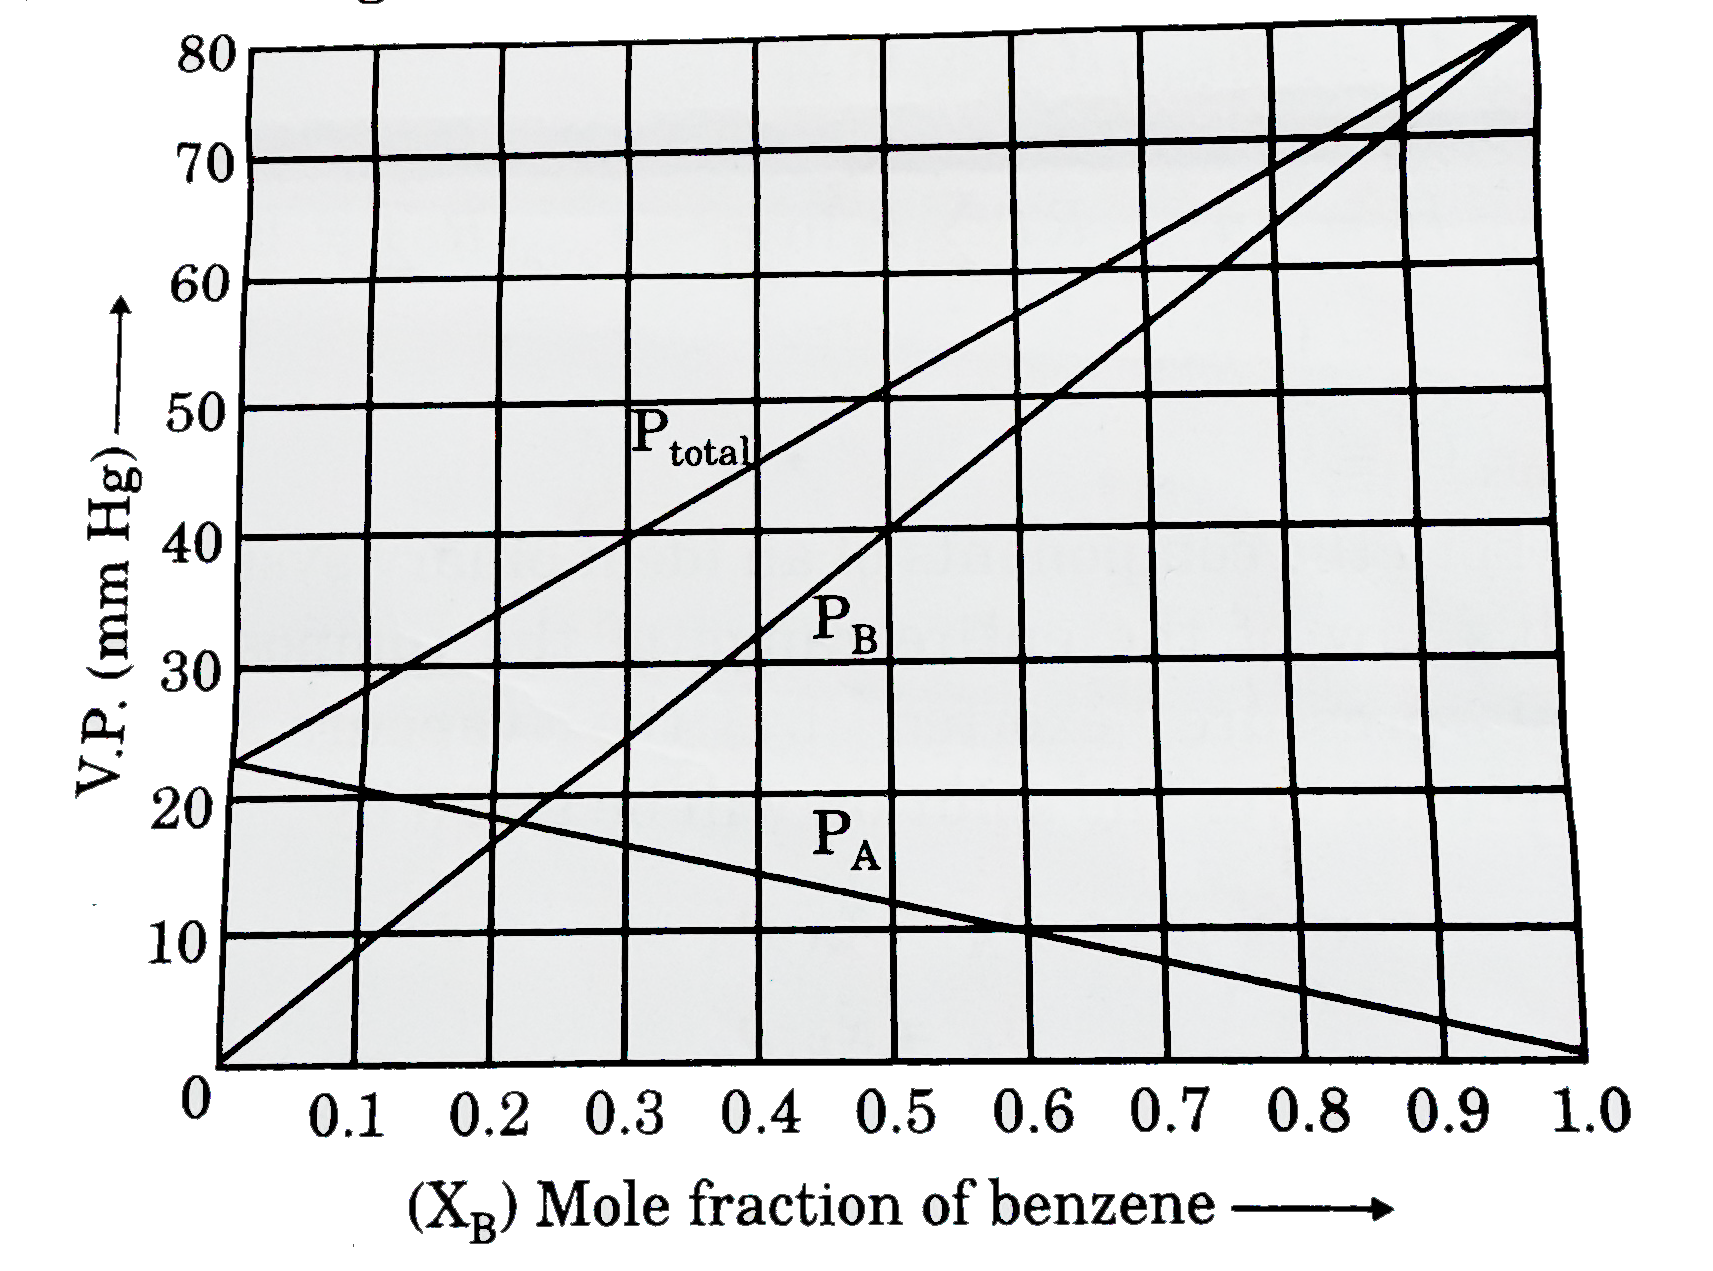
There is deviation from ideal behaviour if mixture contains:
View SolutionWhen a liquid is completely miscible with another liquid, a homogeneous solution consisting of a single phase is formed. If such a solution is placed in a closed evacuated vessel, the total pressure exerted by the vapour, after the system attained equilibrium will be equal to the sum of partial pressures of the constituents. A solution is said to be ideal if its constituents follow Raoult's law under all conditions of concentrations, i.e., where
where,
Since botli the components of an ideal binary system follow Raoult's law of the entire range of the compositions, the partial pressure exerted by the vapours of these constituents over the solution will be given by
where,
A plot of reciprocal of total pressure
View SolutionWhen a liquid is completely miscible with another liquid, a homogeneous solution consisting of a single phase is formed. If such a solution is placed in a closed evacuated vessel, the total pressure exerted by the vapour, after the system attained equilibrium will be equal to the sum of partial pressures of the constituents. A solution is said to be ideal if its constituents follow Raoult's law under all conditions of concentrations, i.e., where
where,
Since botli the components of an ideal binary system follow Raoult's law of the entire range of the compositions, the partial pressure exerted by the vapours of these constituents over the solution will be given by
where,
Two liquids A and B form an ideal solution at temperature T. when the total vapour pressure above the solution is 600 torr, the mole fraction of A in the vapour phase is 0.35 and in the liquid phase 0.70. The vapour pressure of pure B and A are:
View SolutionConsider the following partially labelled figure (graph is upto scale) for an ideal binary solution of benzene and toluence and answer the following questions.
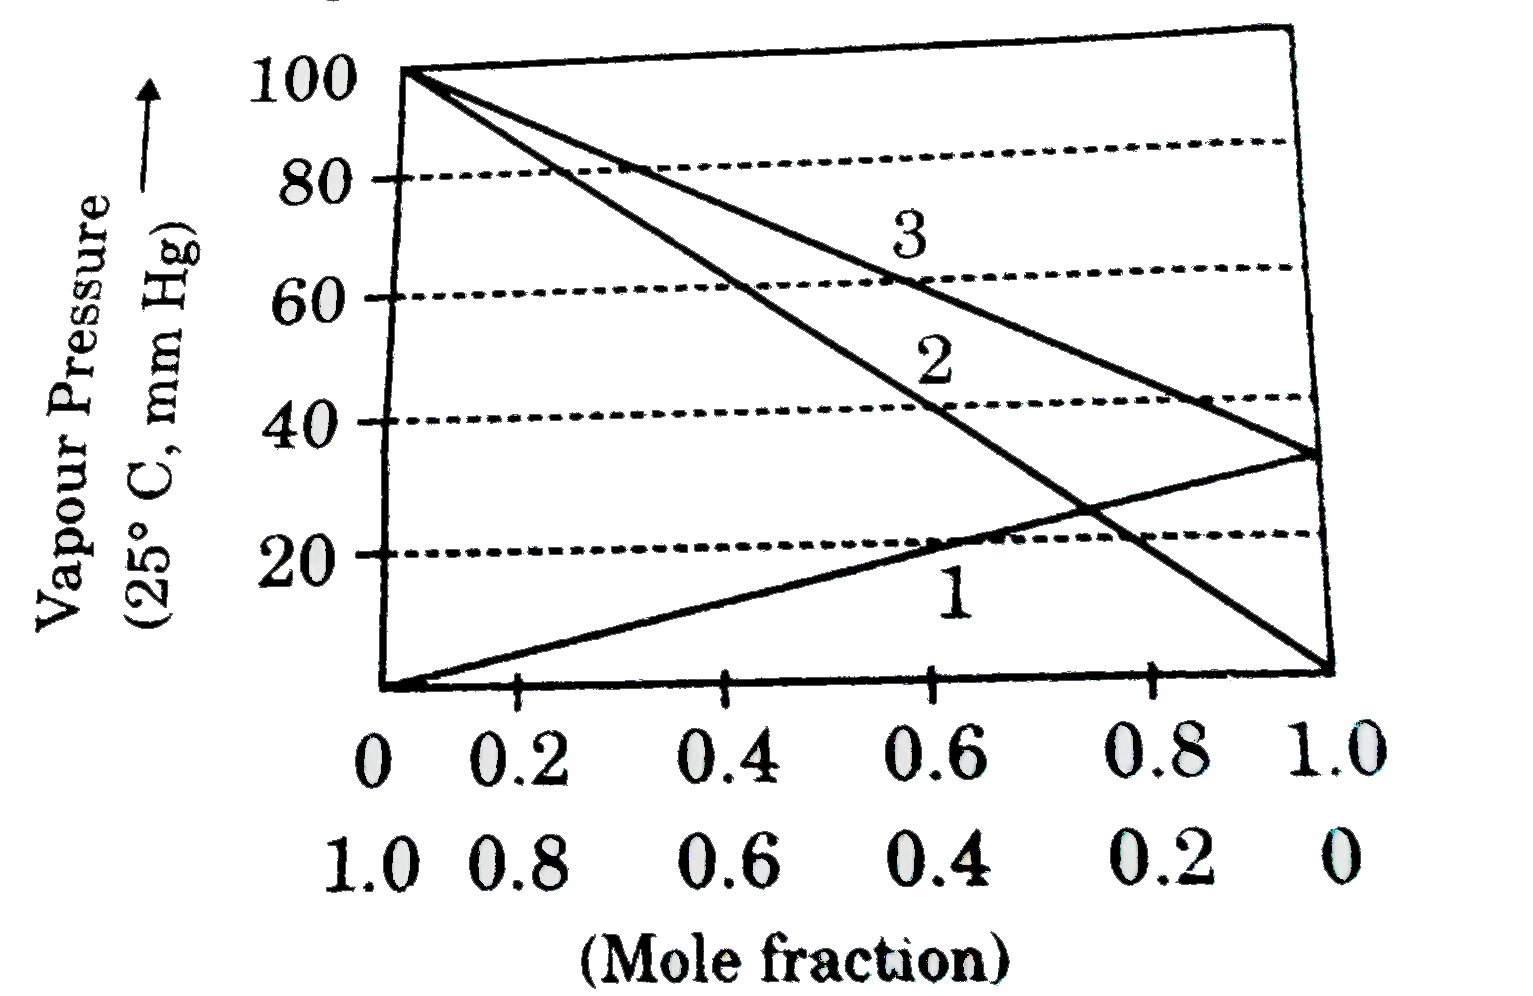
What is
View SolutionConsider the following partially labelled figure (graph is upto scale) for an ideal binary solution of benzene and toluence and answer the following questions.
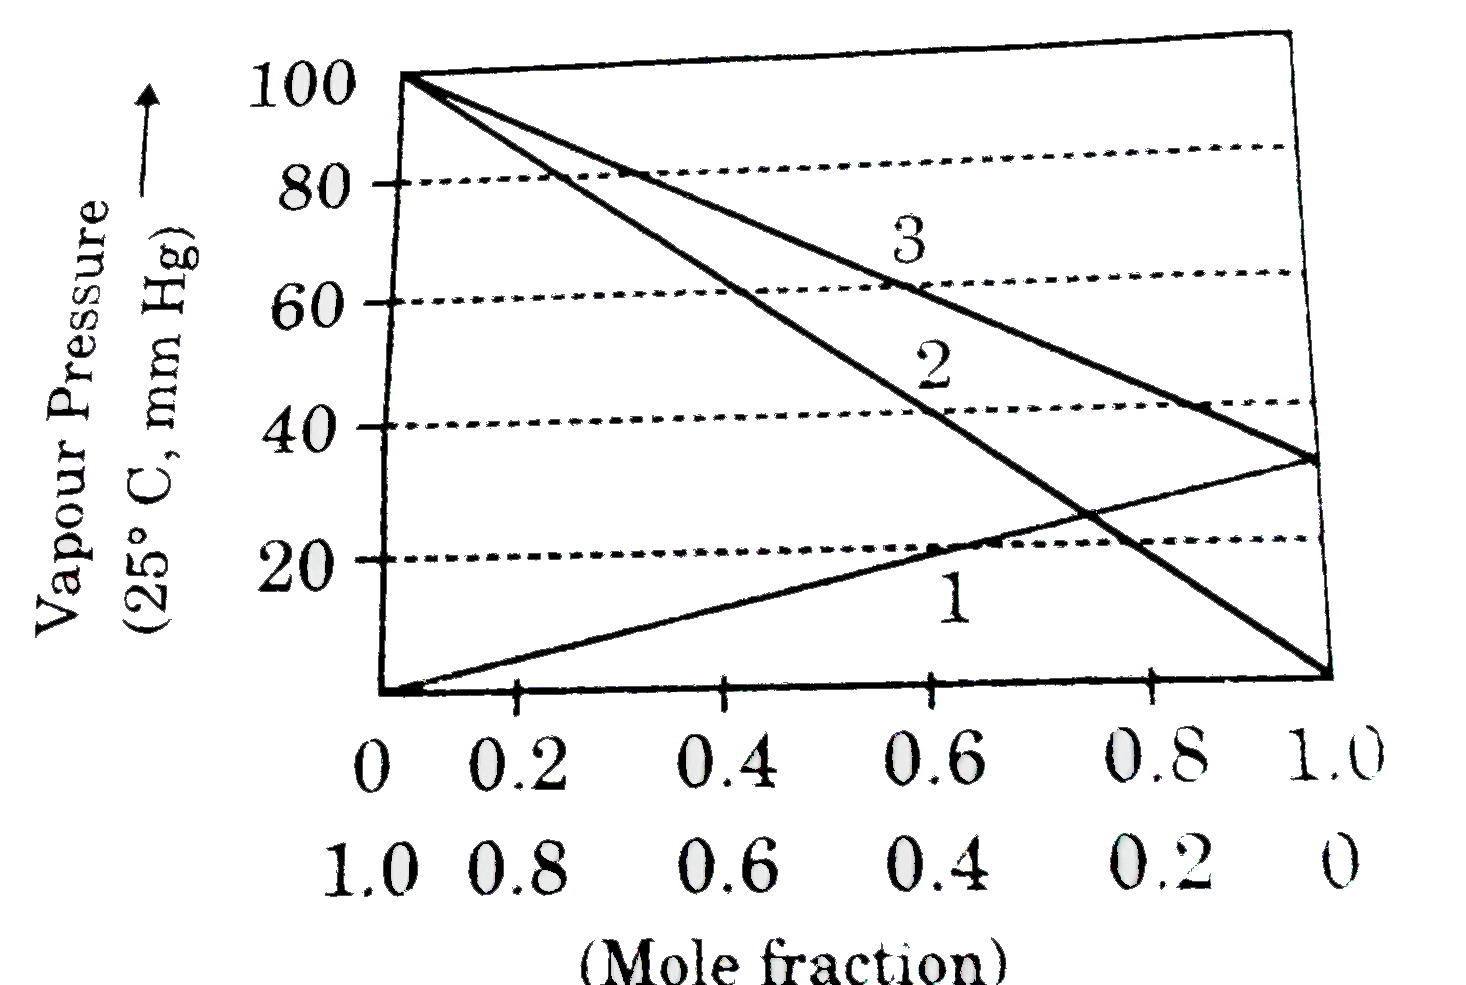
View SolutionConsider the following partially labelled figure (graph is upto scale) for an ideal binary solution of benzene and toluence and answer the following questions.
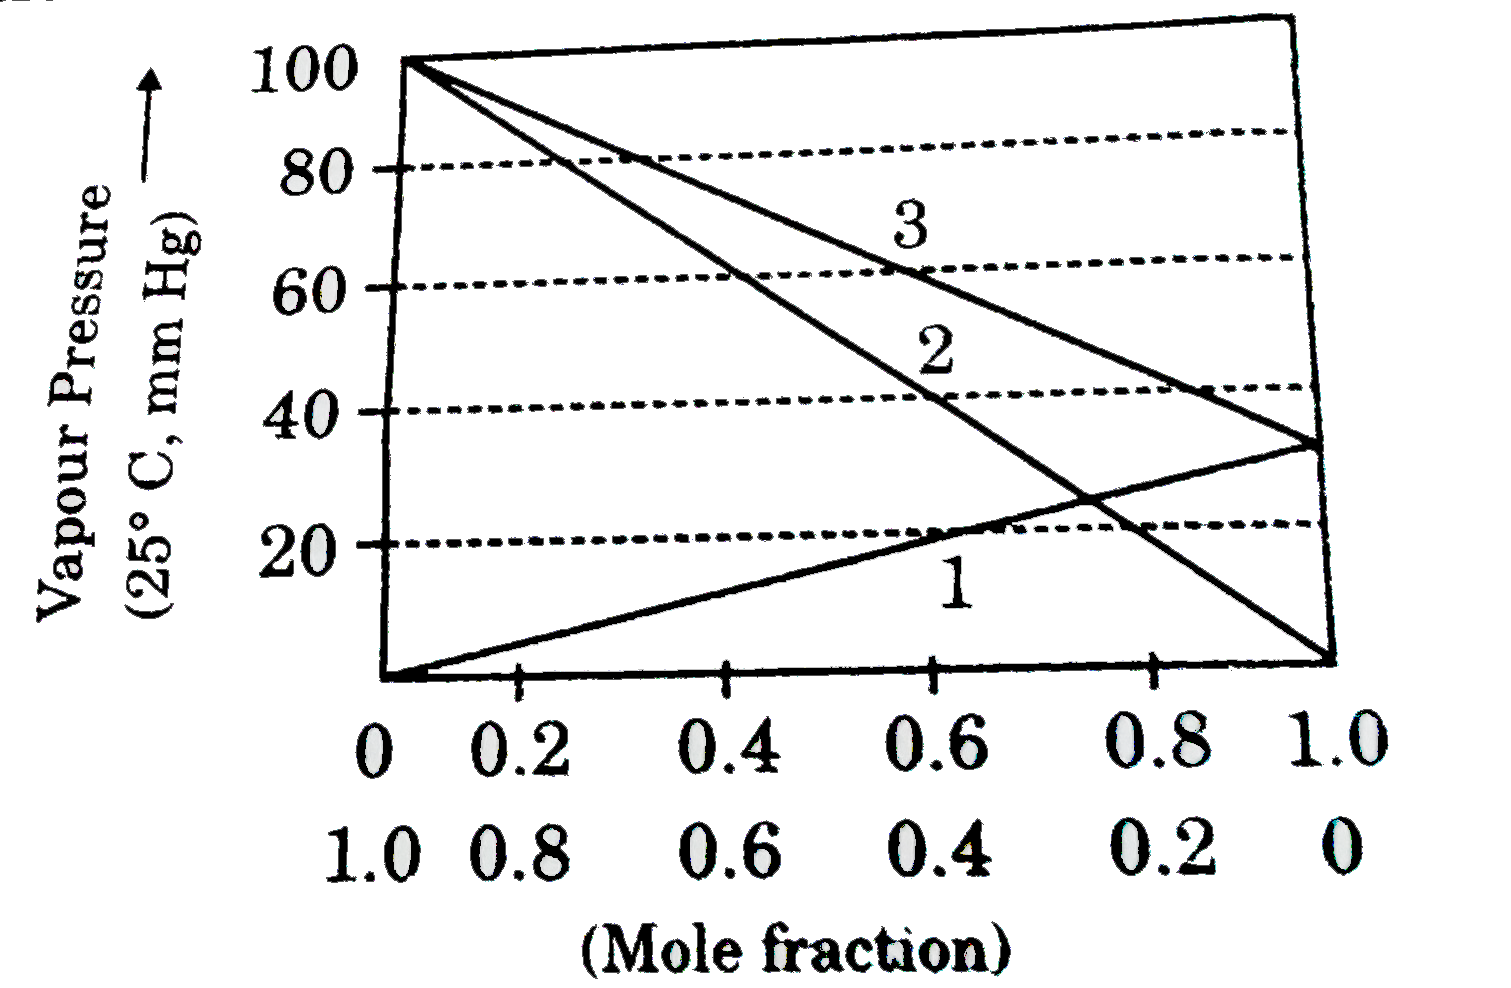
The composition of liquid for which the vapour contains equal number of benzene and toluence molecules is about:
View SolutionConsider the following partially labelled figure (graph is upto scale) for an ideal binary solution of benzene and toluence and answer the following questions.
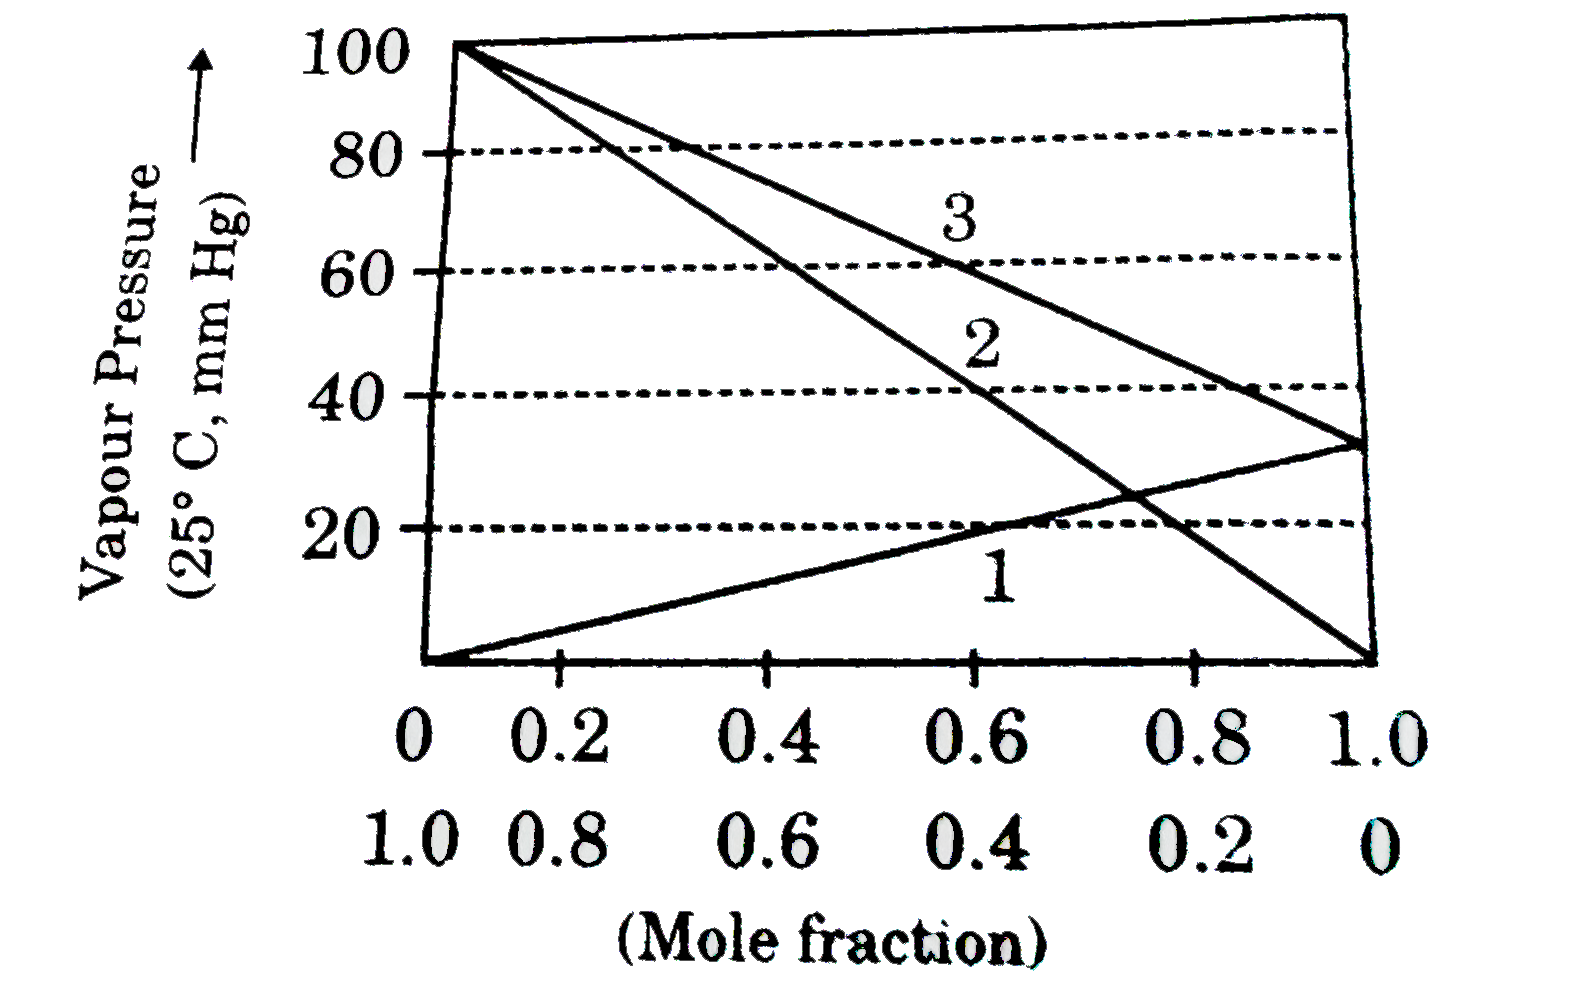
View SolutionConsider the following partially labelled figure (graph is upto scale) for an ideal binary solution of benzene and toluence and answer the following questions.
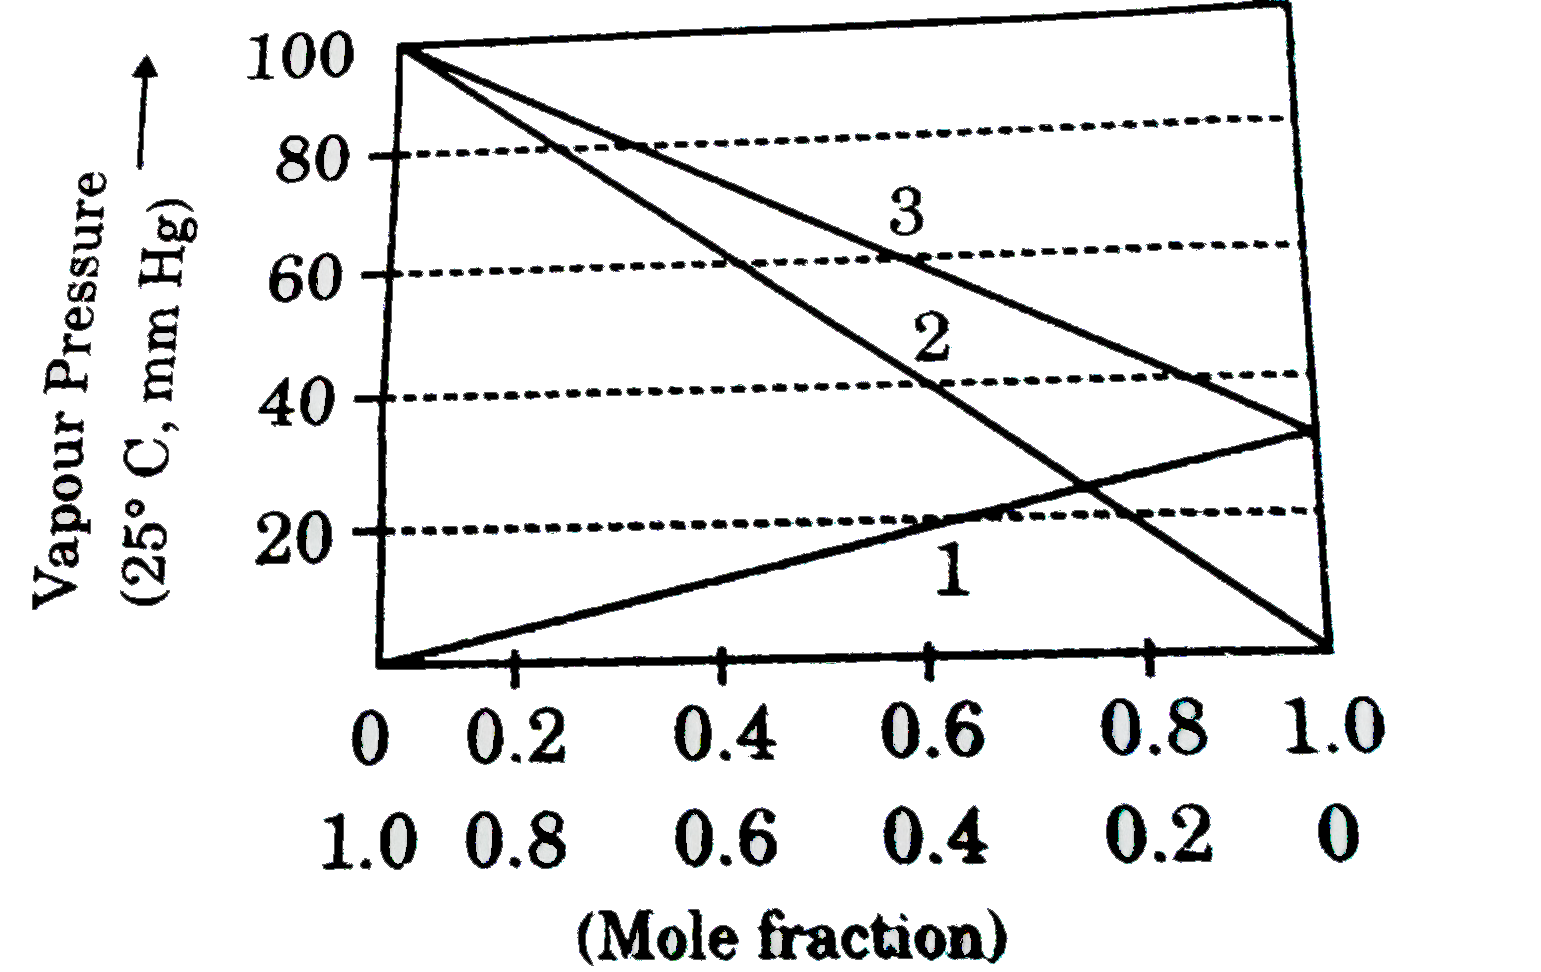
Which laws are exemplified by the diagram ?
View SolutionOne moles of an ideal monoatomic gas undergo the state change as shown in following graph (ln 2 = 0.7)
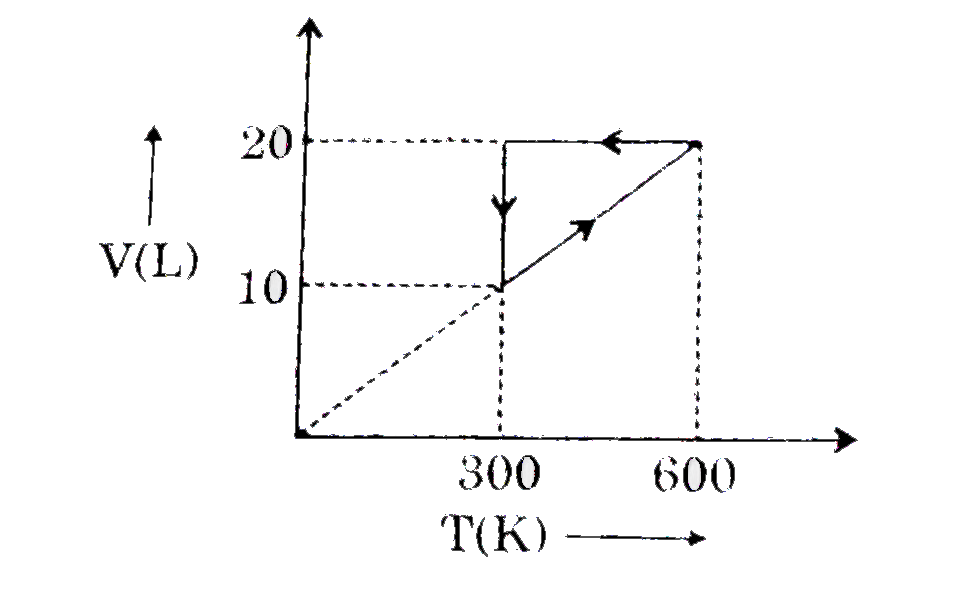
Efficiency of the cycle will be :
View Solution
Comprehension questions and complete solutions for chapter GRAPHICAL INTERPRETATION of GRB CHEMISTRY (HINGLISH) of Class 12
All Exercises from GRB PUBLICATION Class 12 CHEMISTRY GRAPHICAL INTERPRETATION
- A. Thermodynamics
- Atomic Sturcture
- B. Gaseous State
- C. Atomic Sturcture
- Chemical Equilibrium
- Chemical Kinetics
- Comprehension
- Comprehension 1
- Comprehension 10
- Comprehension 11
- Comprehension 12
- Comprehension 13
- Comprehension 14
- Comprehension 15
- Comprehension 16
- Comprehension 17
- Comprehension 18
- Comprehension 19
- Comprehension 2
- Comprehension 20
- Comprehension 21
- Comprehension 22
- Comprehension 23
- Comprehension 24
- Comprehension 25
- Comprehension 26
- Comprehension 27
- Comprehension 28
- Comprehension 29
- Comprehension 3
- Comprehension 4
- Comprehension 5
- Comprehension 6
- Comprehension 7
- Comprehension 8
- Comprehension 9
- D. Liquid Solutions
- E. Surface Chemistry
- Electrochemistry
- F. Ionic Equilibrium
- G. Chemical Equilibrium
- Gaseous State
- H. Chemical Kinetics
- I.Electrochemistry
- Ionic Equilibrium
- Liquid Solutions
- Match The Column Type
- Multiple Objective Type
- Subjective Type
- Surface Chemistry
- Thermodynamics