Complete Solutions to Chemical Kinetics of chapter GRAPHICAL INTERPRETATION of Class 12 book with complete answers and questions
| Class 12 | CHEMISTRY |
| Chapter | GRAPHICAL INTERPRETATION |
| GRB PUBLICATION | Chemical Kinetics |
| Number Of Questions | 80 |
| Academic Year | 2023-24 |
Which of the following graphs is incorrect regarding rate constant (k) and absolute temperature ? [Symbols have usual meaning]
View SolutionFor the reaction represented by the accompanying diagram, which reaction rate is the greatest ?
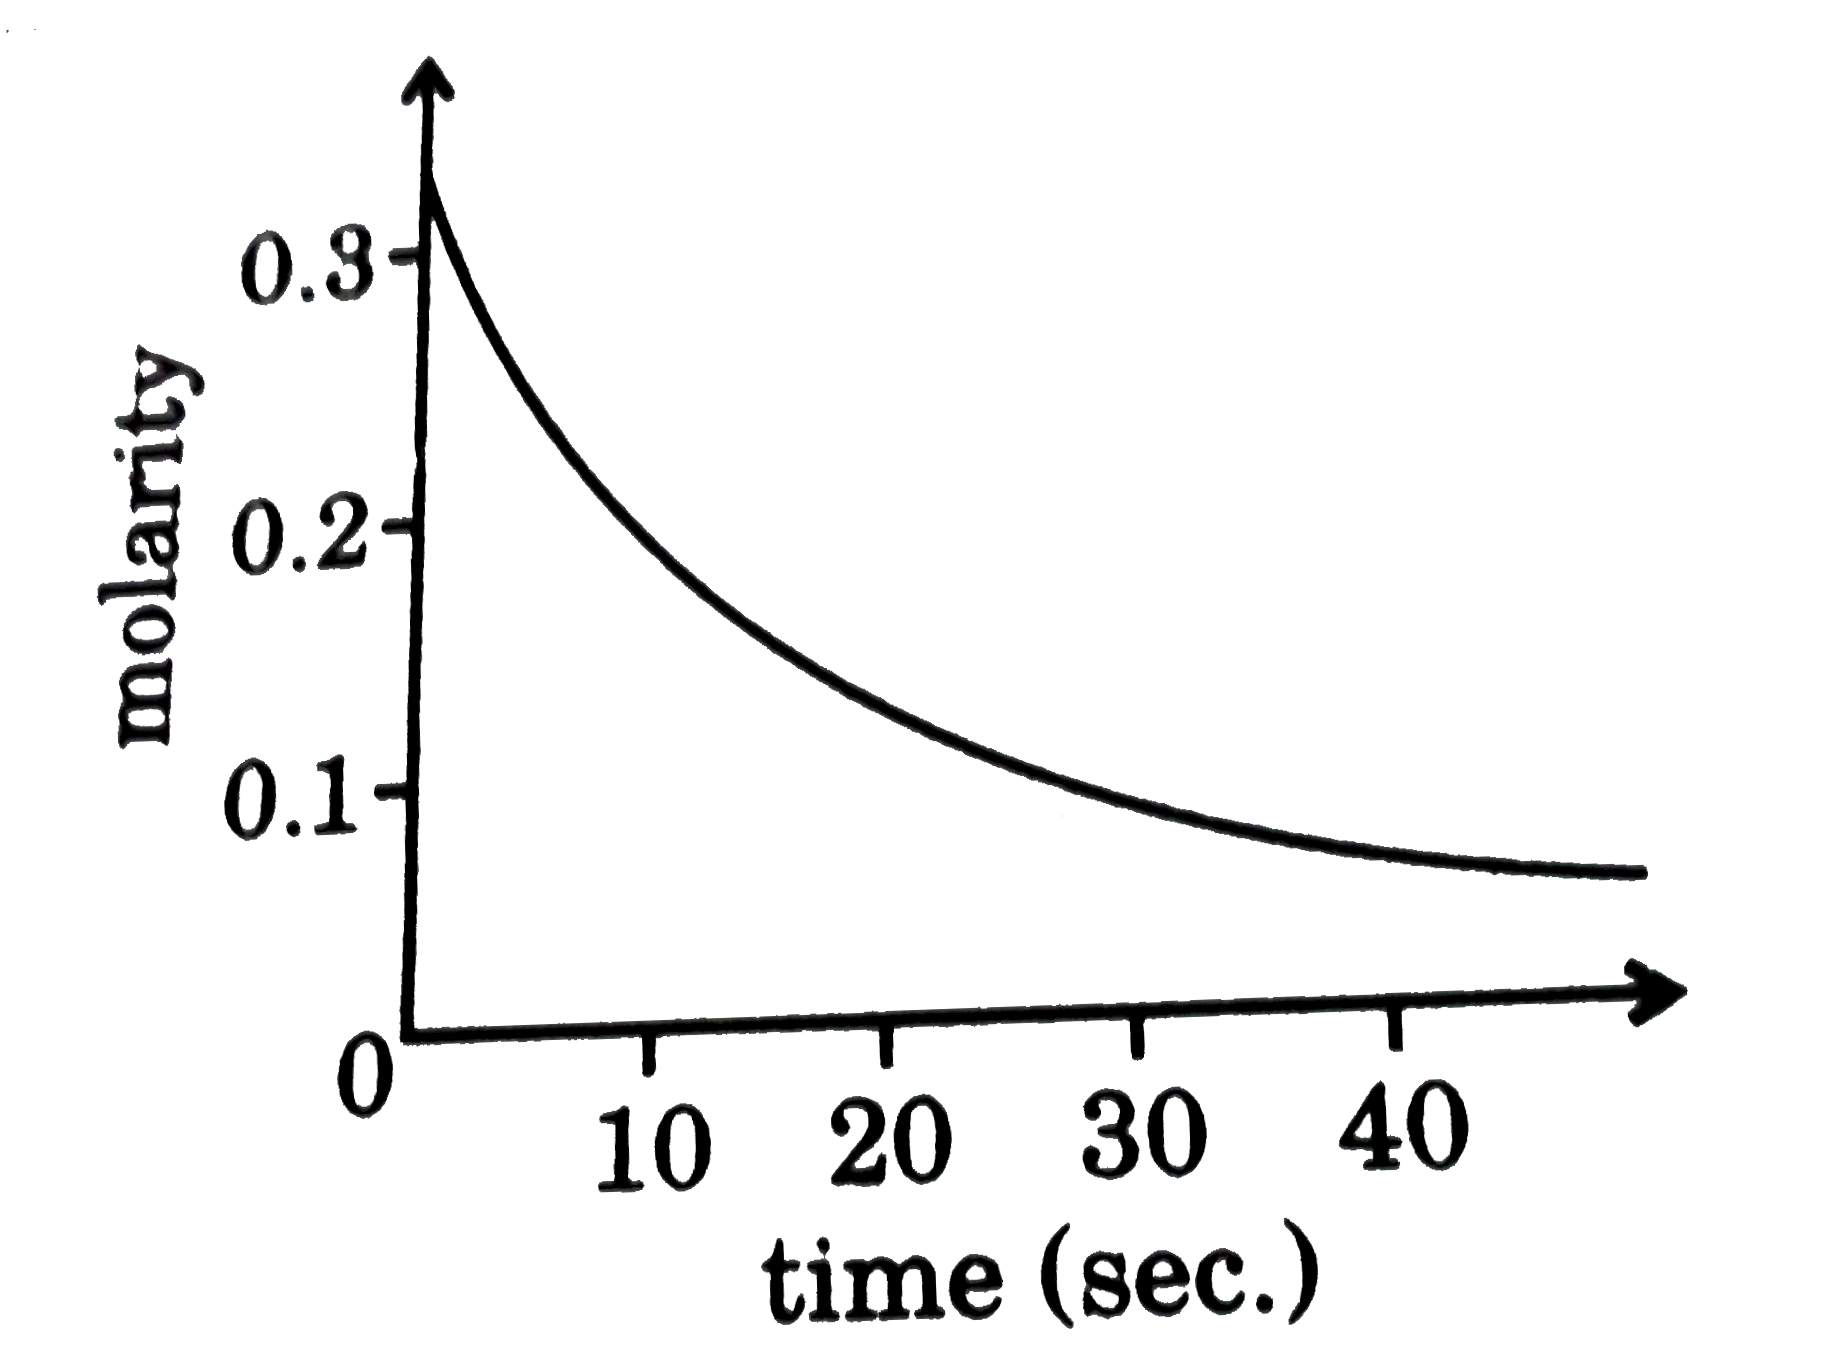
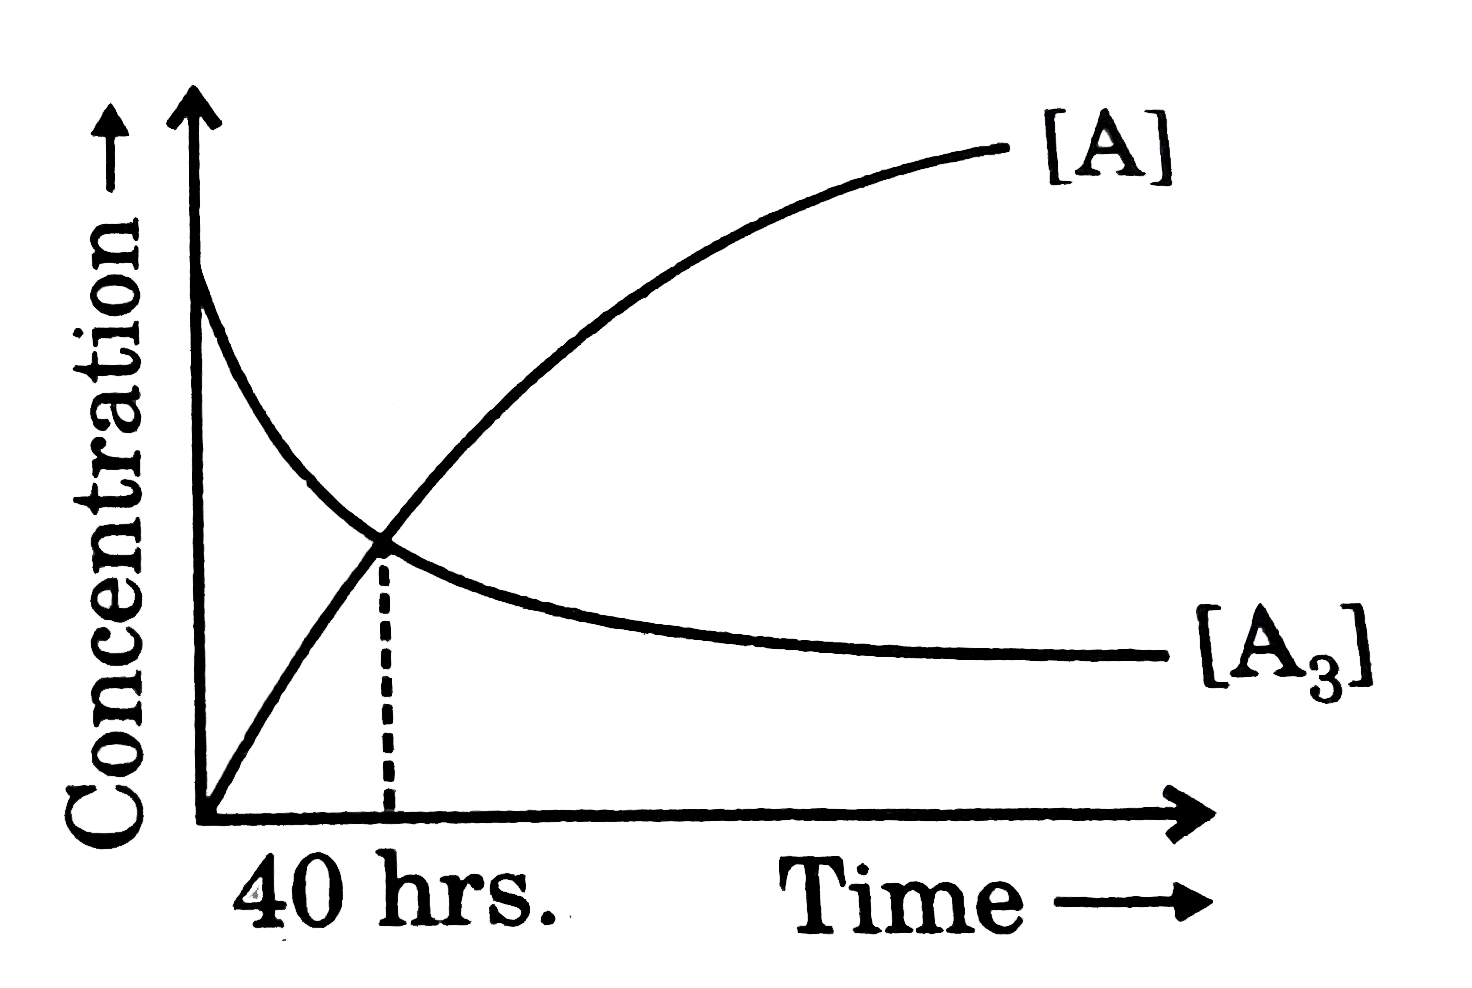
View SolutionA substance A undergoes sequential reaction as shown
View SolutionWhich of the following graph is correct for a first order reaction of the type
Where [] represents concentration.
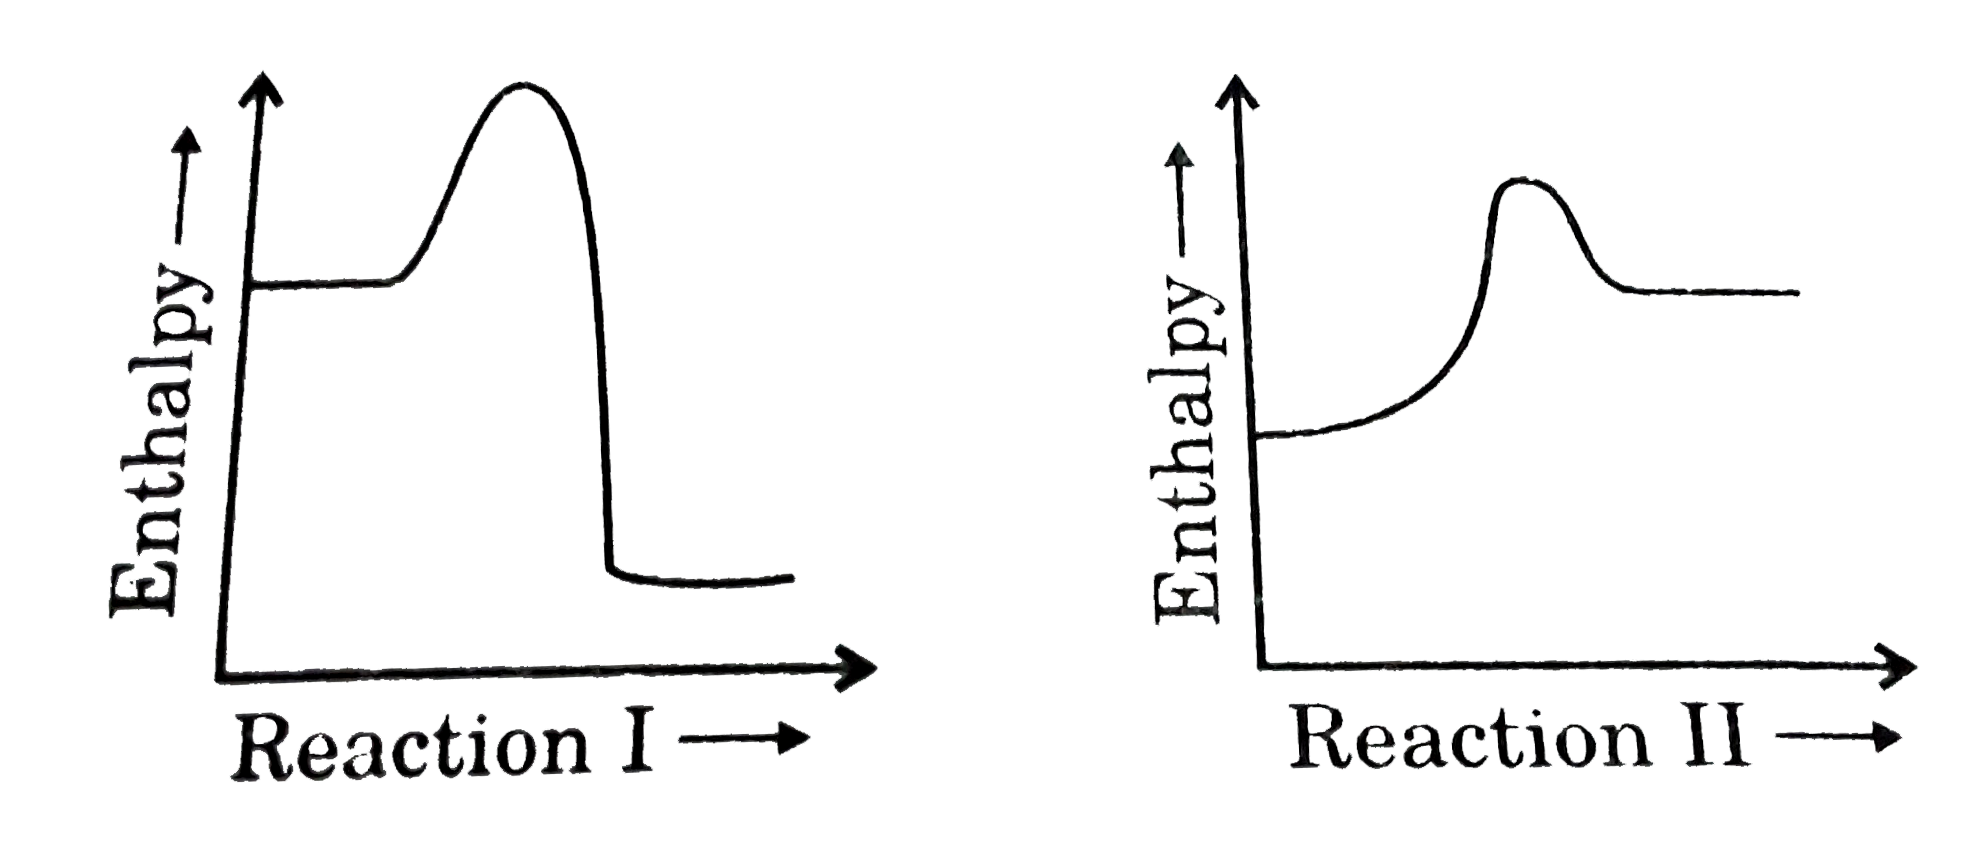
View SolutionFor the two reactions
Reaction I:
Reaction II:
following curves are plotted.
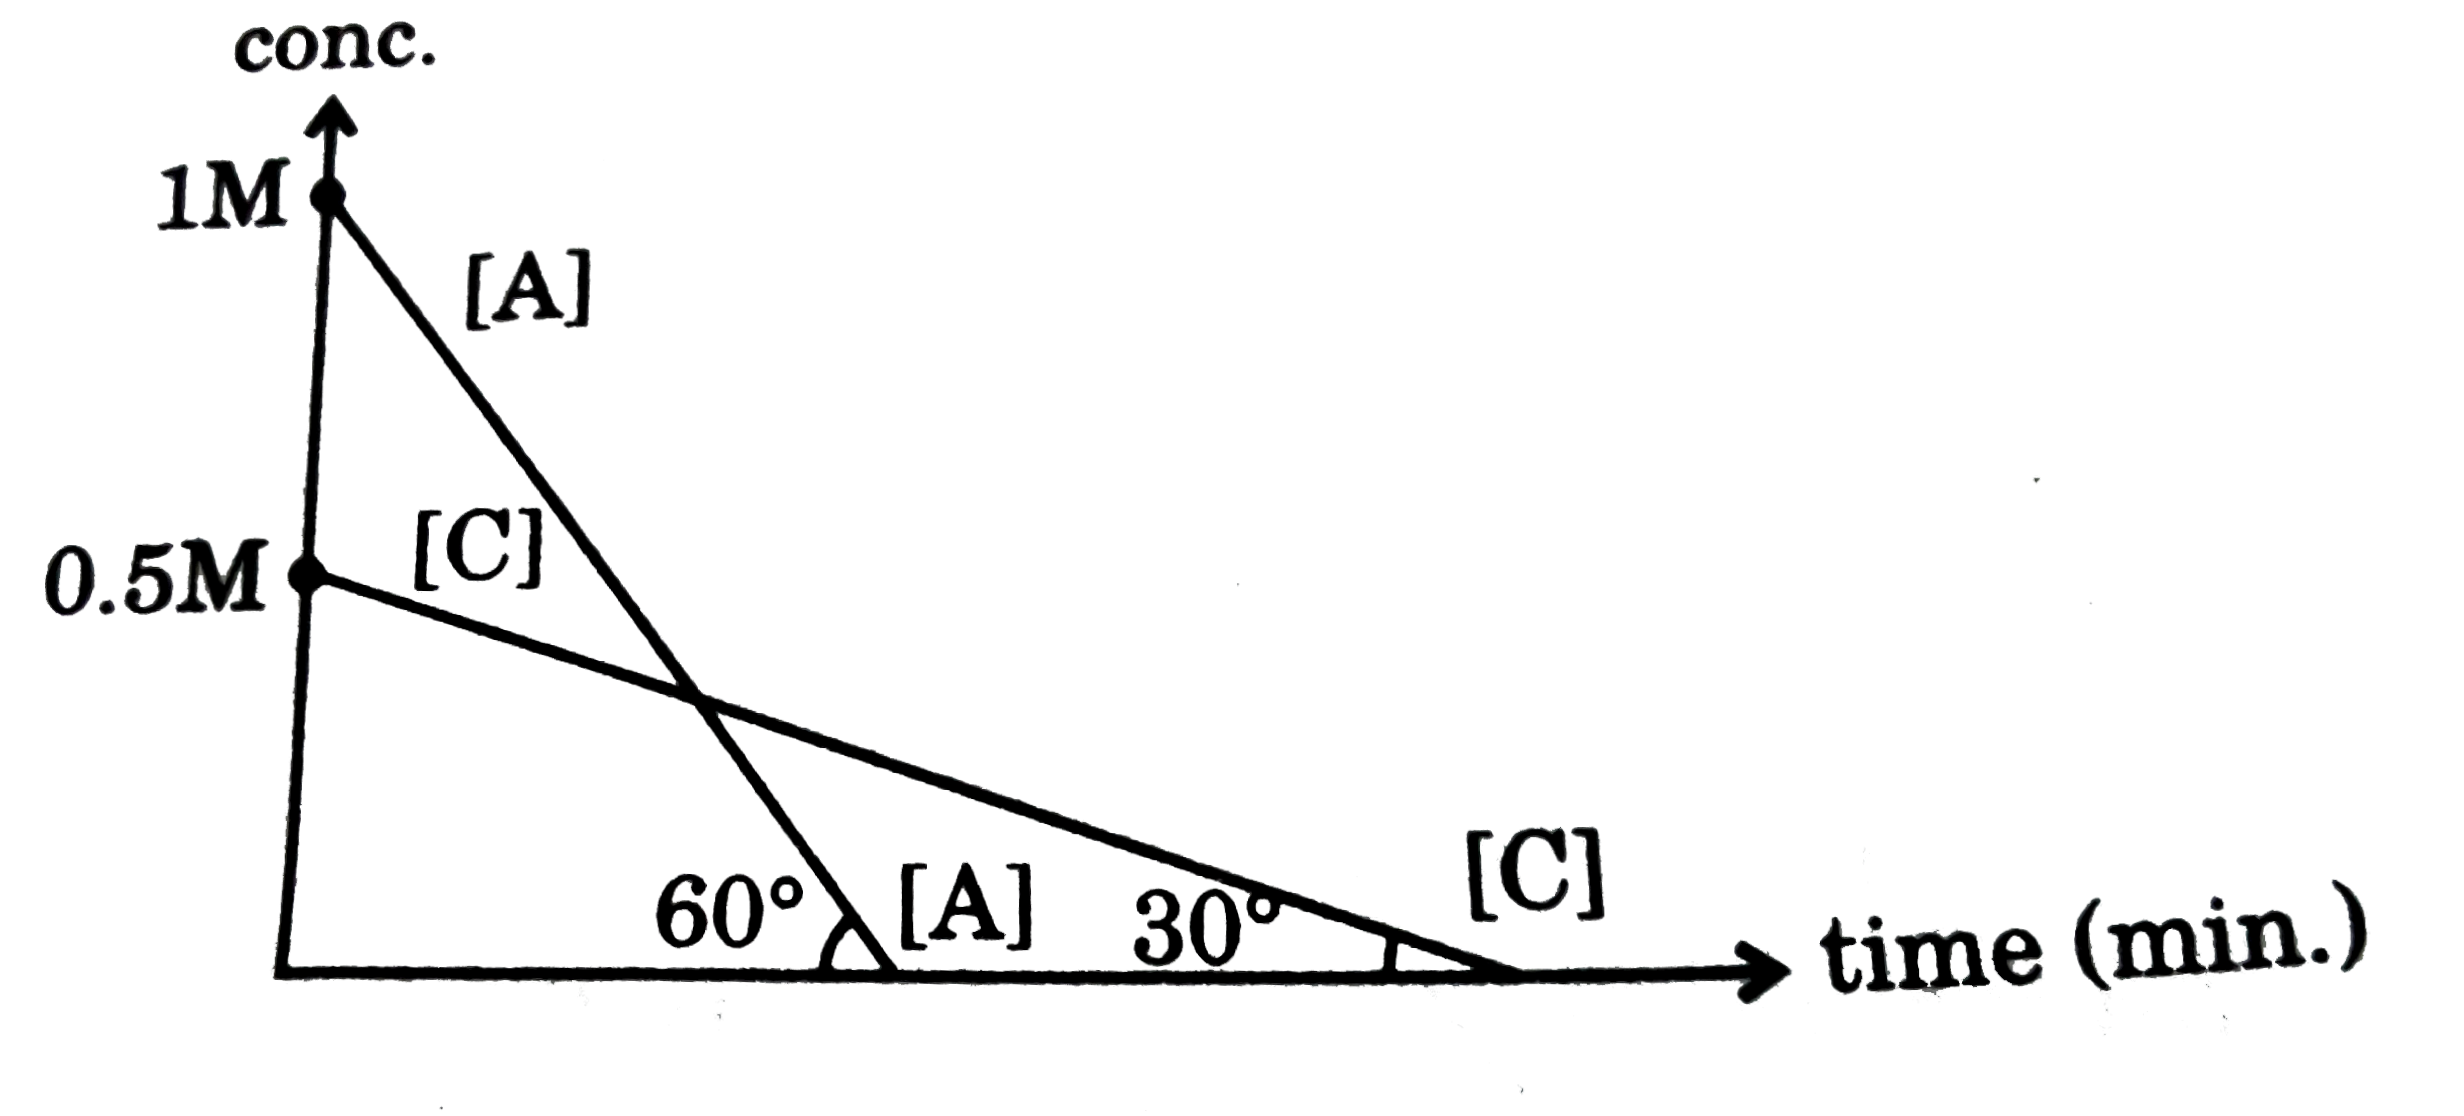 Which of the following is incorrect options ?
View SolutionWhich of the following graph is correct for disporportionation of
Where [species] represents concentration of the species,
View SolutionFor a first order reaction:
View SolutionWhich of the following graph is correct w.r.t half life for a zero order reaction at various stages of reaction ?
View SolutionFor a reaction
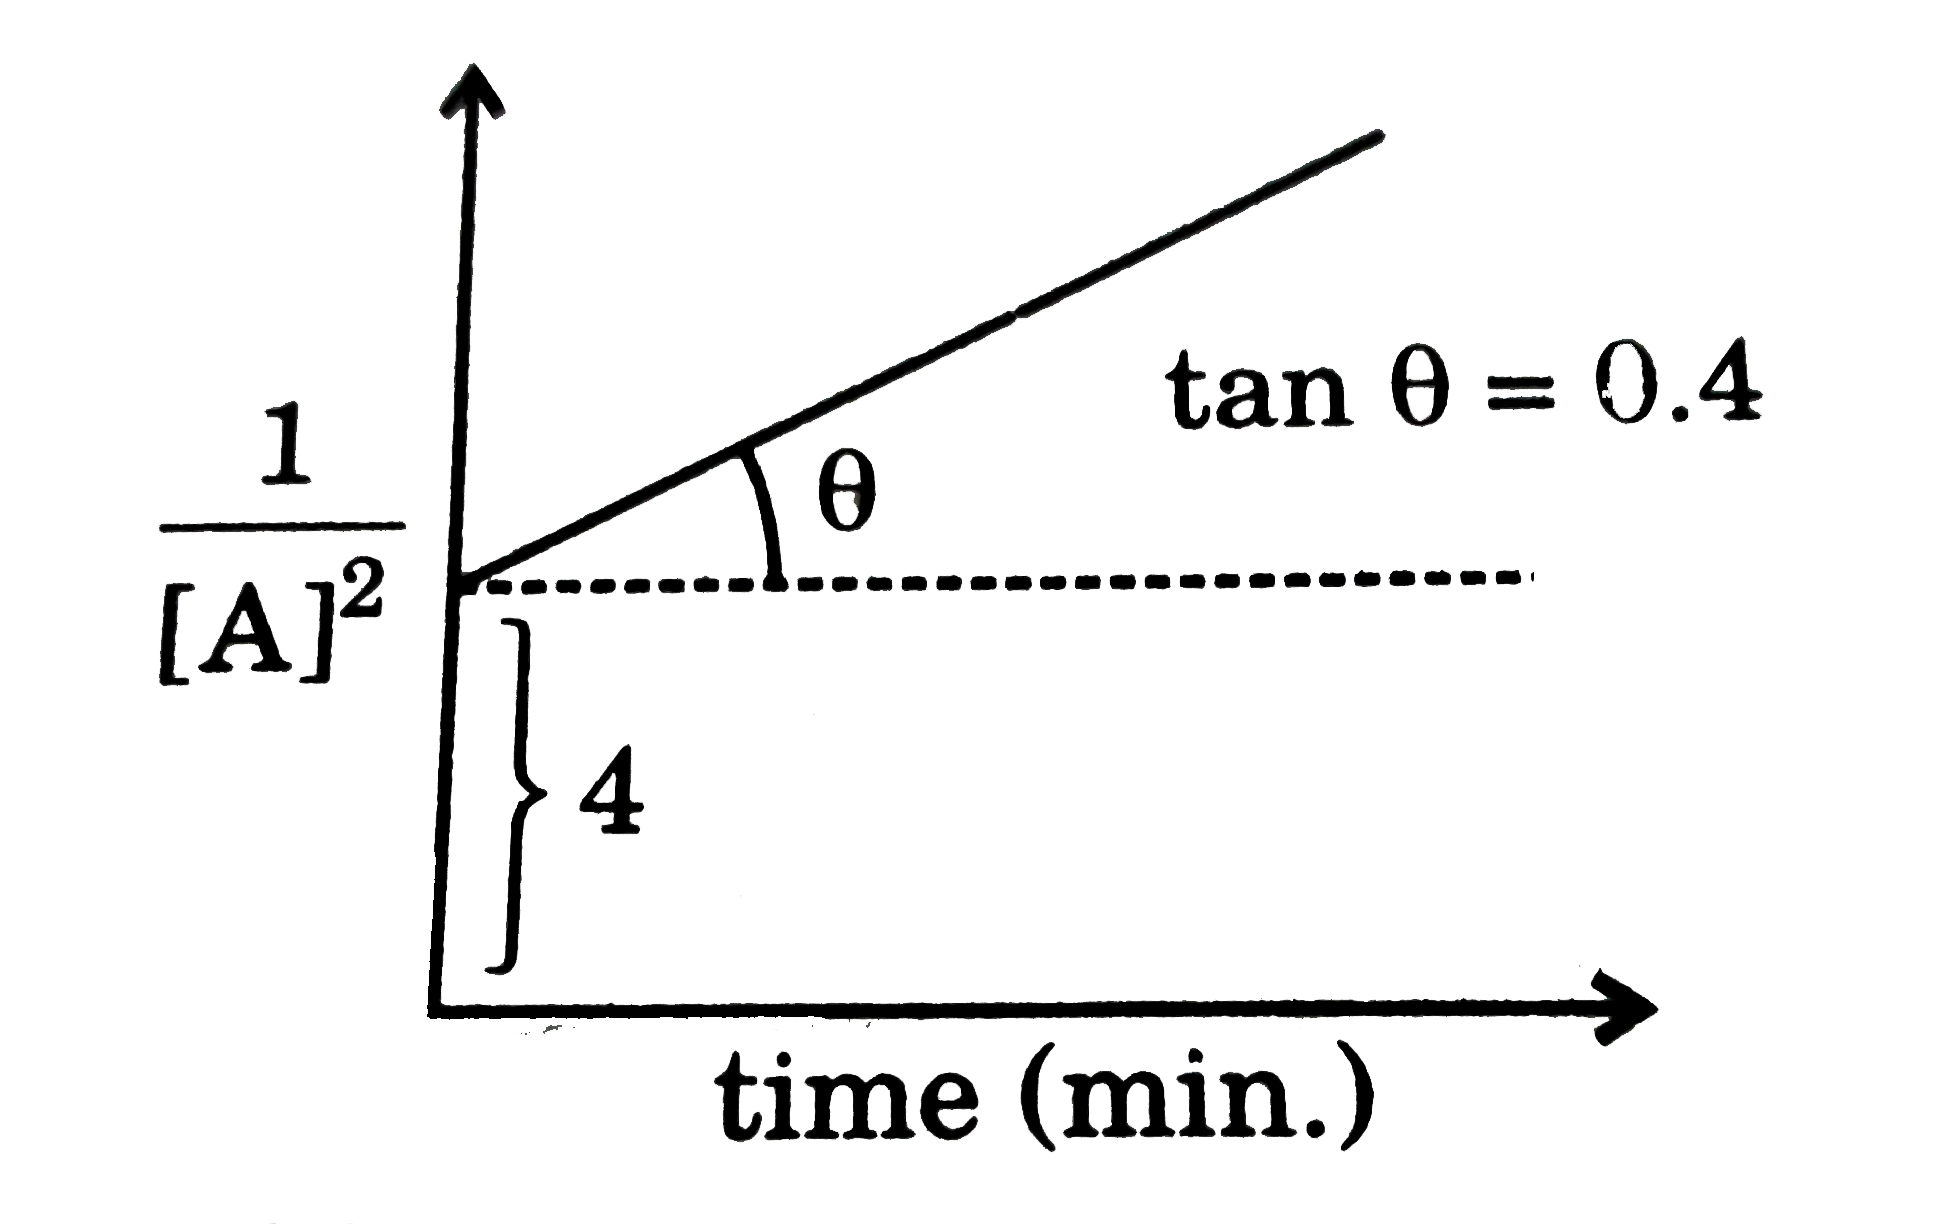
[A] is in terms of molarity
View SolutionFor a reversible factors in forward and backward direction are assumed to be equl. Select the incorrect option (s) on the basis of above graph. [take
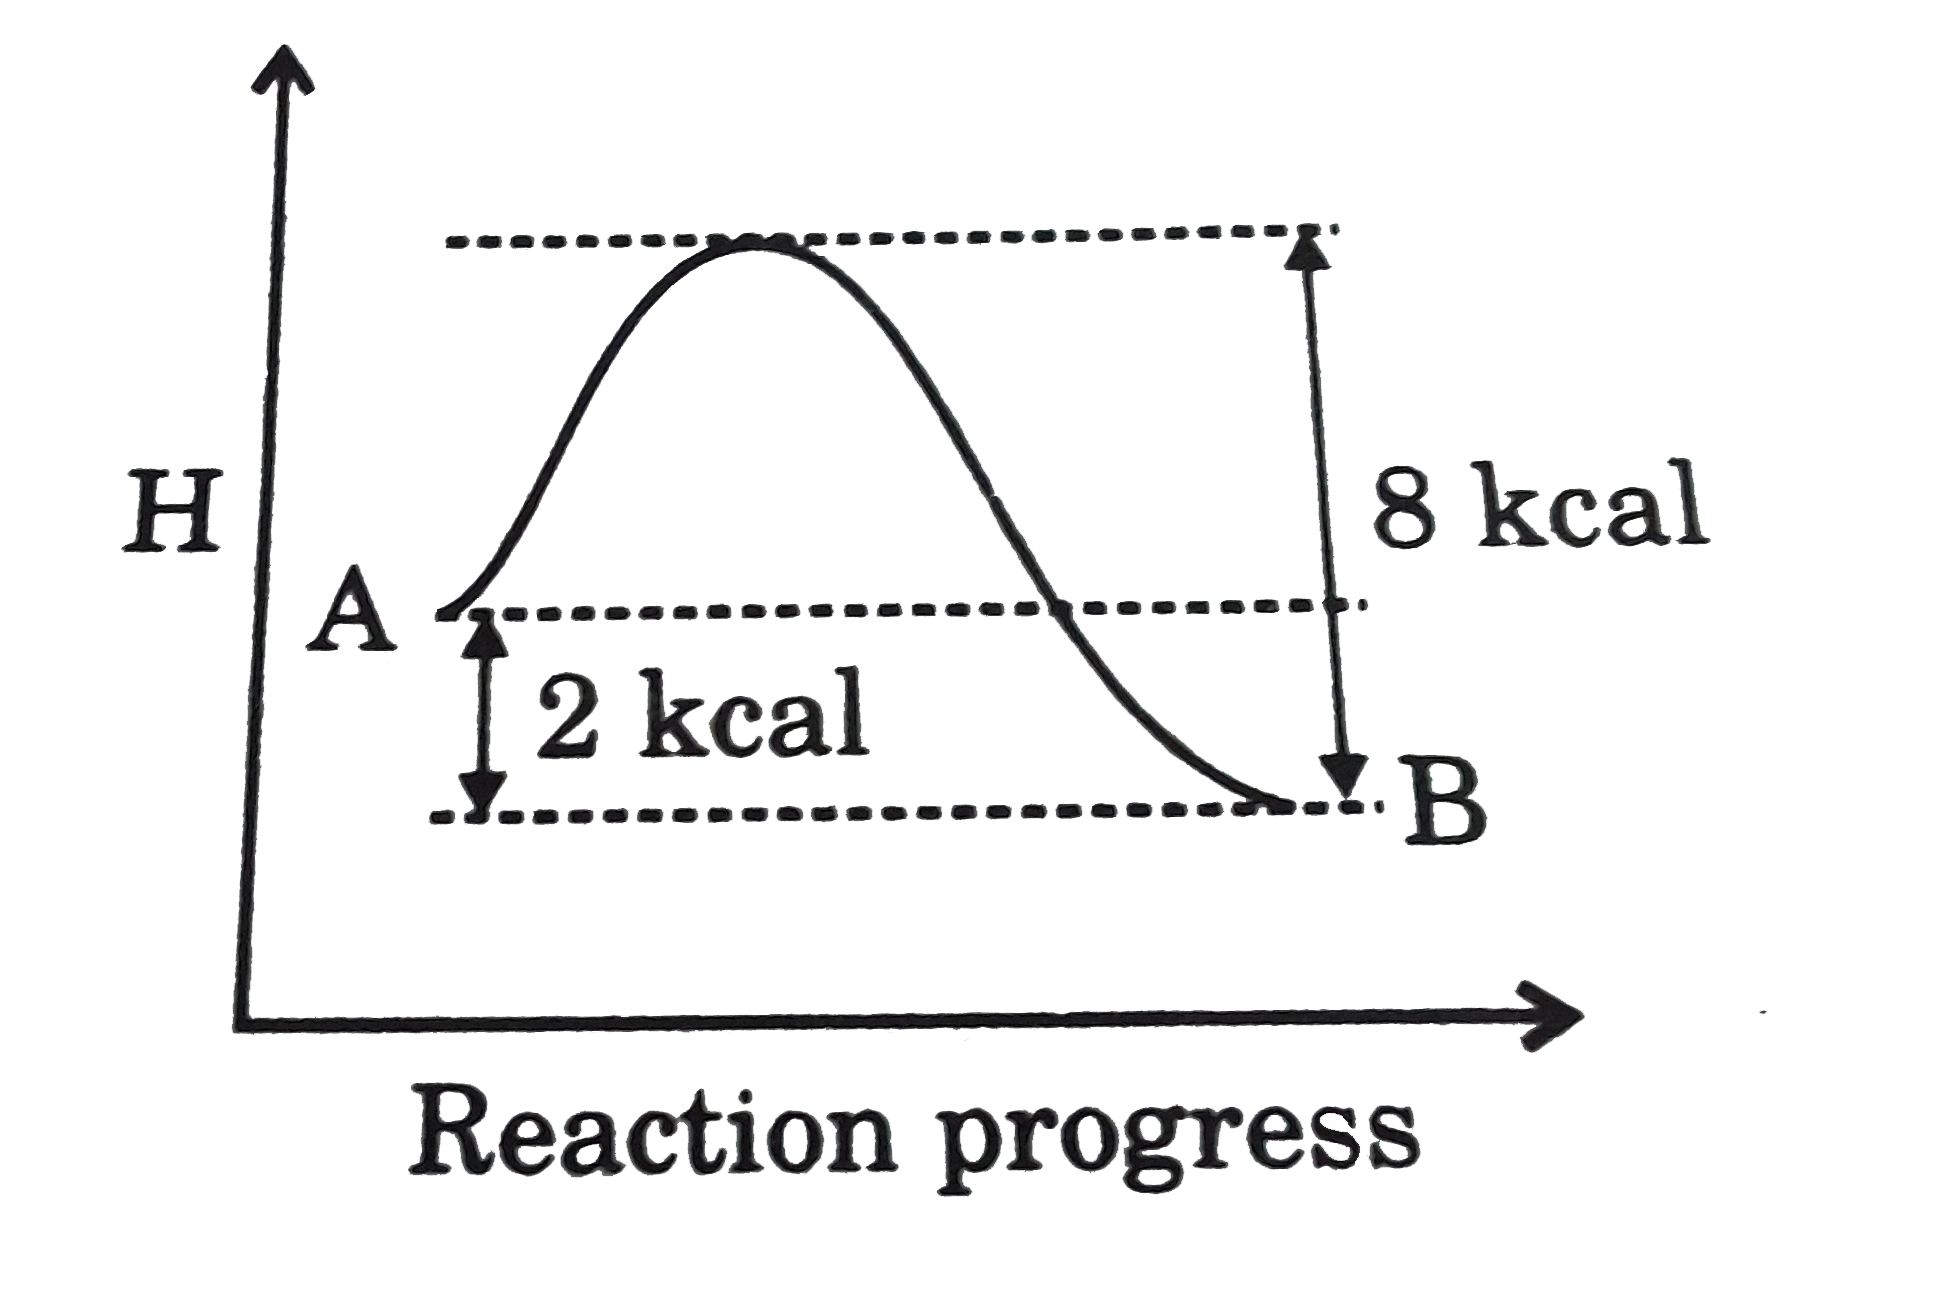
View SolutionConsider the reaction :
View SolutionThe following mechanism has been proposed for the exothermic catalyzed cmplex reaction:
If
View SolutionFor an elementary reaction:
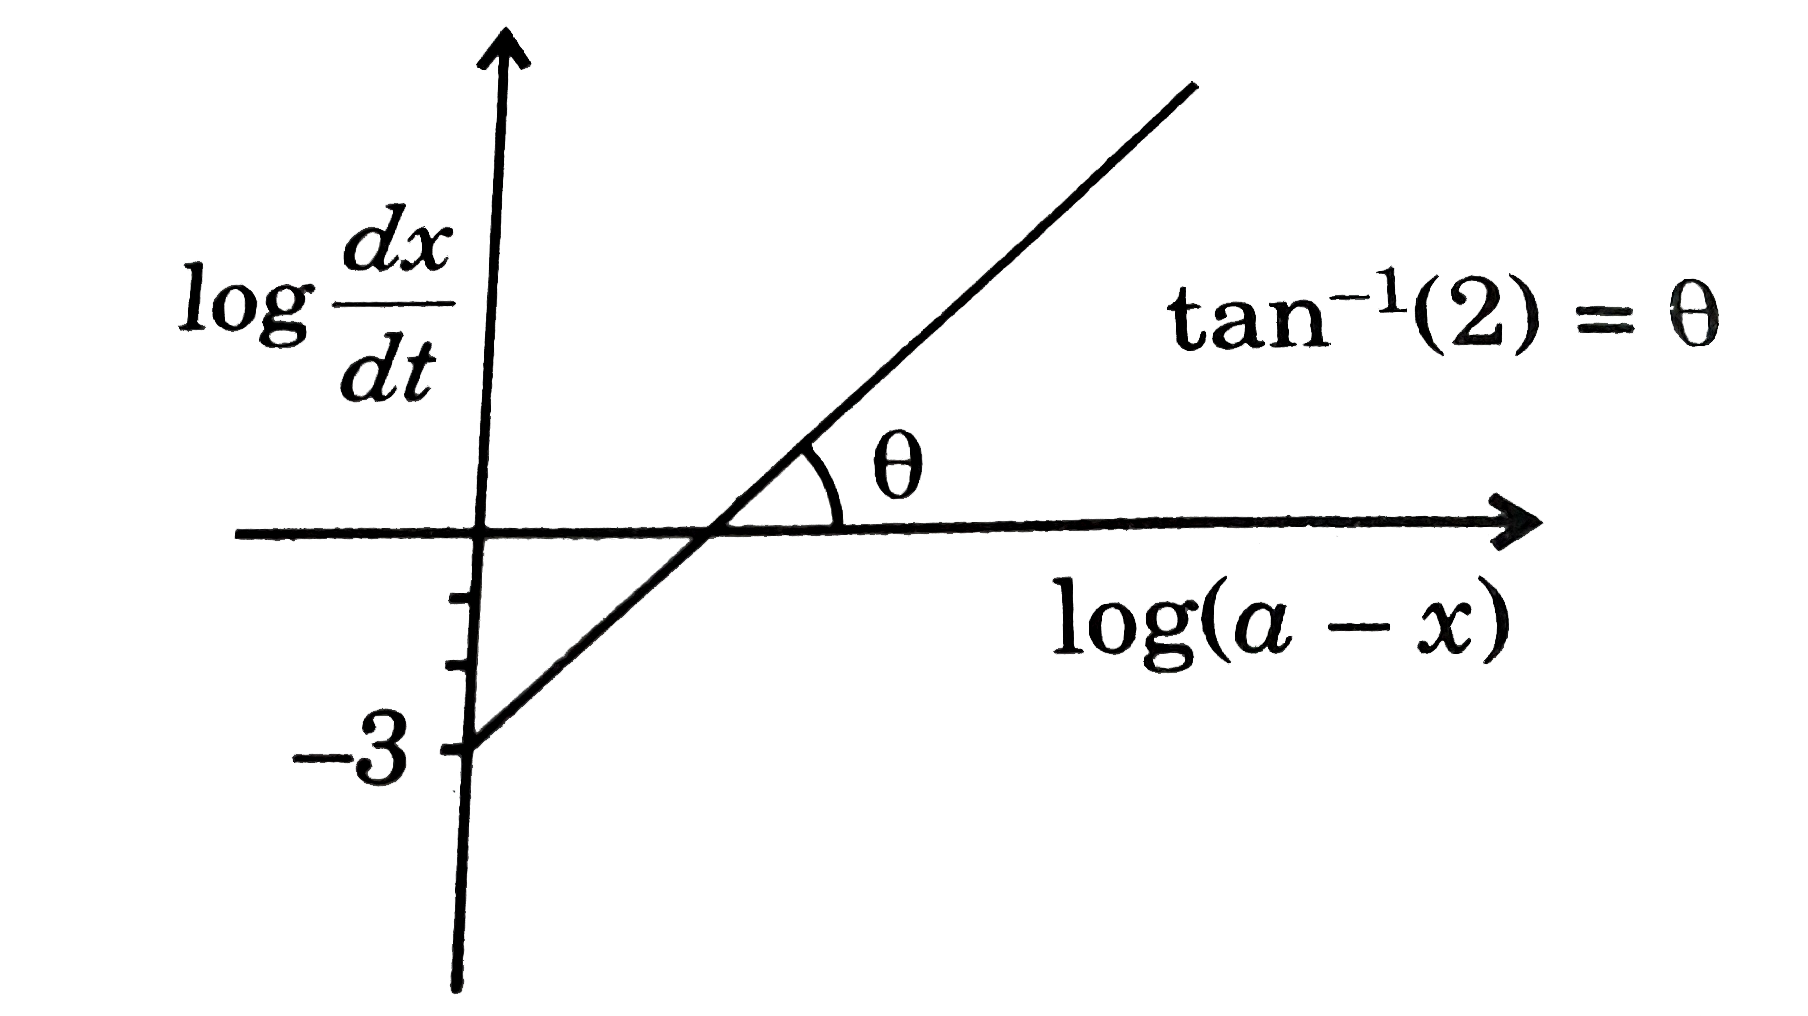
View SolutionWhich of the following graph is incorrect for variation of rate constant (K) with temperature for a reaction obeying Arrhenius equation ?
View SolutionFor a reaction
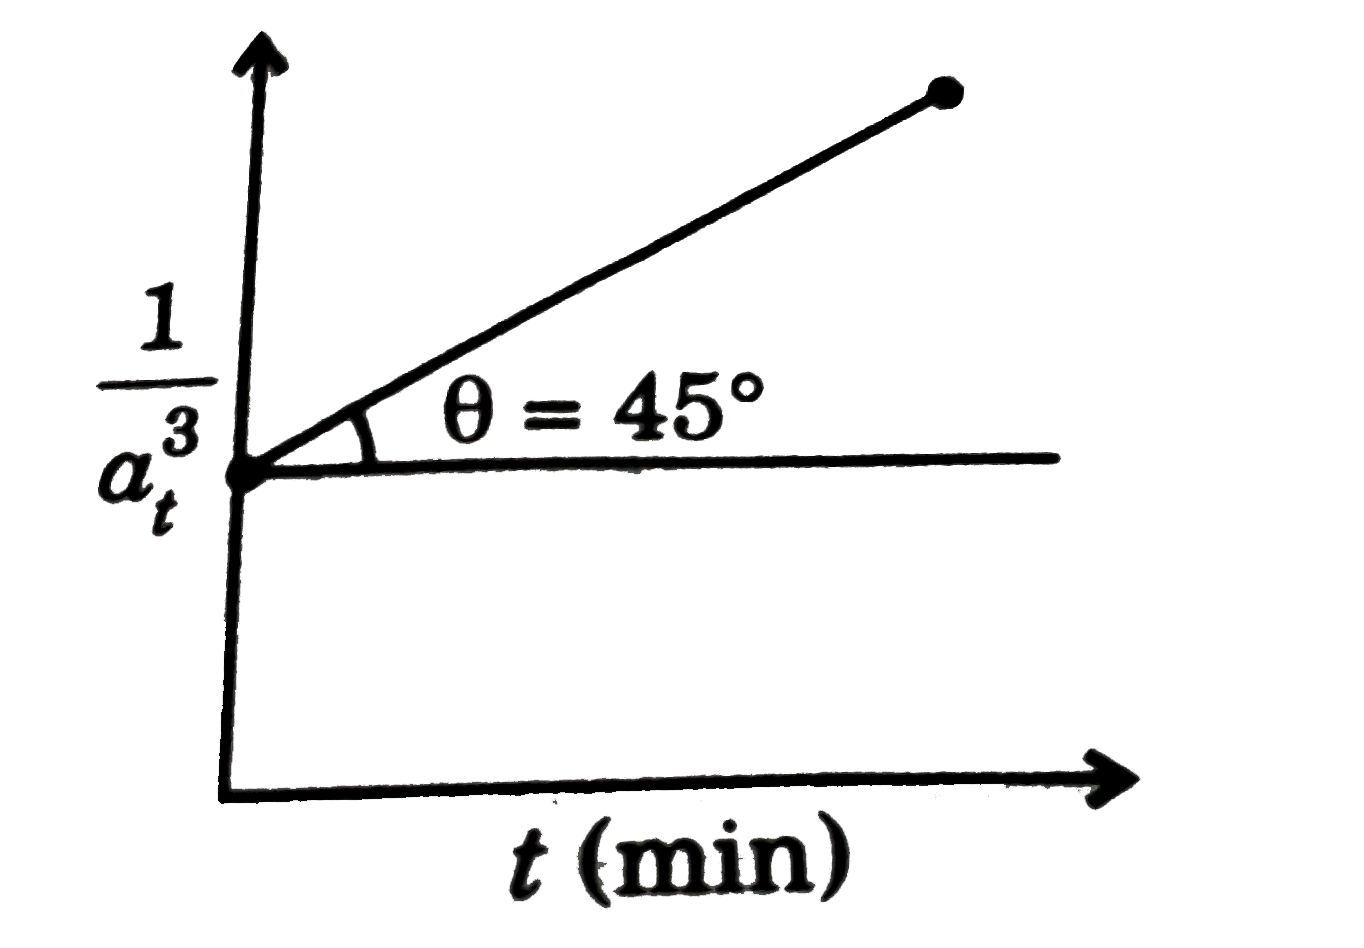
View SolutionConsider the first order reaction:
View SolutionWhich of the folloing characteristics are correct for a reaction in which the following graph is obtained ?
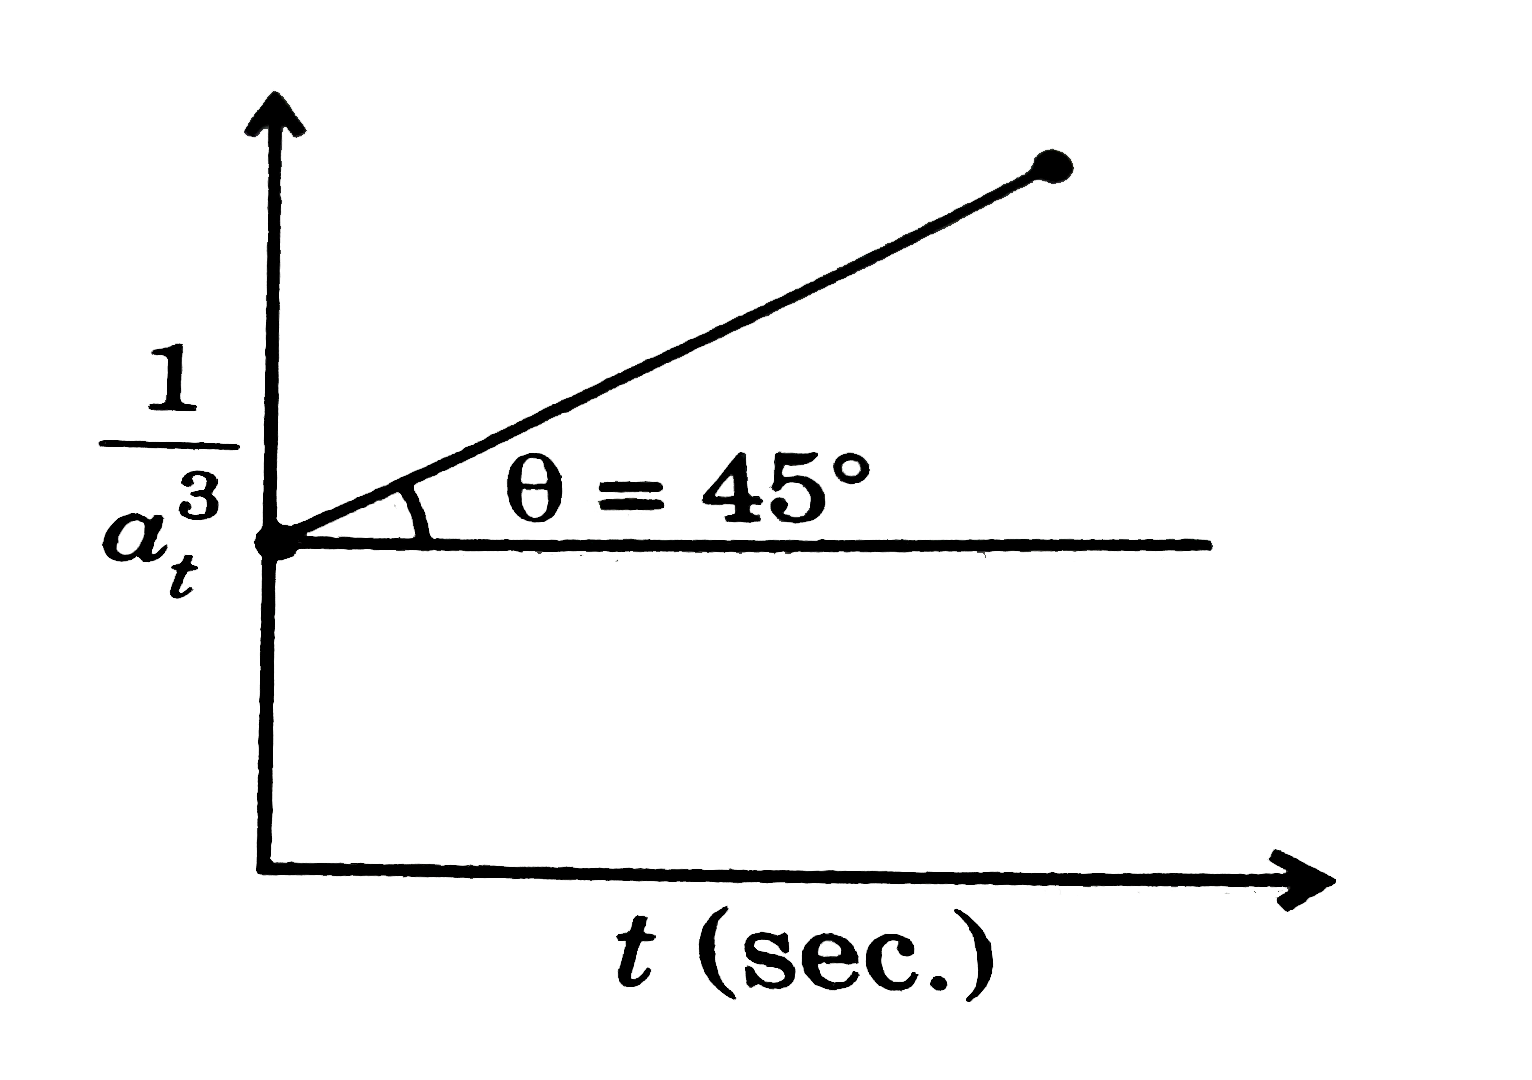
View SolutionFor a reaction
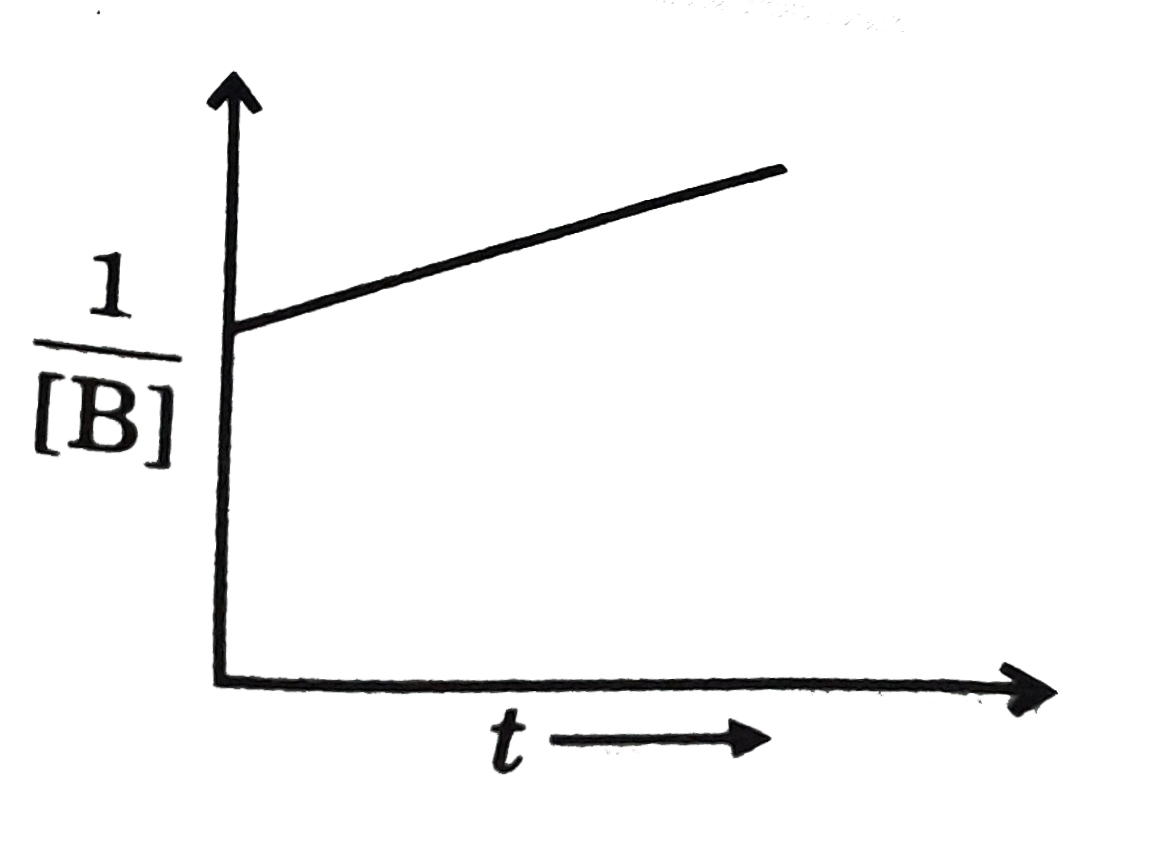
View SolutionRate constant vs temperature graph looks like: If the activation energy for the reaction is 100 kJ/mol, then what is the maximum temperature for this graph trend to be valid ?
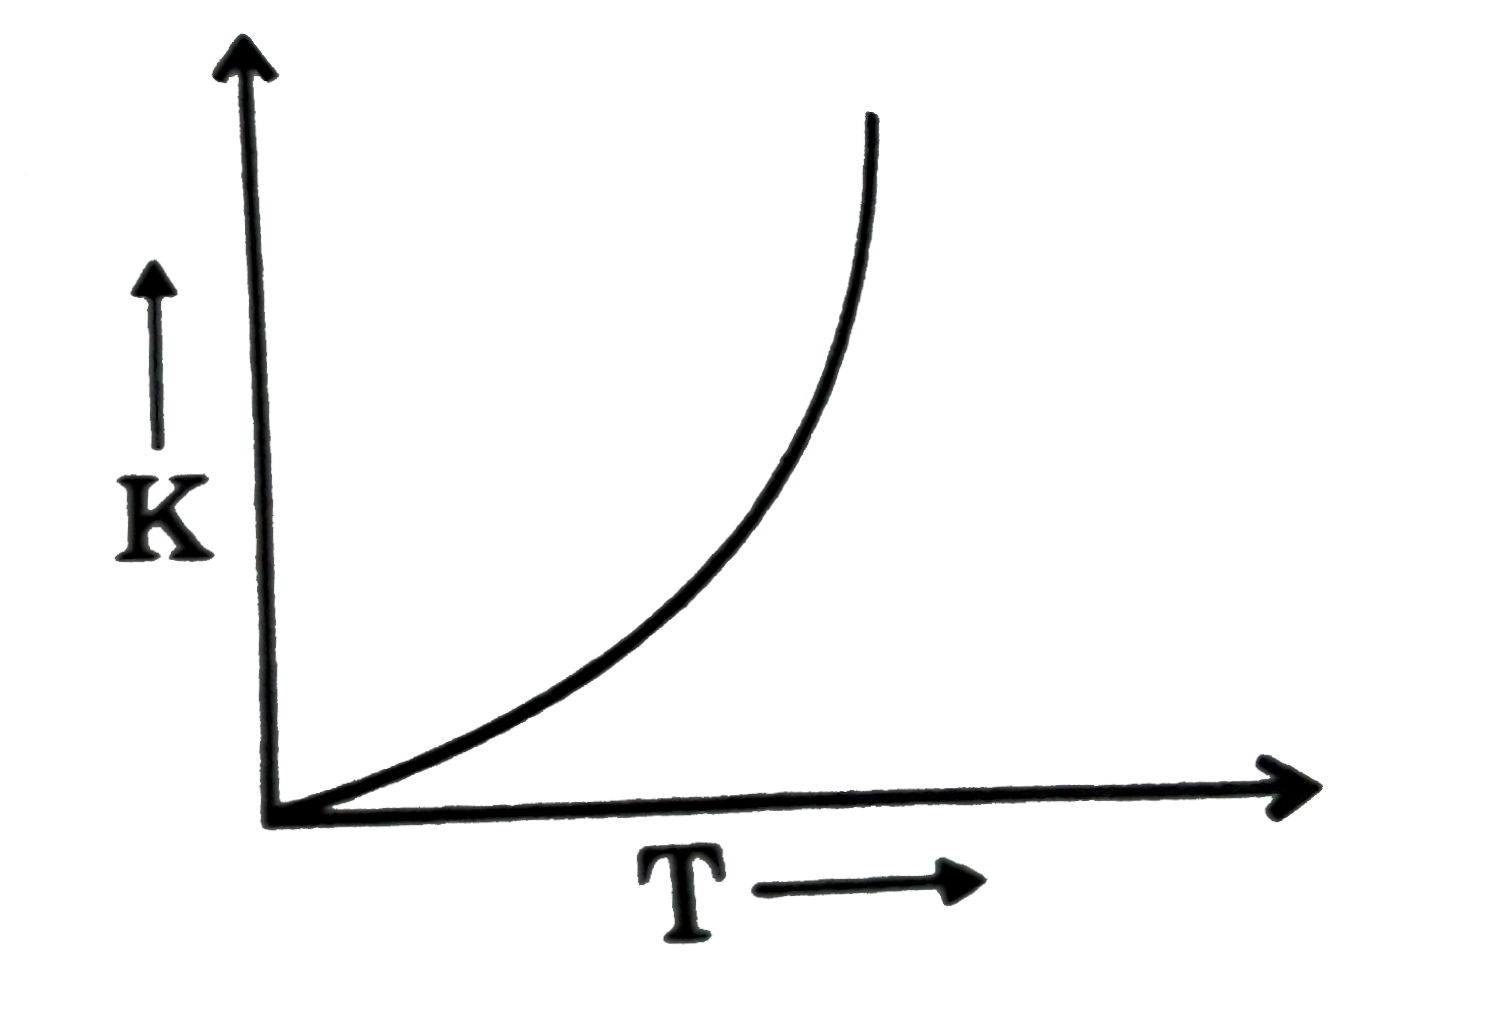
View SolutionWhich of the following graph is incorrect for variation of rate constant (K) with temperature for a reaction obeying Arrhenius equation ?
View SolutionA reaction follows the given concentration
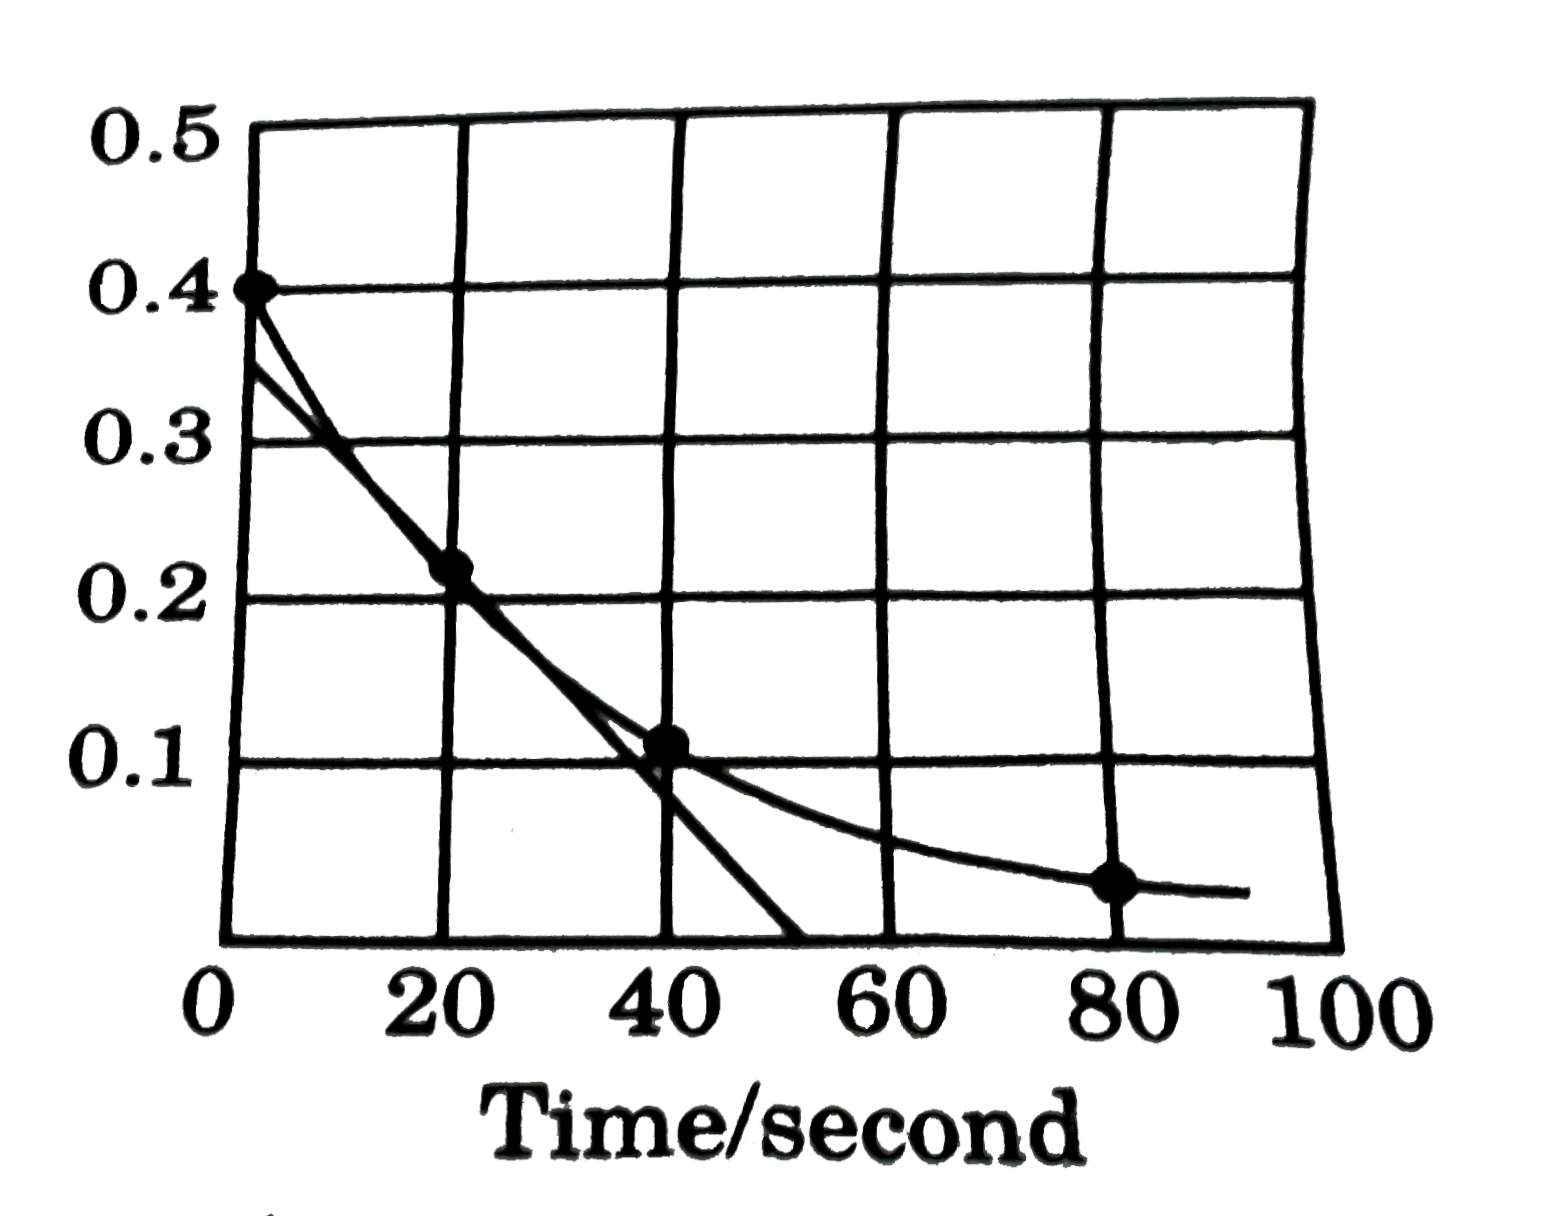
View SolutionFor a first order reaction, the reaction, the plot of
View SolutionThe graph between concentration
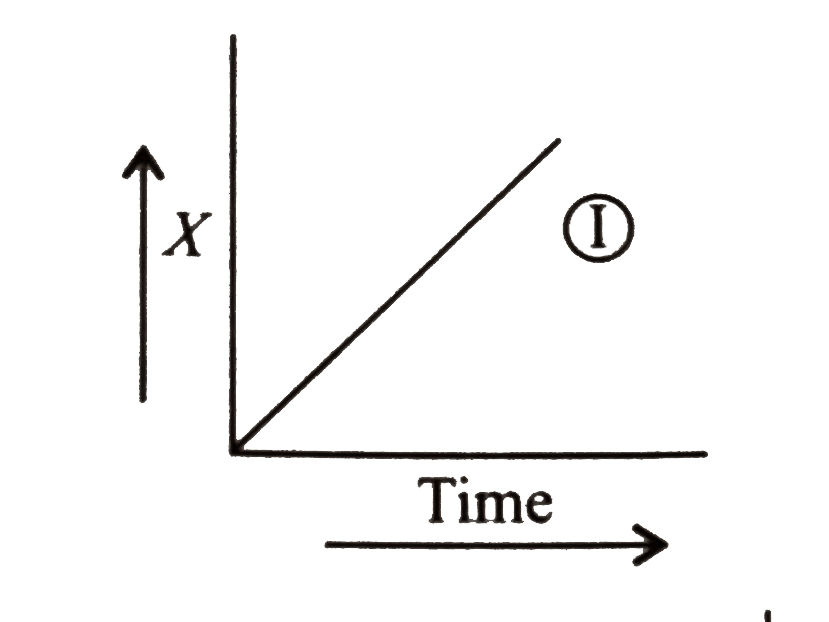
View SolutionA graph plotted between log
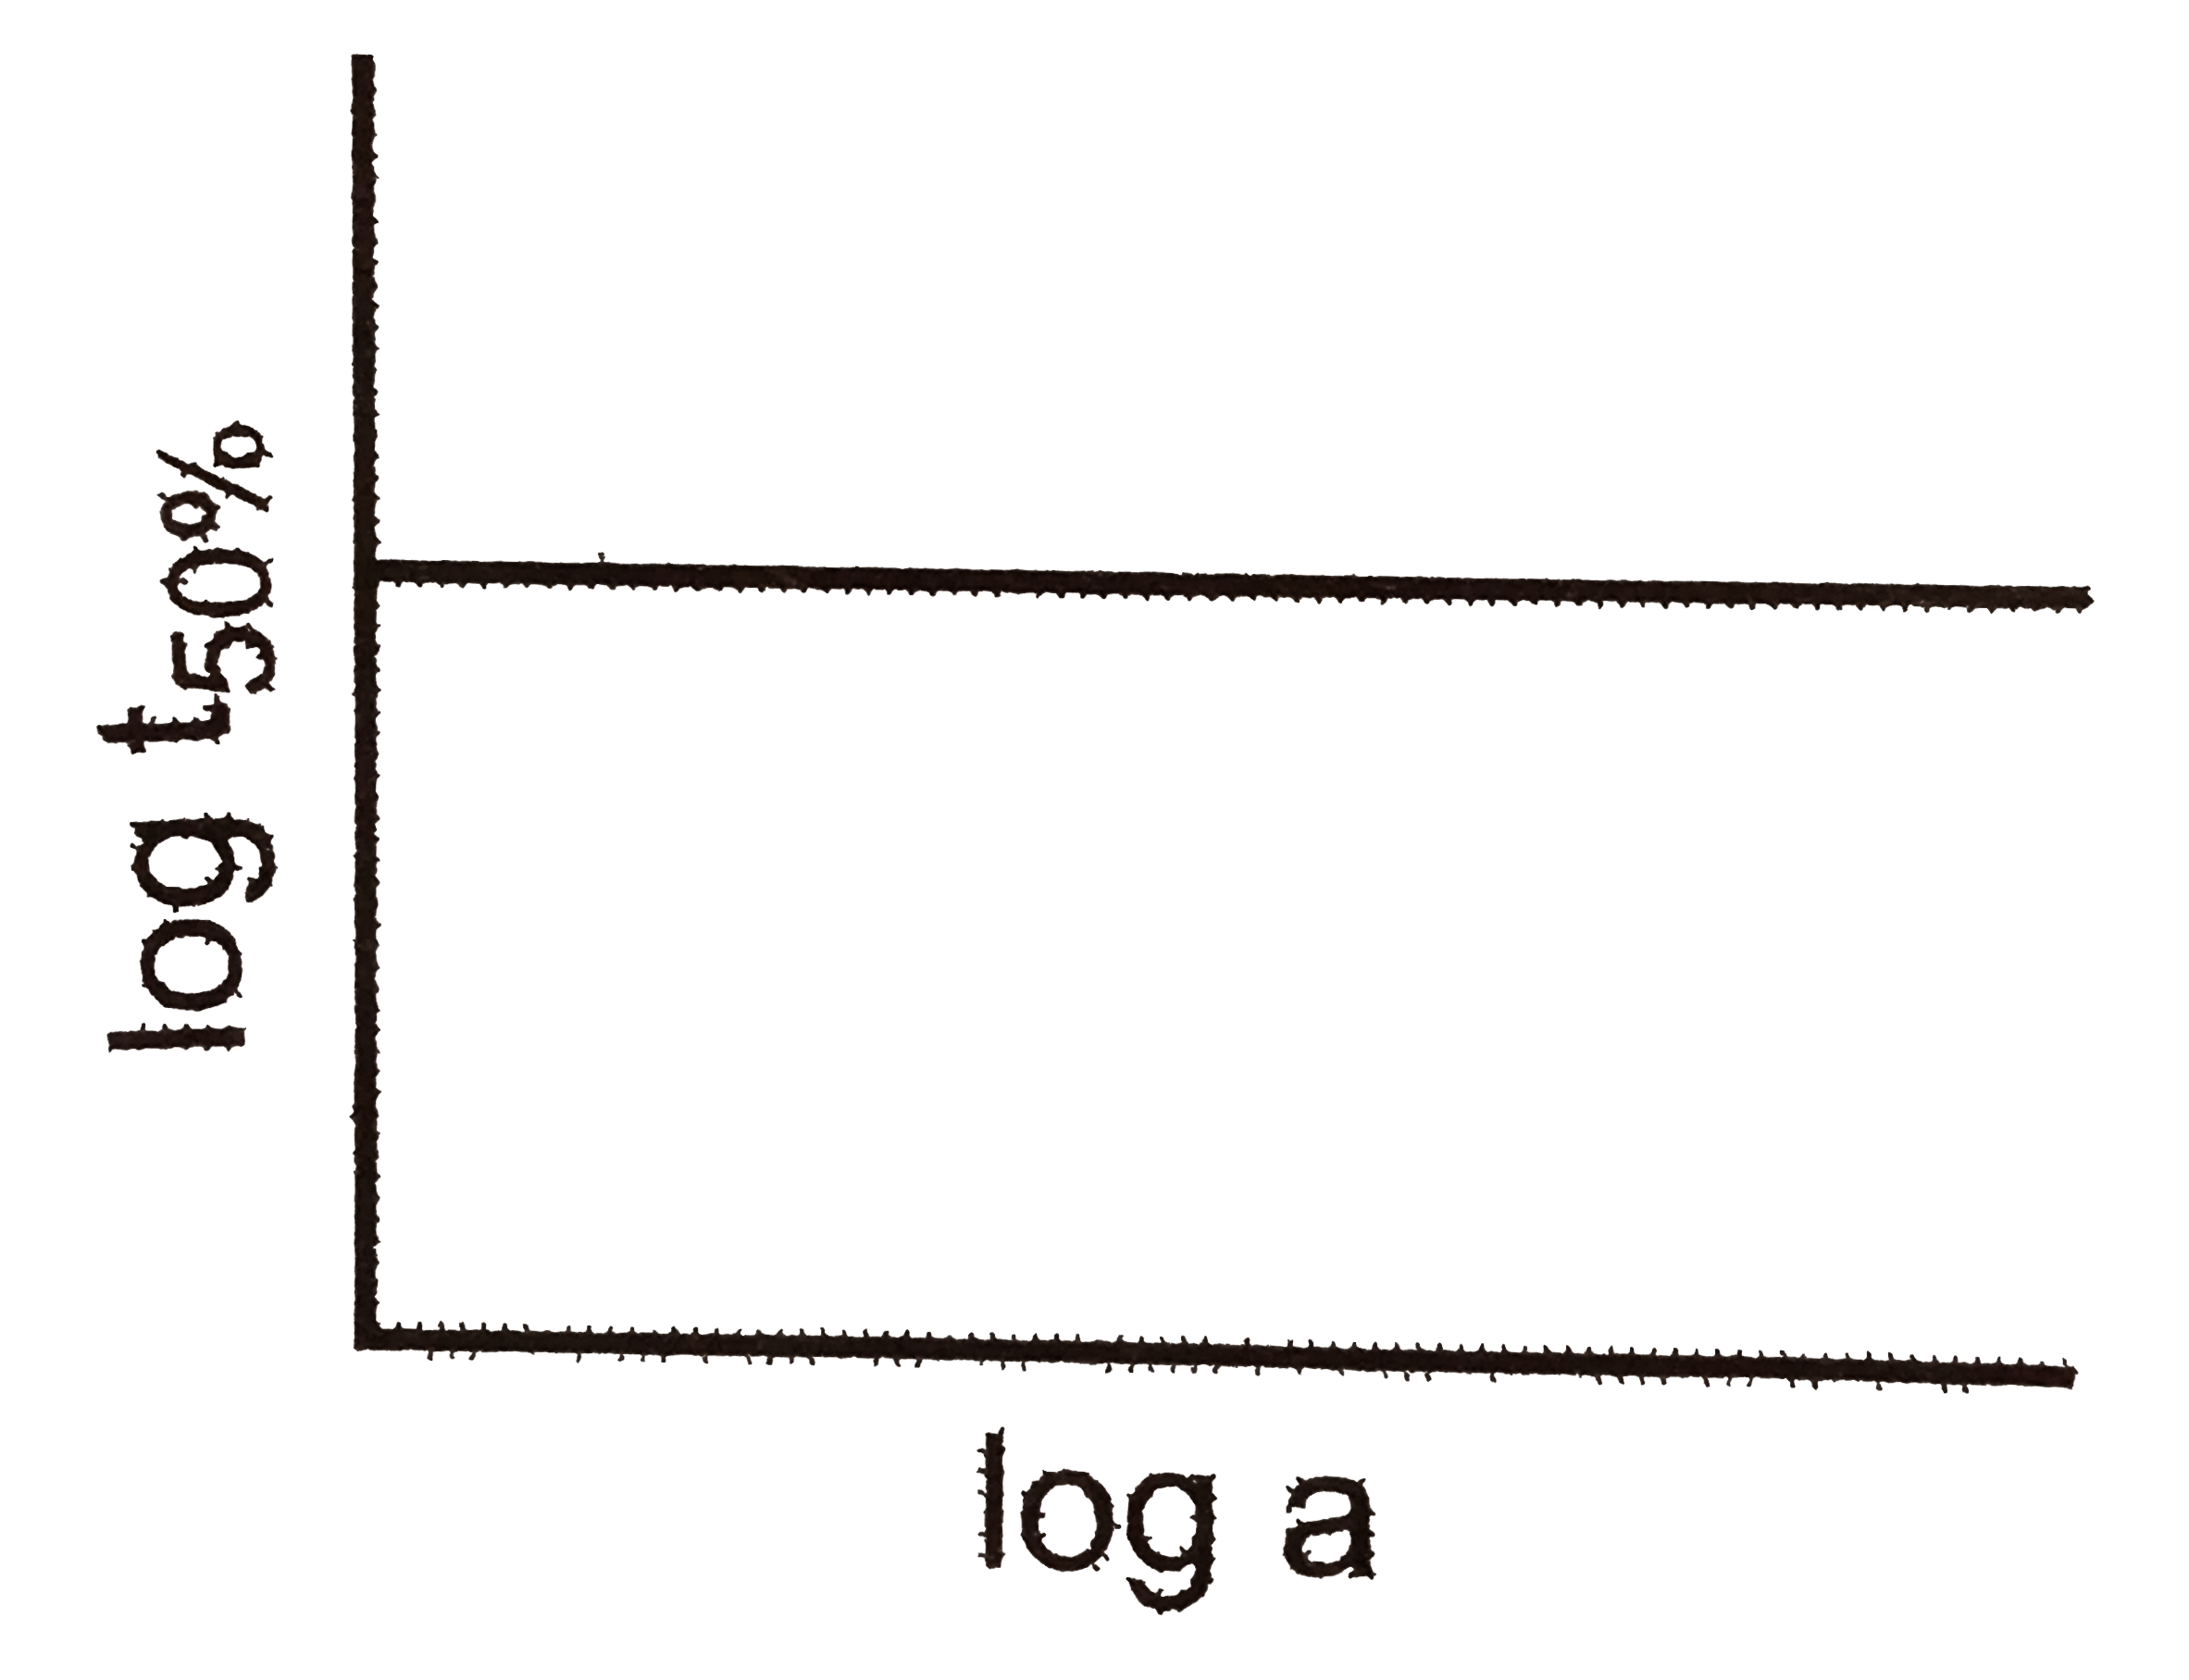
View SolutionWhat will be the order of reaction and rate constant for a chemical change having
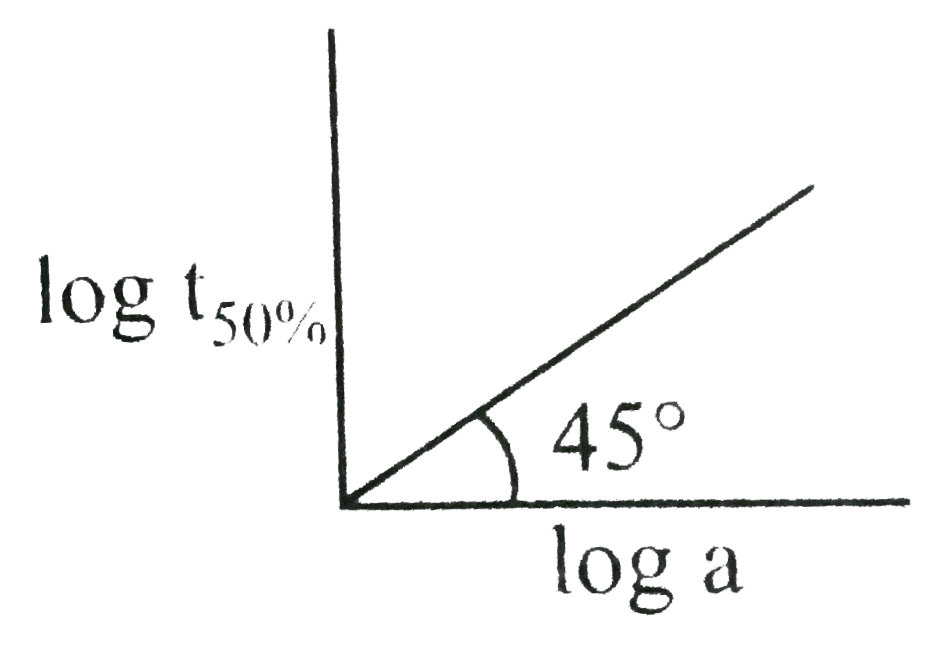
View Solution
View SolutionIn the different reactions, involving a angle reactant in each case, a plot of rate of the reaction on the y-axis, versus concentratio of the reaction on the x-axis, yields three different curves shown below:
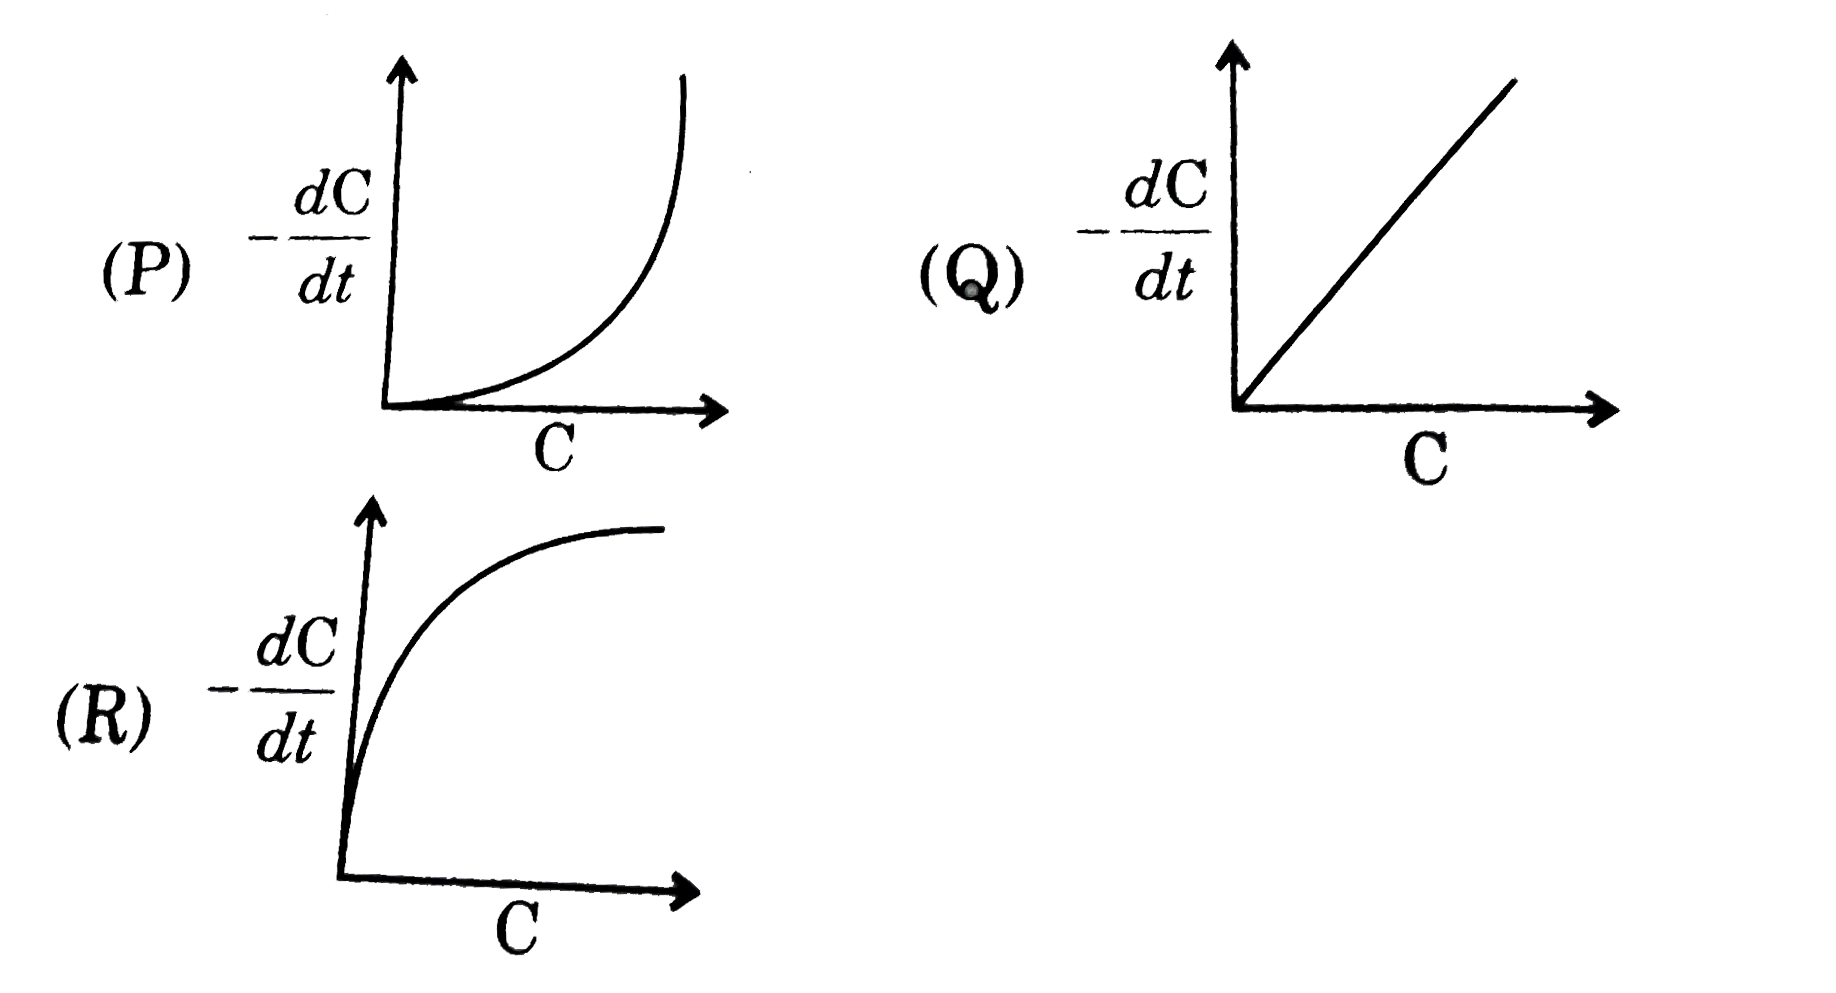
What are the possible orders of the reactions (P), (Q),(R)?
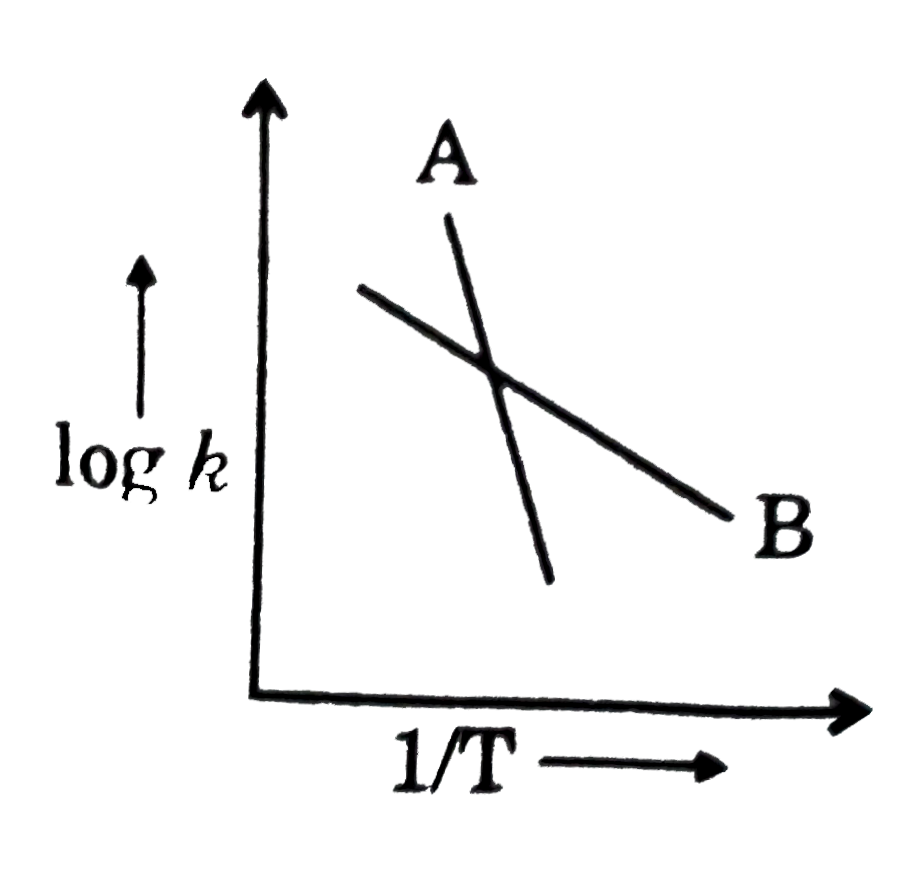
View SolutionThe Arrhenius relationship of two different reactions is shown below. Which reaction is faster at a lower temperature and which is more sensitive to changes of temperature ?
View SolutionIf for a reaction in which
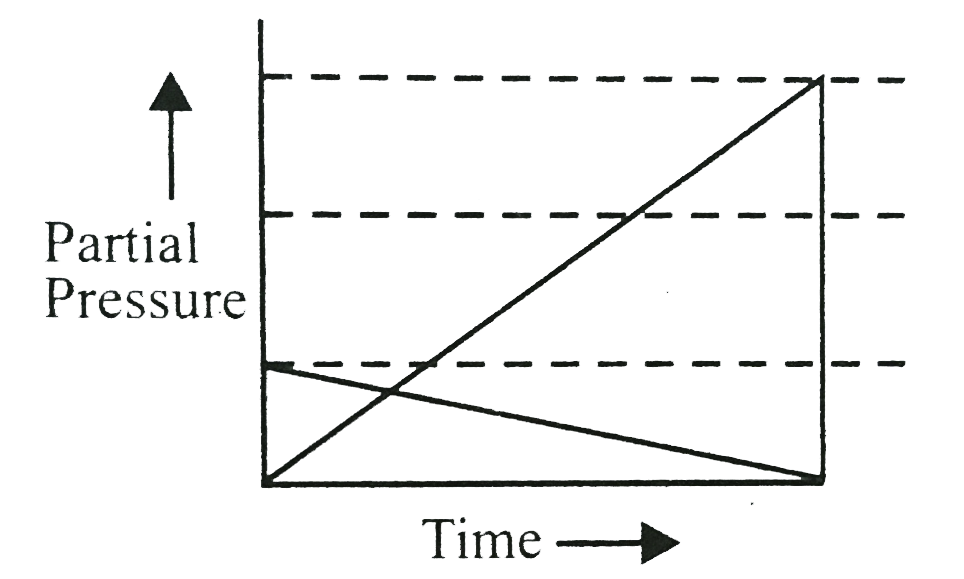
View SolutionRate of reaction
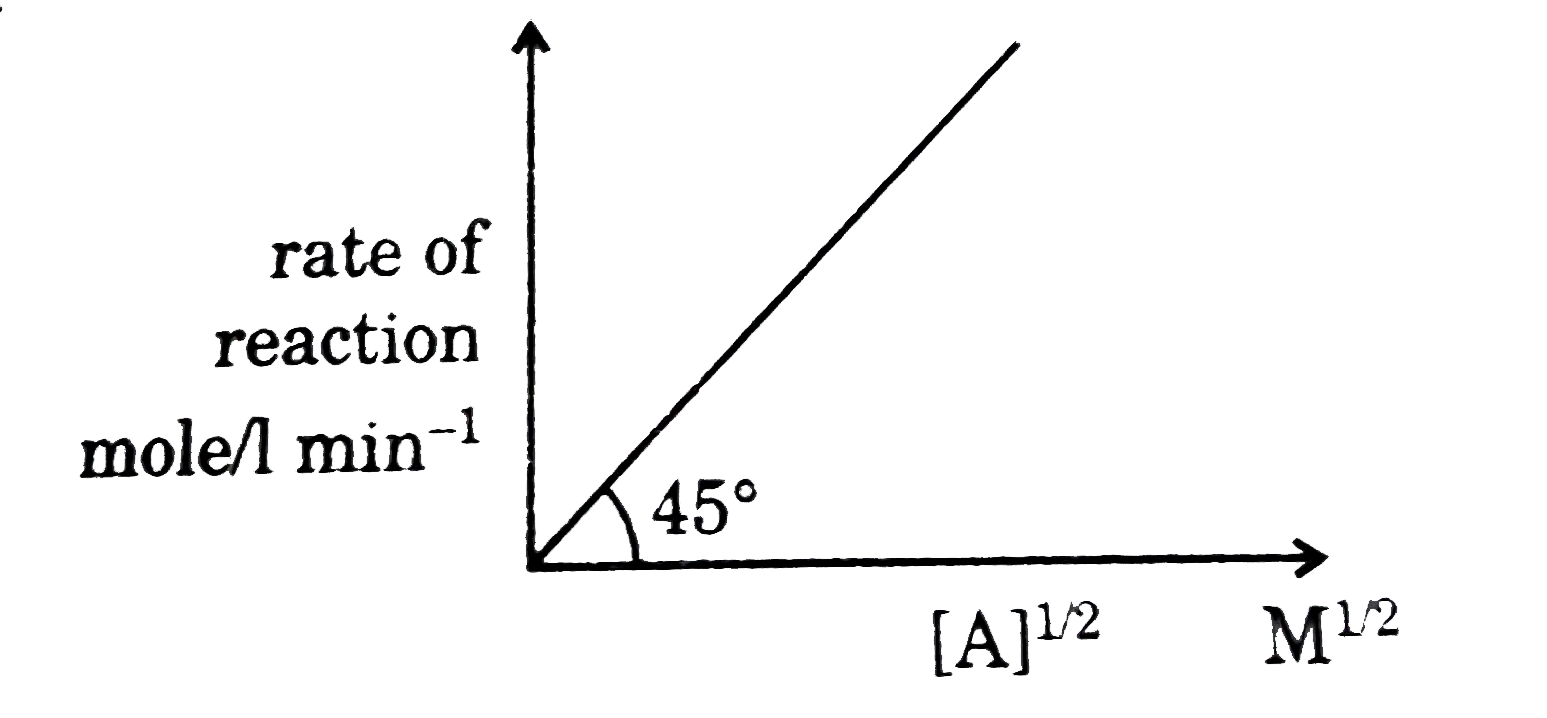
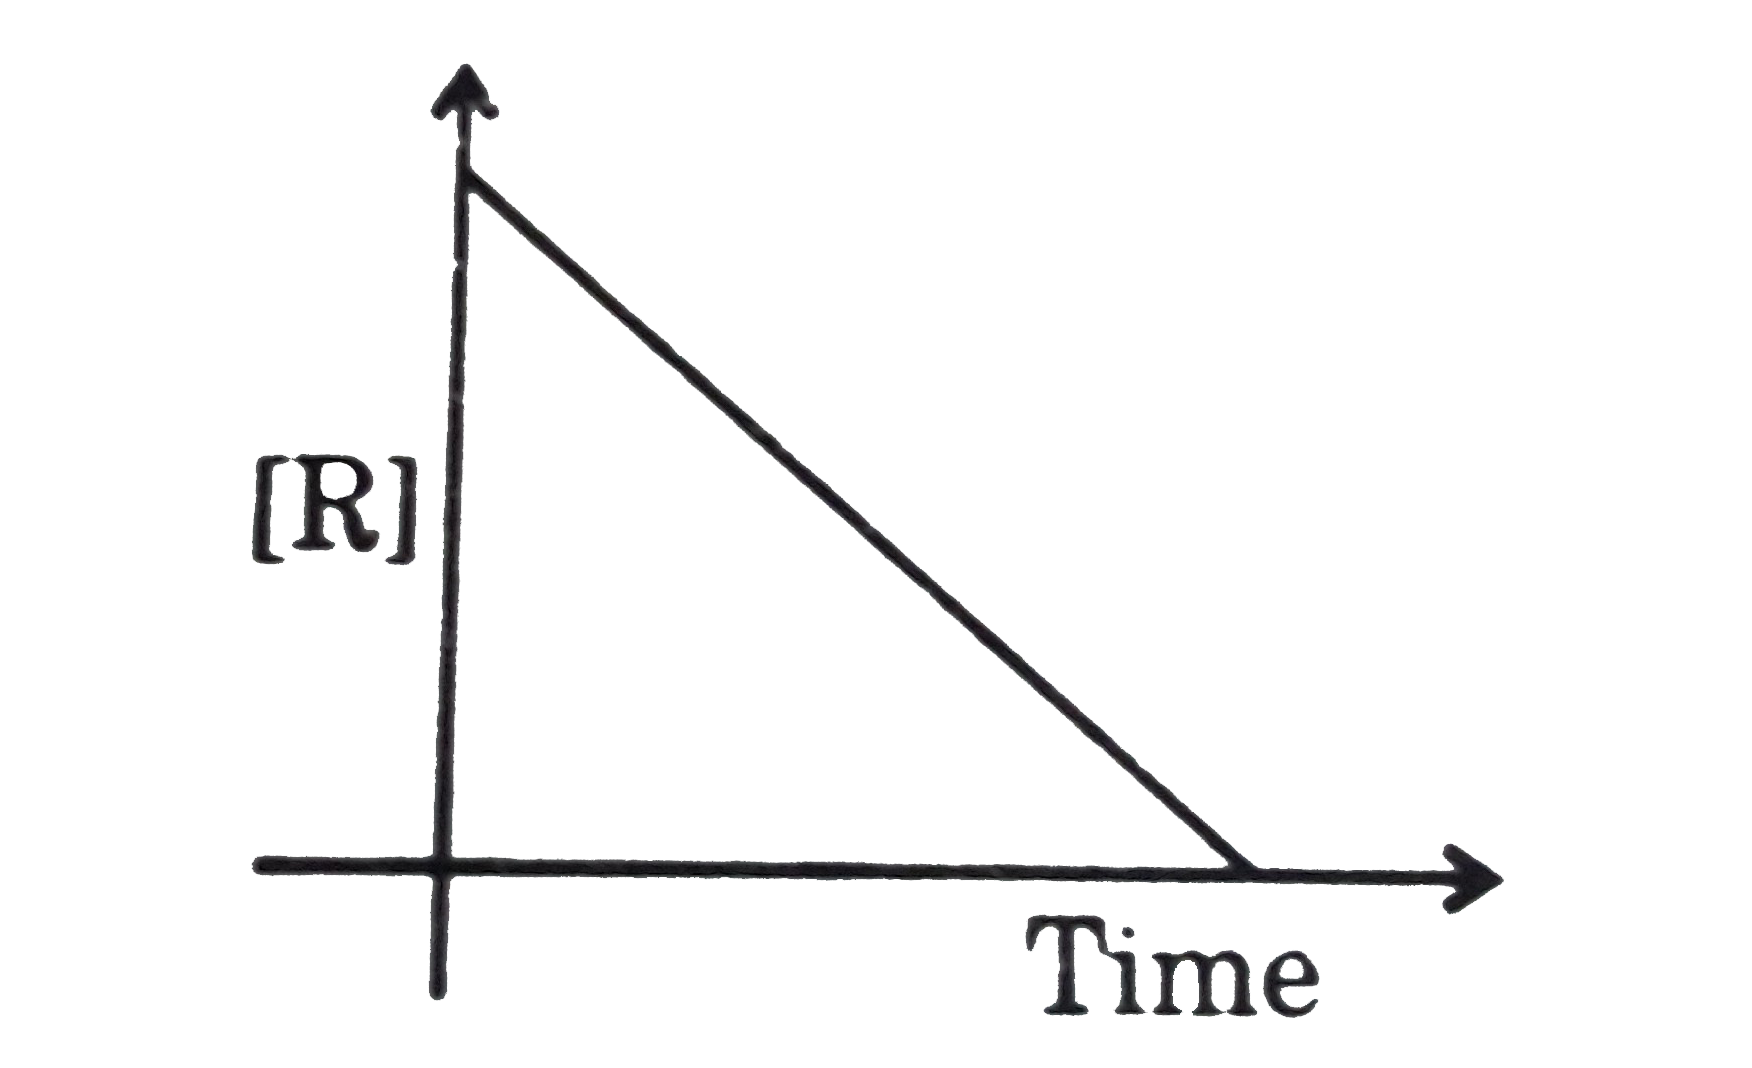
View SolutionAdjoining graph is for a reaction which have only single reactant (R) and order of reactions depends only on that single reactant then possible order of reactions depends only on that single reactant then possible order of reaction may be:
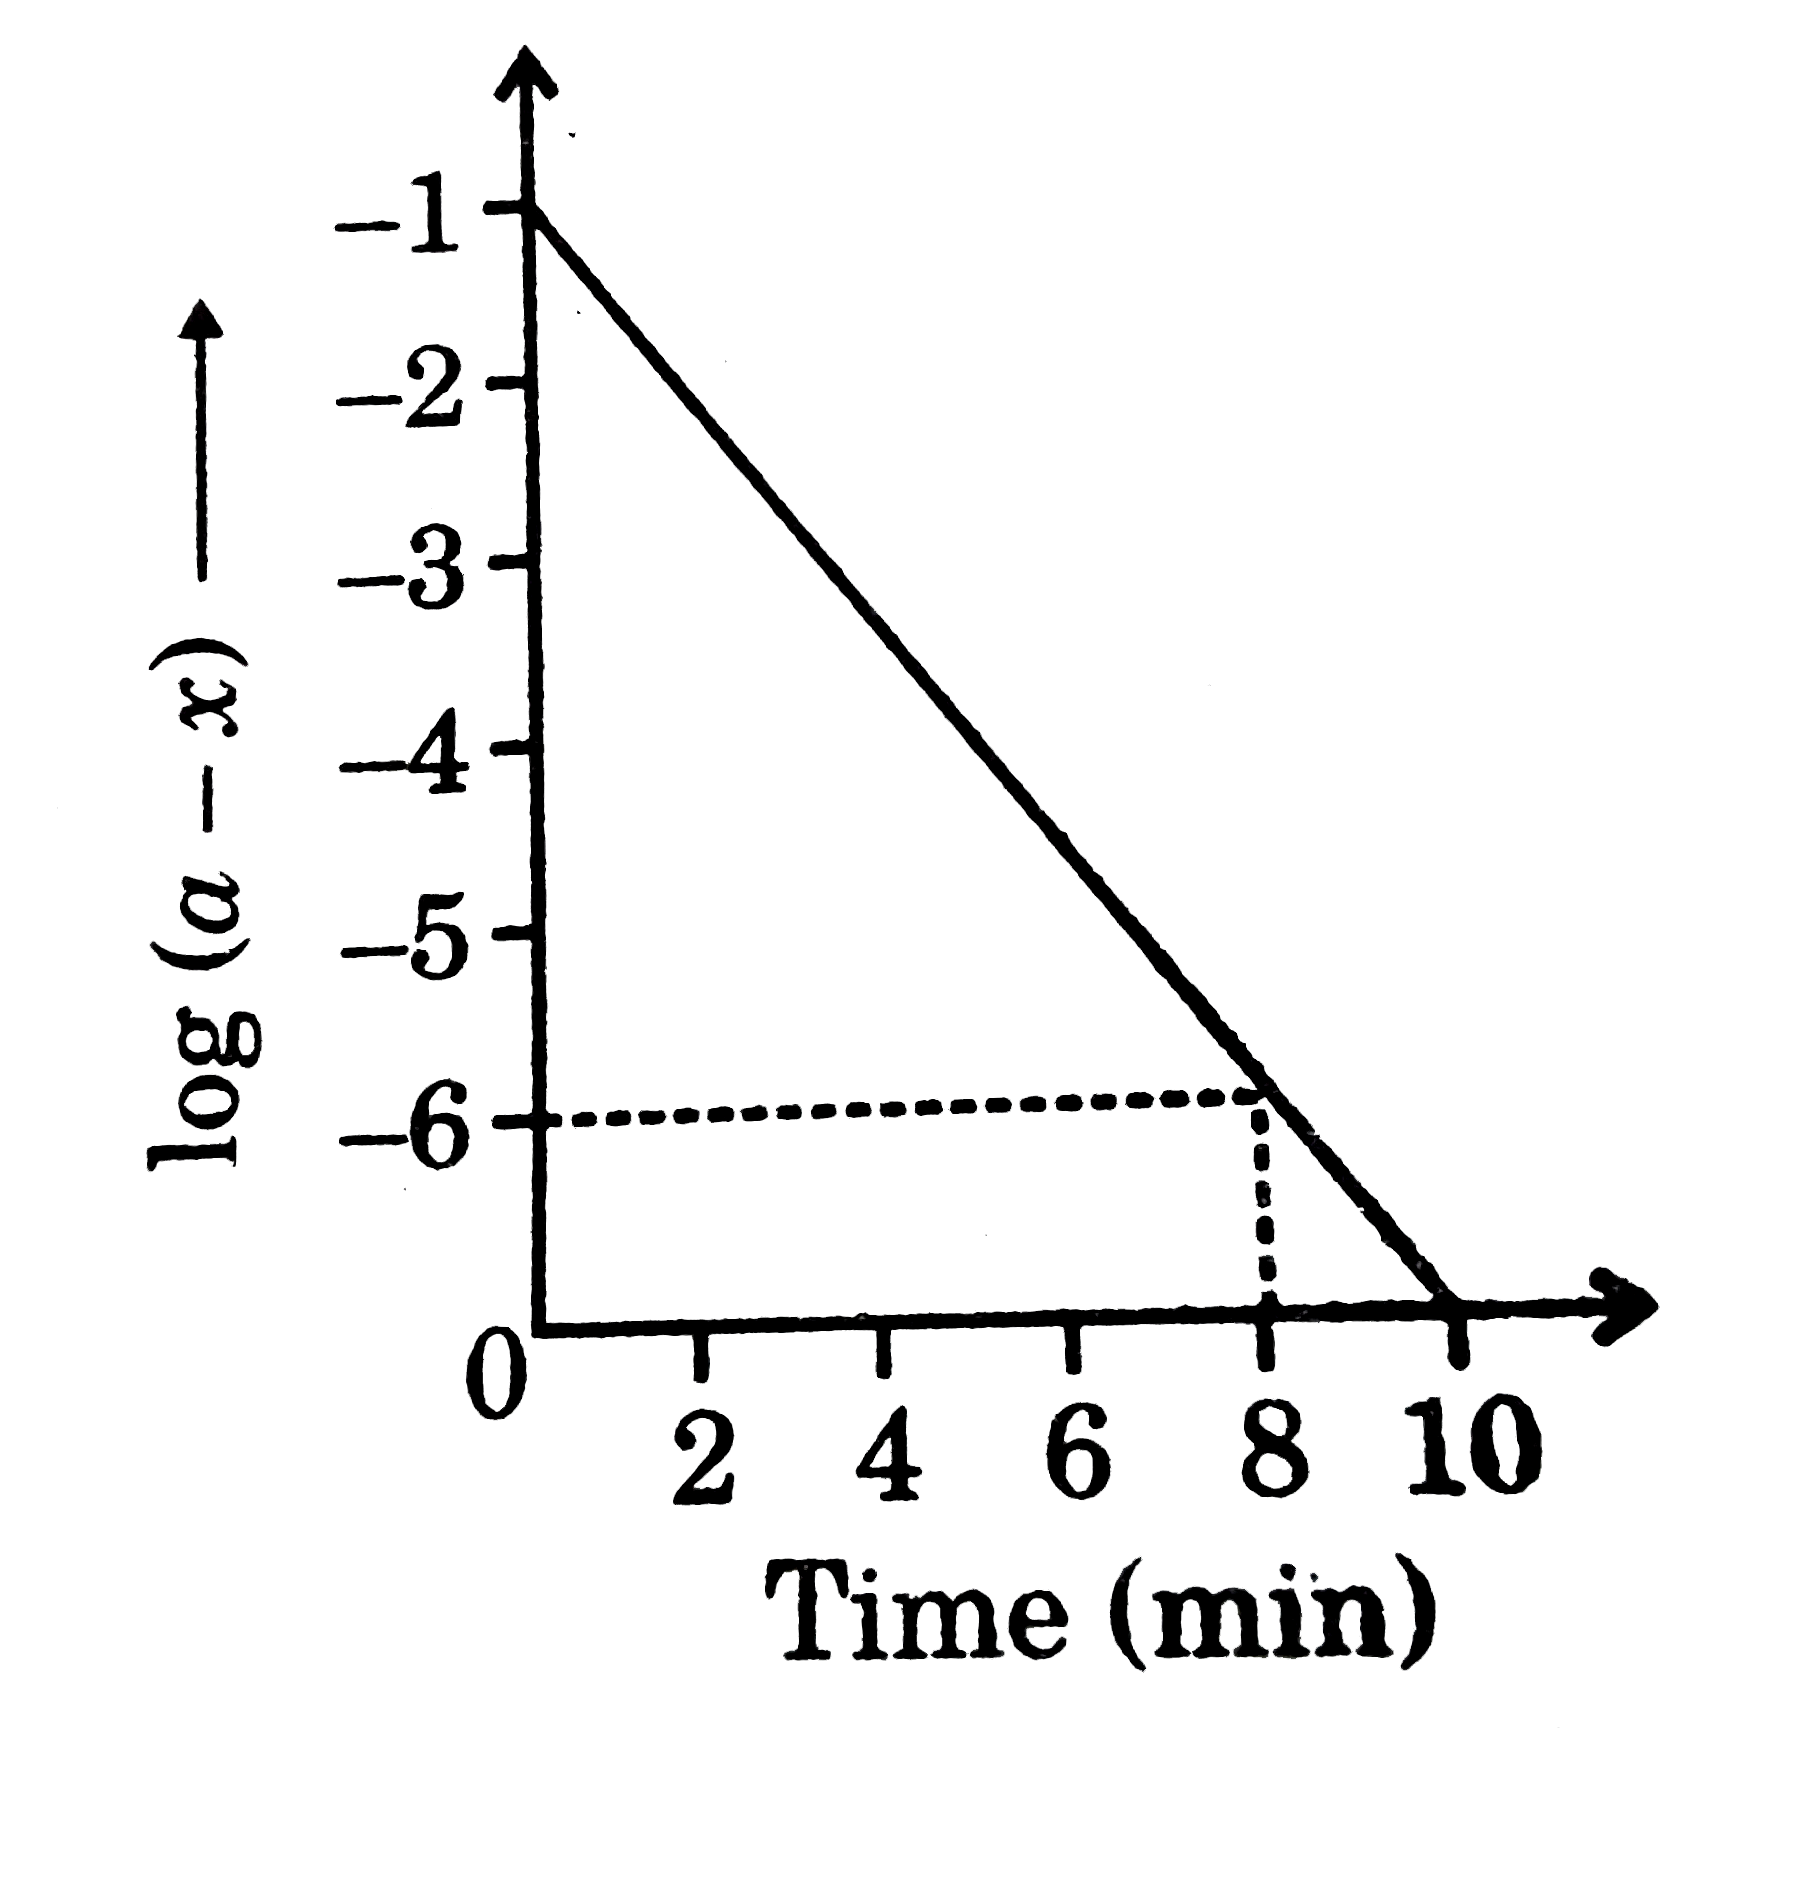
View SolutionThe conversion of vinyl allyl ether to pent-4-enol follows first-order kinetics. The following plot is obtained for such a reaction. The rate constant for the reaction is:
View SolutionA simple mechanism for enzyme-catalysed reaction is given by the following set of equations
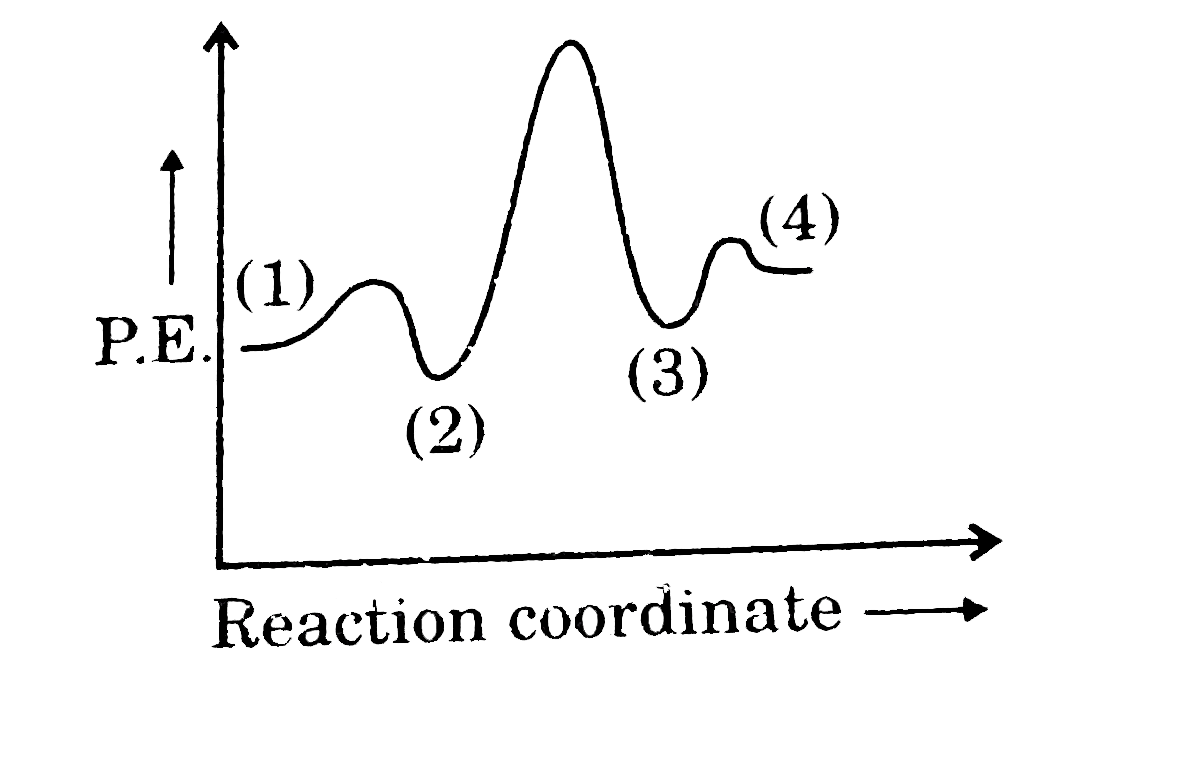
This is known as the Michaelis-Menten mechanism. The potential energy diagram is shown in the fig. Which of the following set of identifications is correct? (Assume that the temperature and pressure are constant).
View SolutionIn the following graphical representation for the reaction
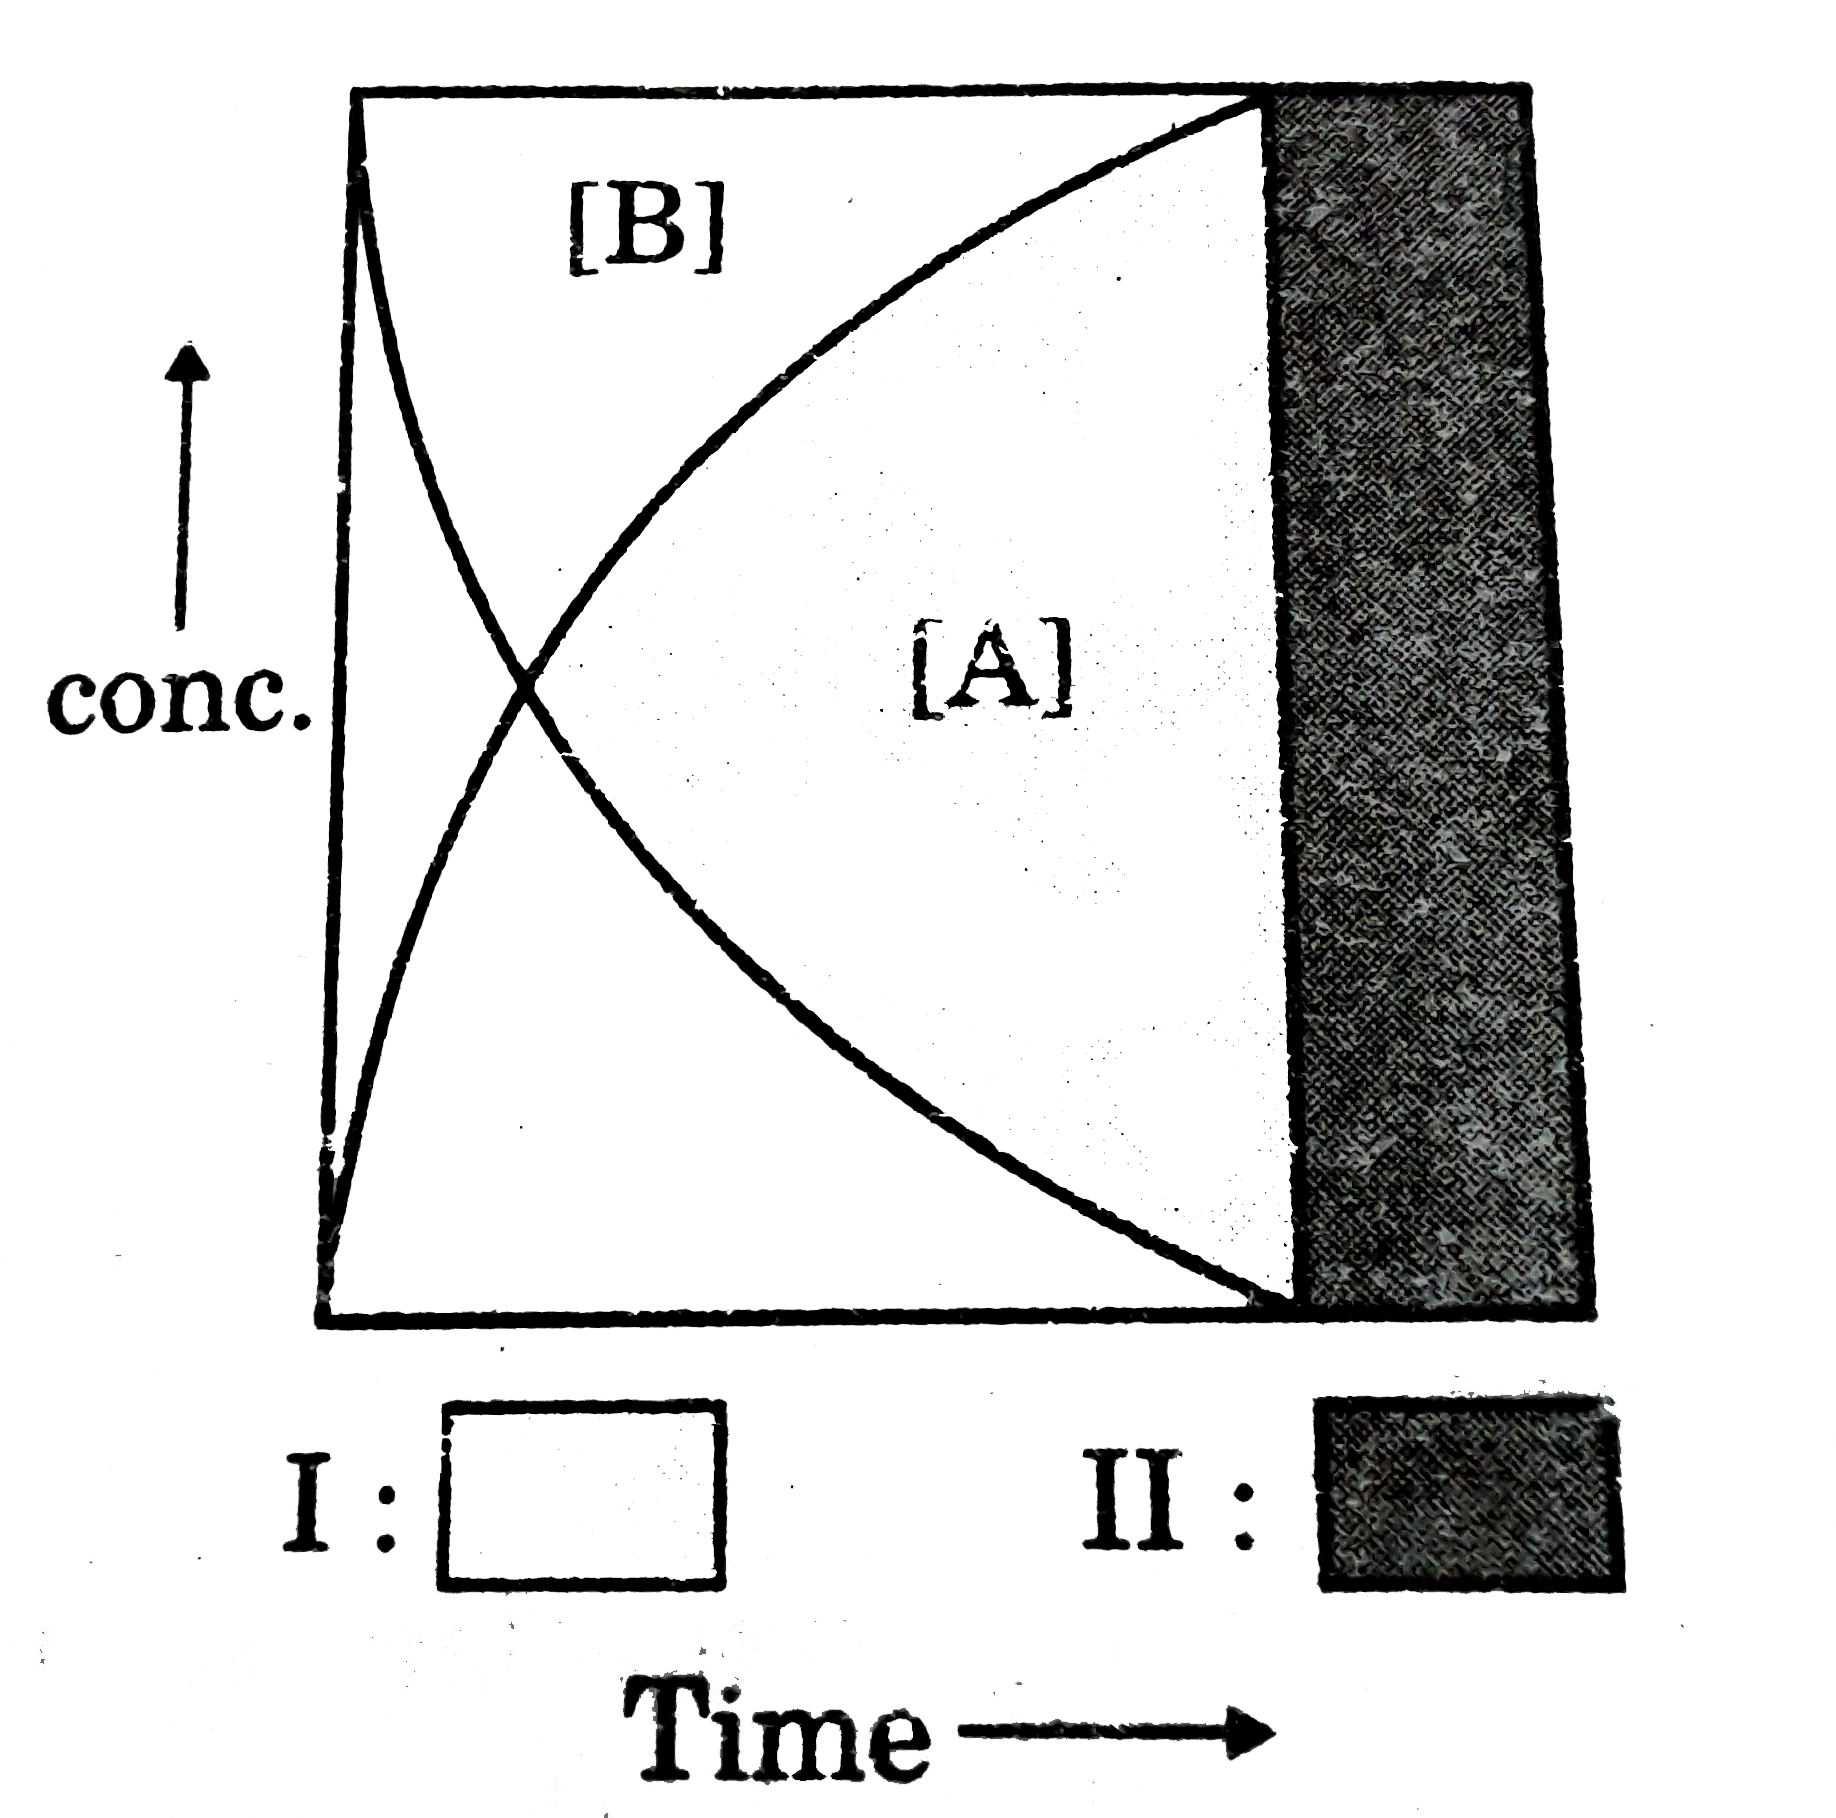
View SolutionRate law of the reaction
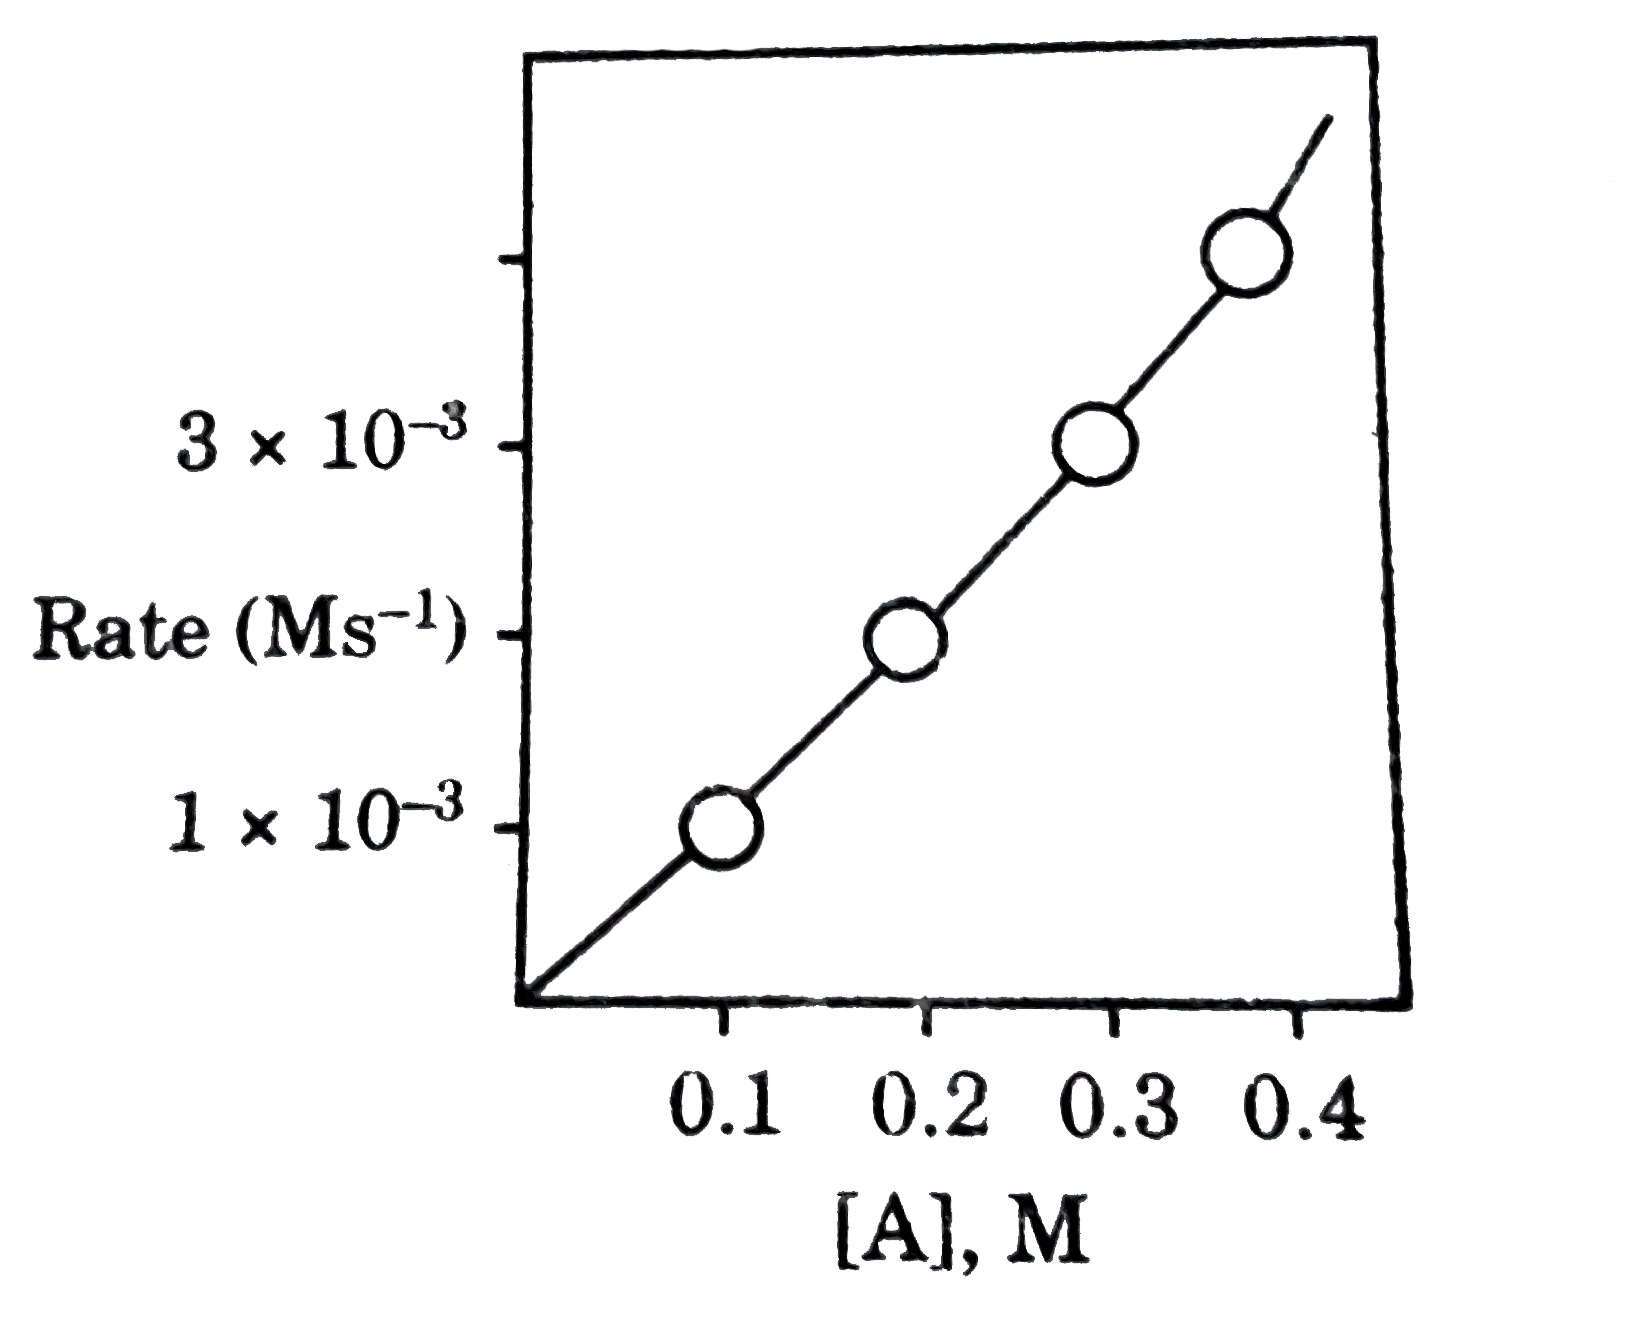
Hence, rate constant is:
View SolutionWhich graph is diagnostic of an irreversible second order reaction
View SolutionFor the reaction
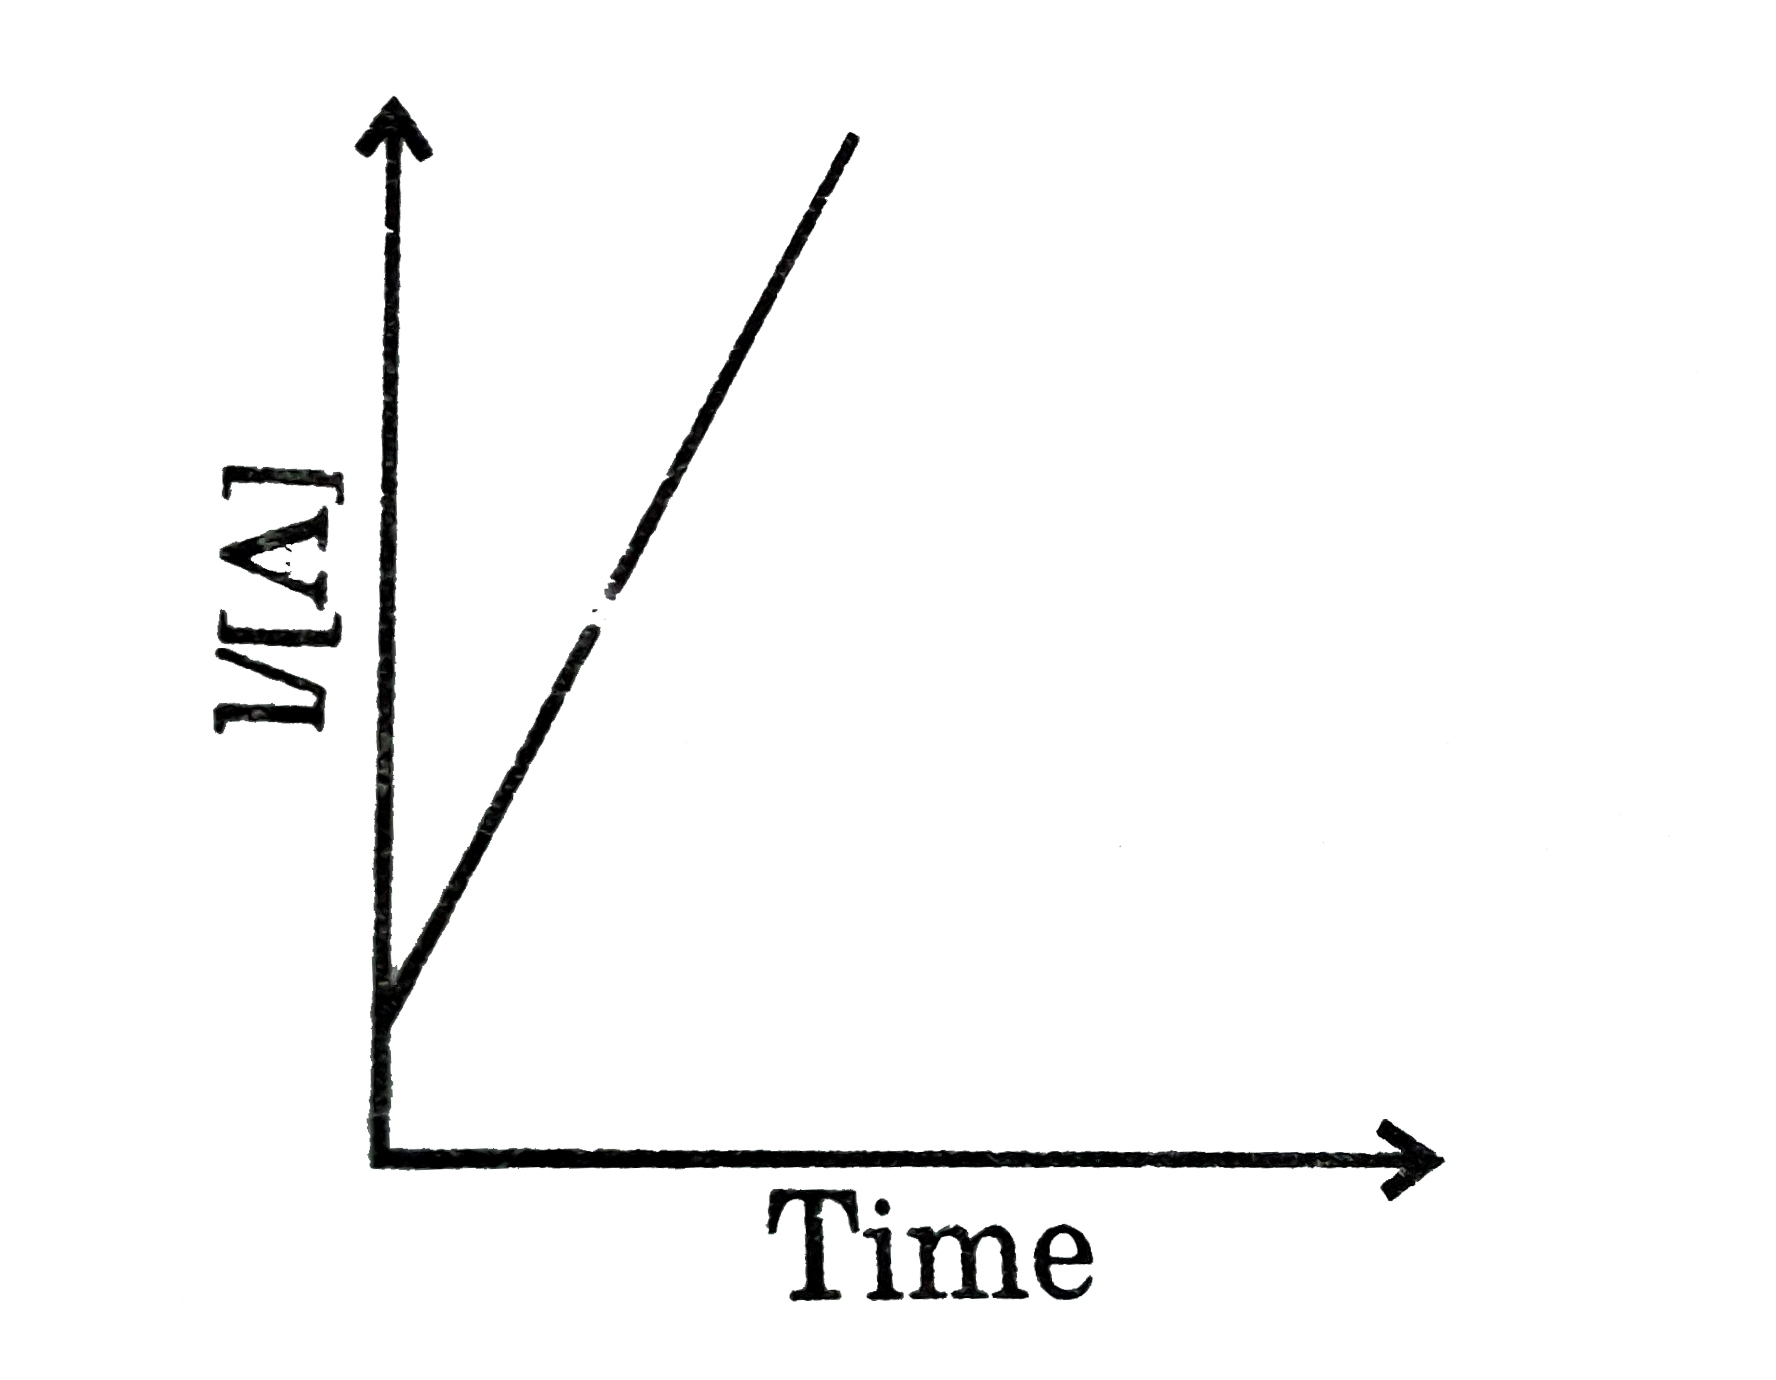
View SolutionWhich of the reactions represented in these diagrams will show the greatest increase in rate for the same increase in temperature ?
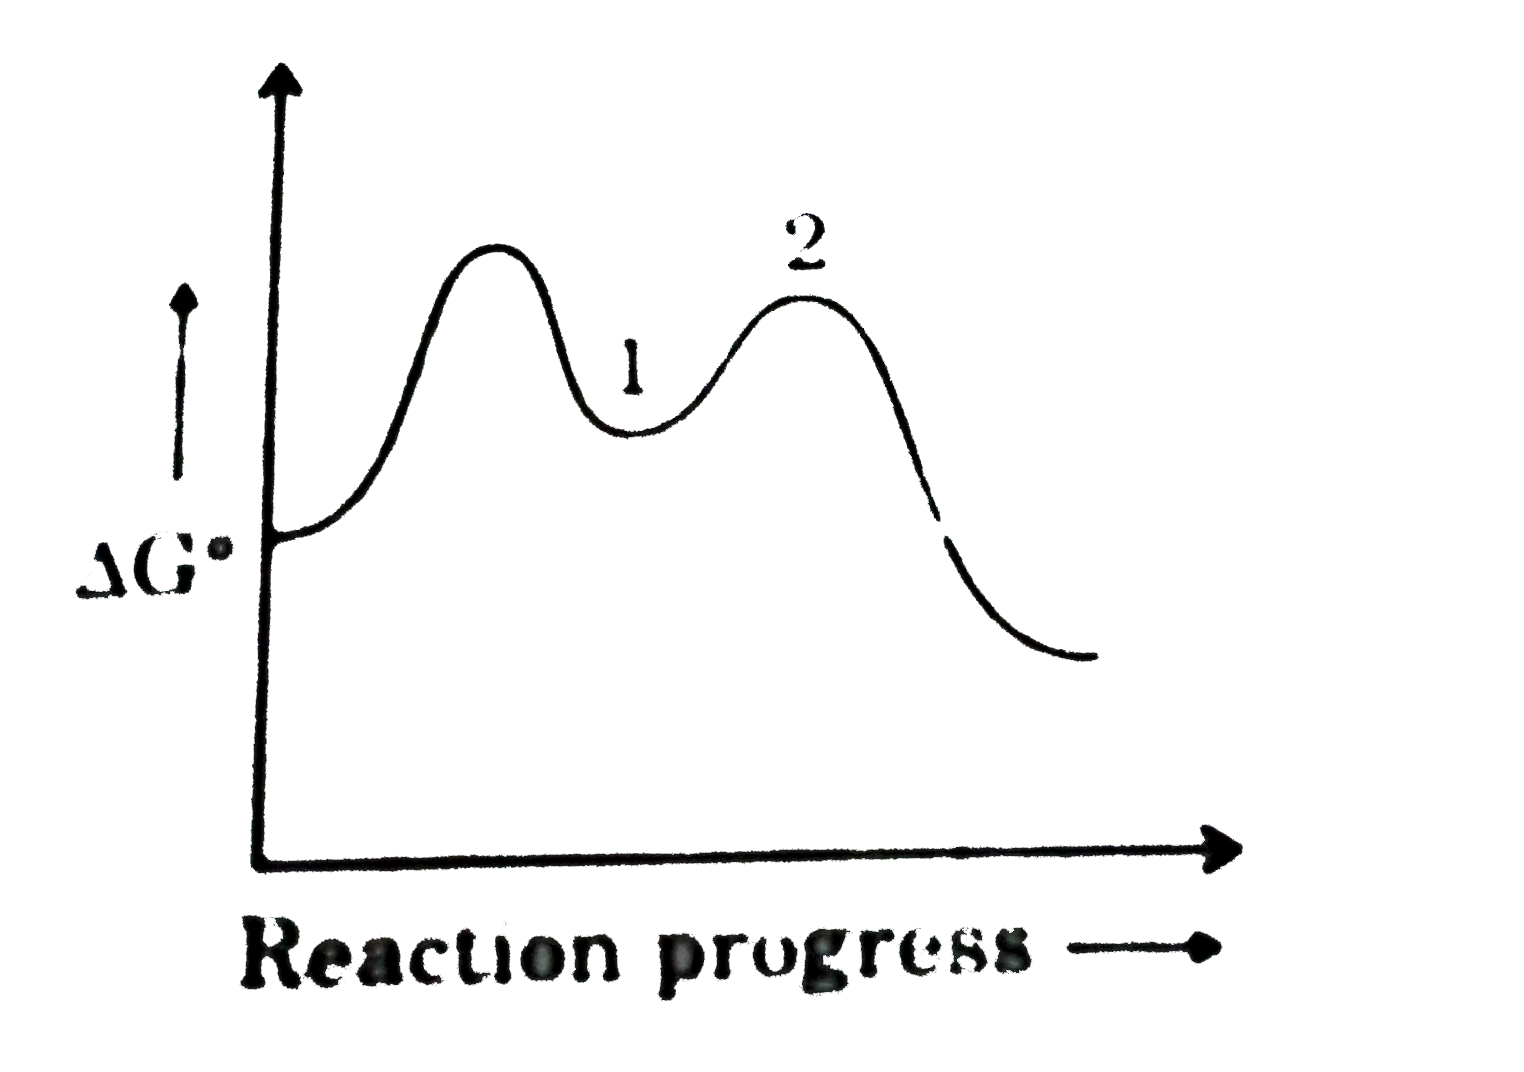
View SolutionWhat names apply to chemical species corresponding to locations 1 and 2 on this reaction coordiante diagram ?
View SolutionHow can be rate of reaction at a specific in the be determined from a graph of concentration against time ?
View SolutionIf a reaction
View SolutionFollowing reaction can take place in both direction
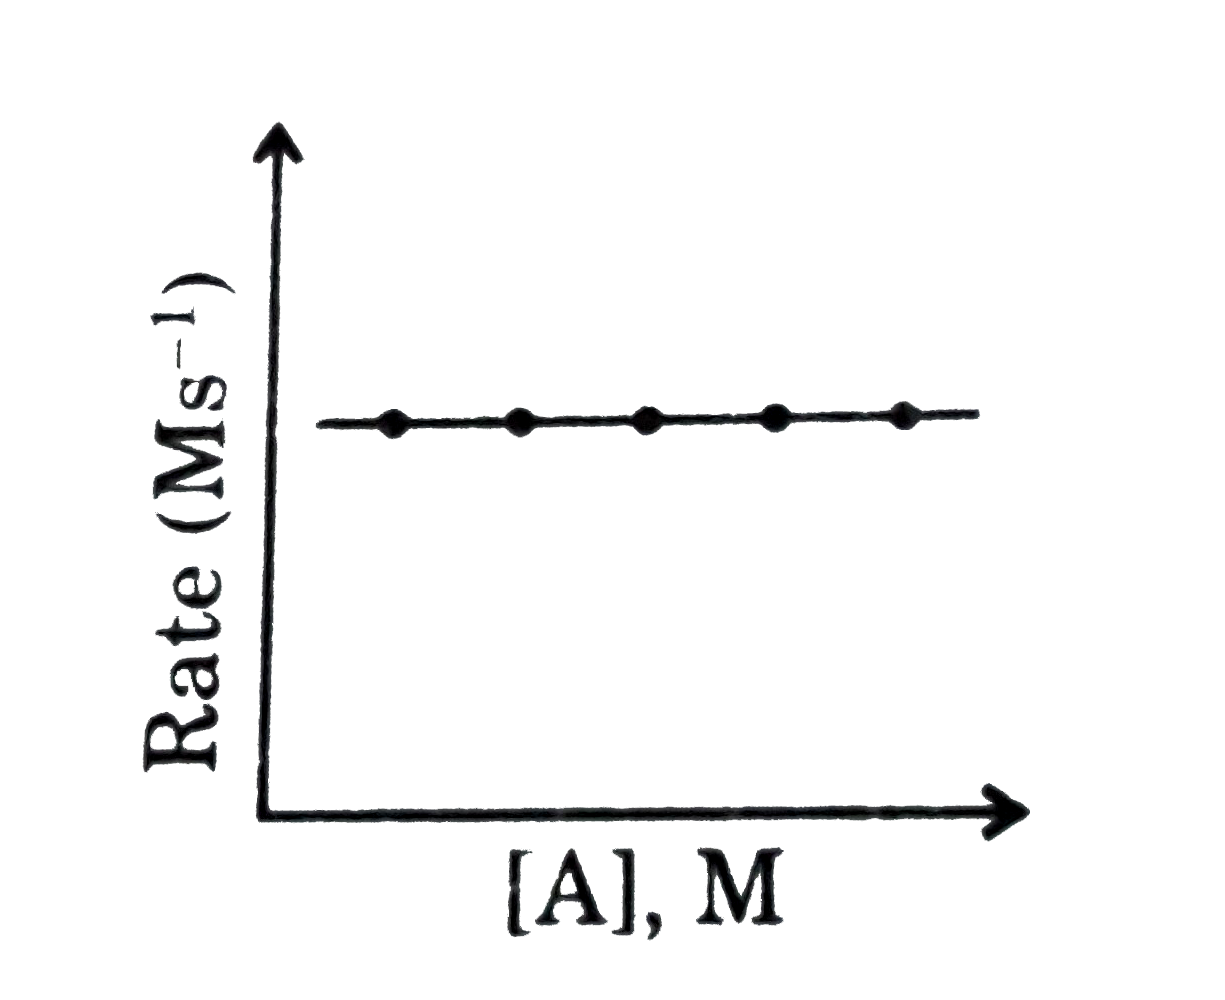
Hence, net reaction rate of B is:
View SolutionGraph between log k and
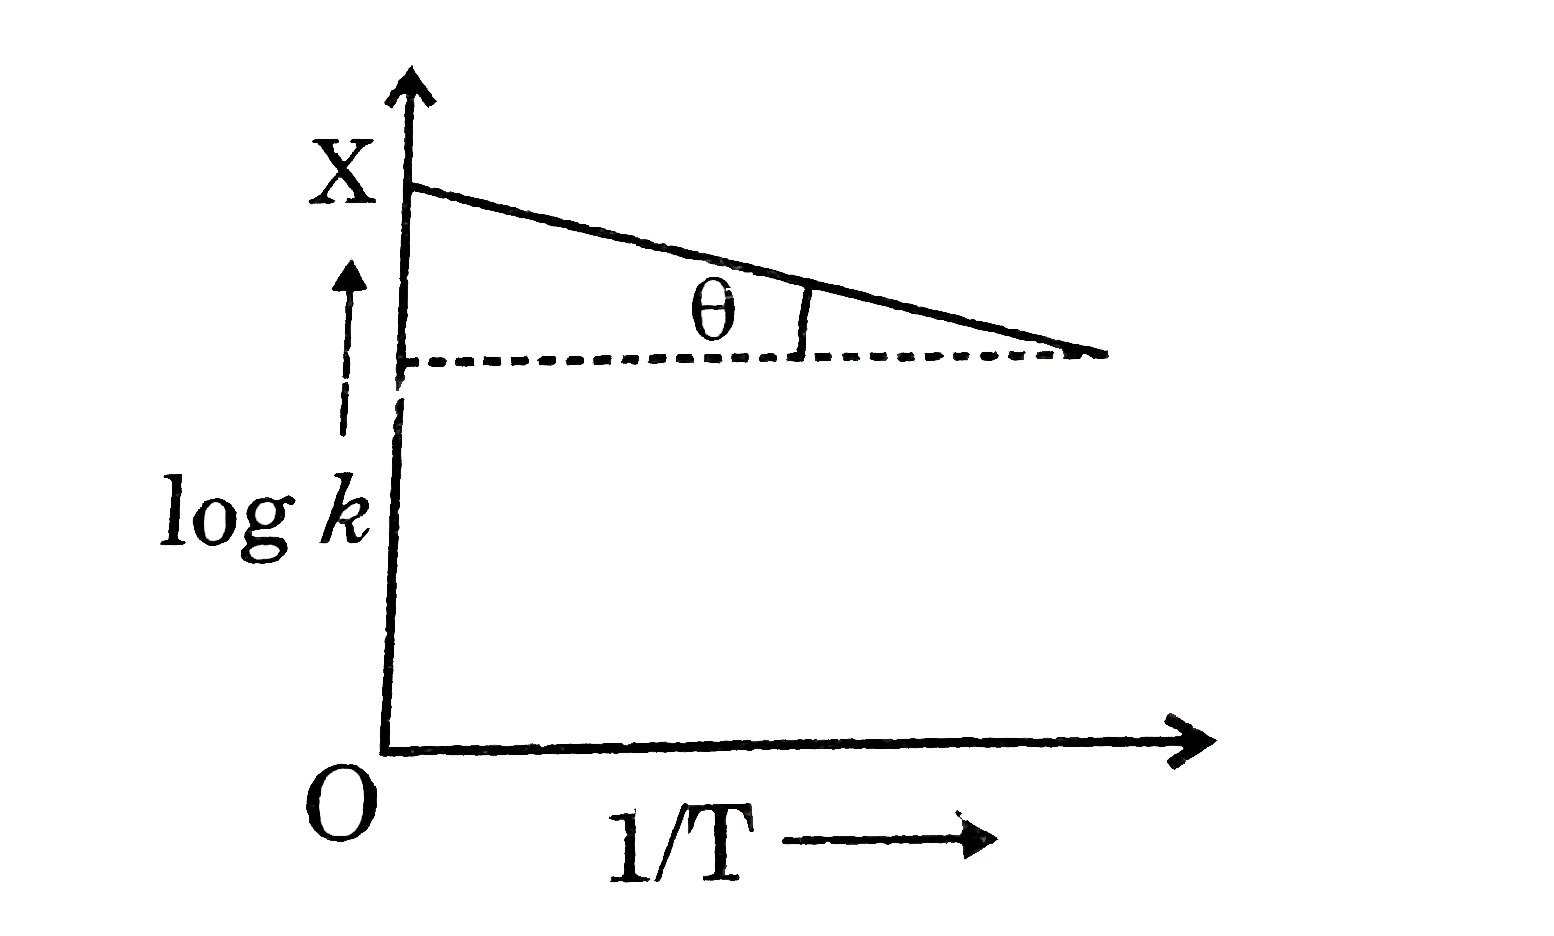
View SolutionFor a reaction
View SolutionMatch the graphical study with the order of the reaction:
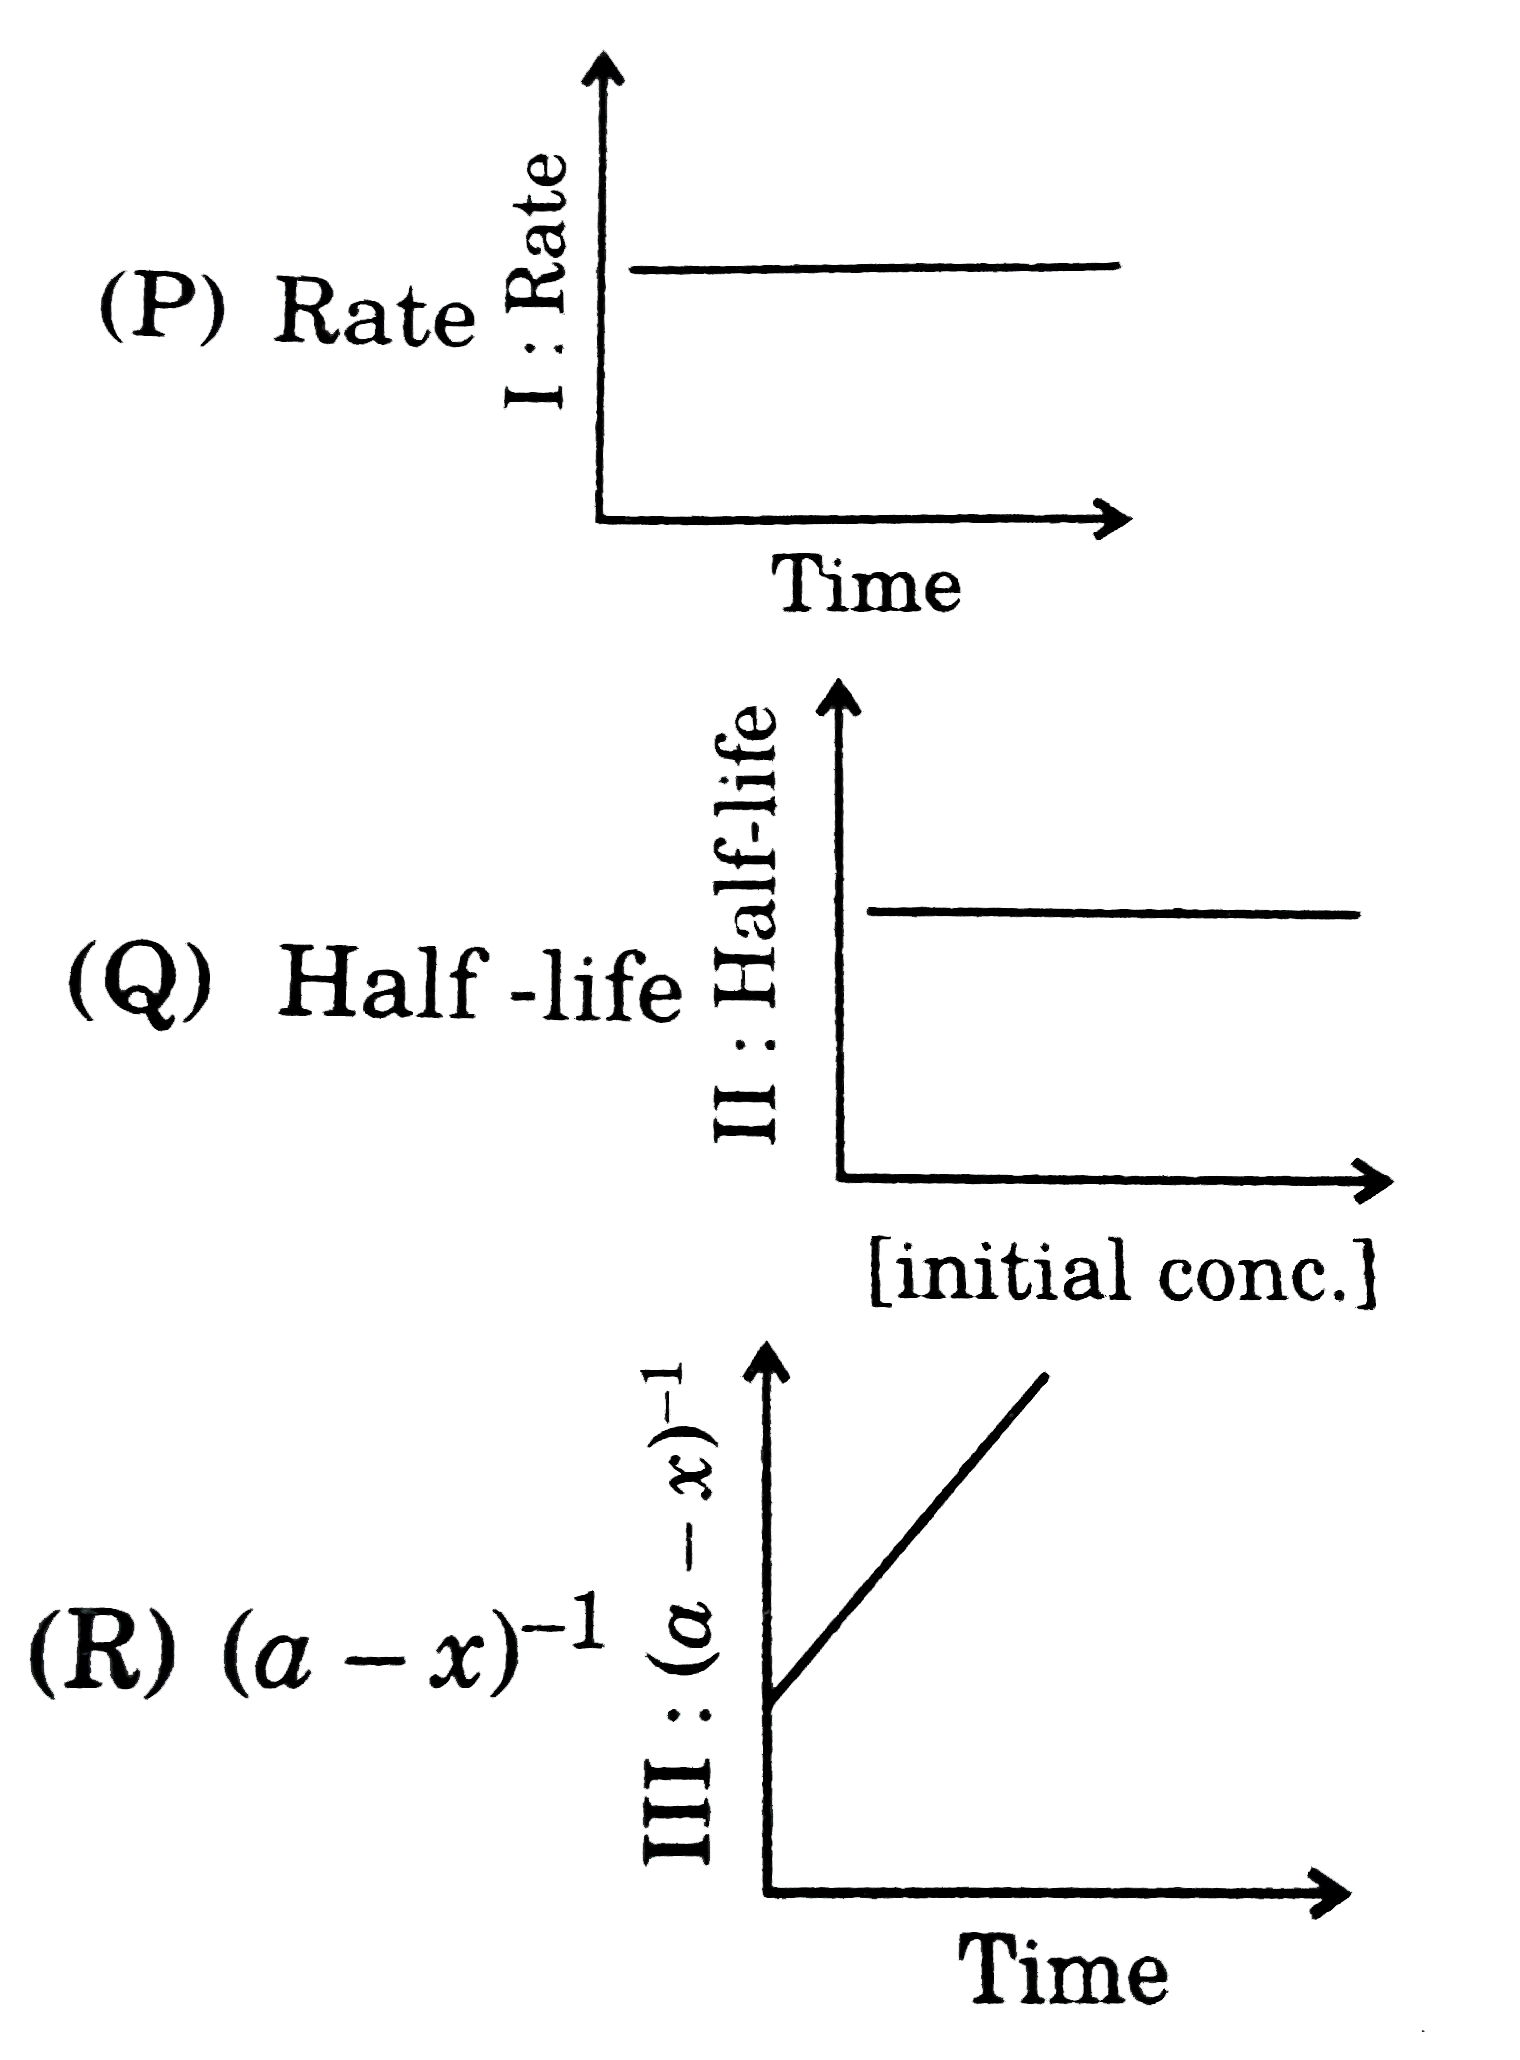
A: First, B: Second, C = Zero
View SolutionThe potential energy diagram for a reaction
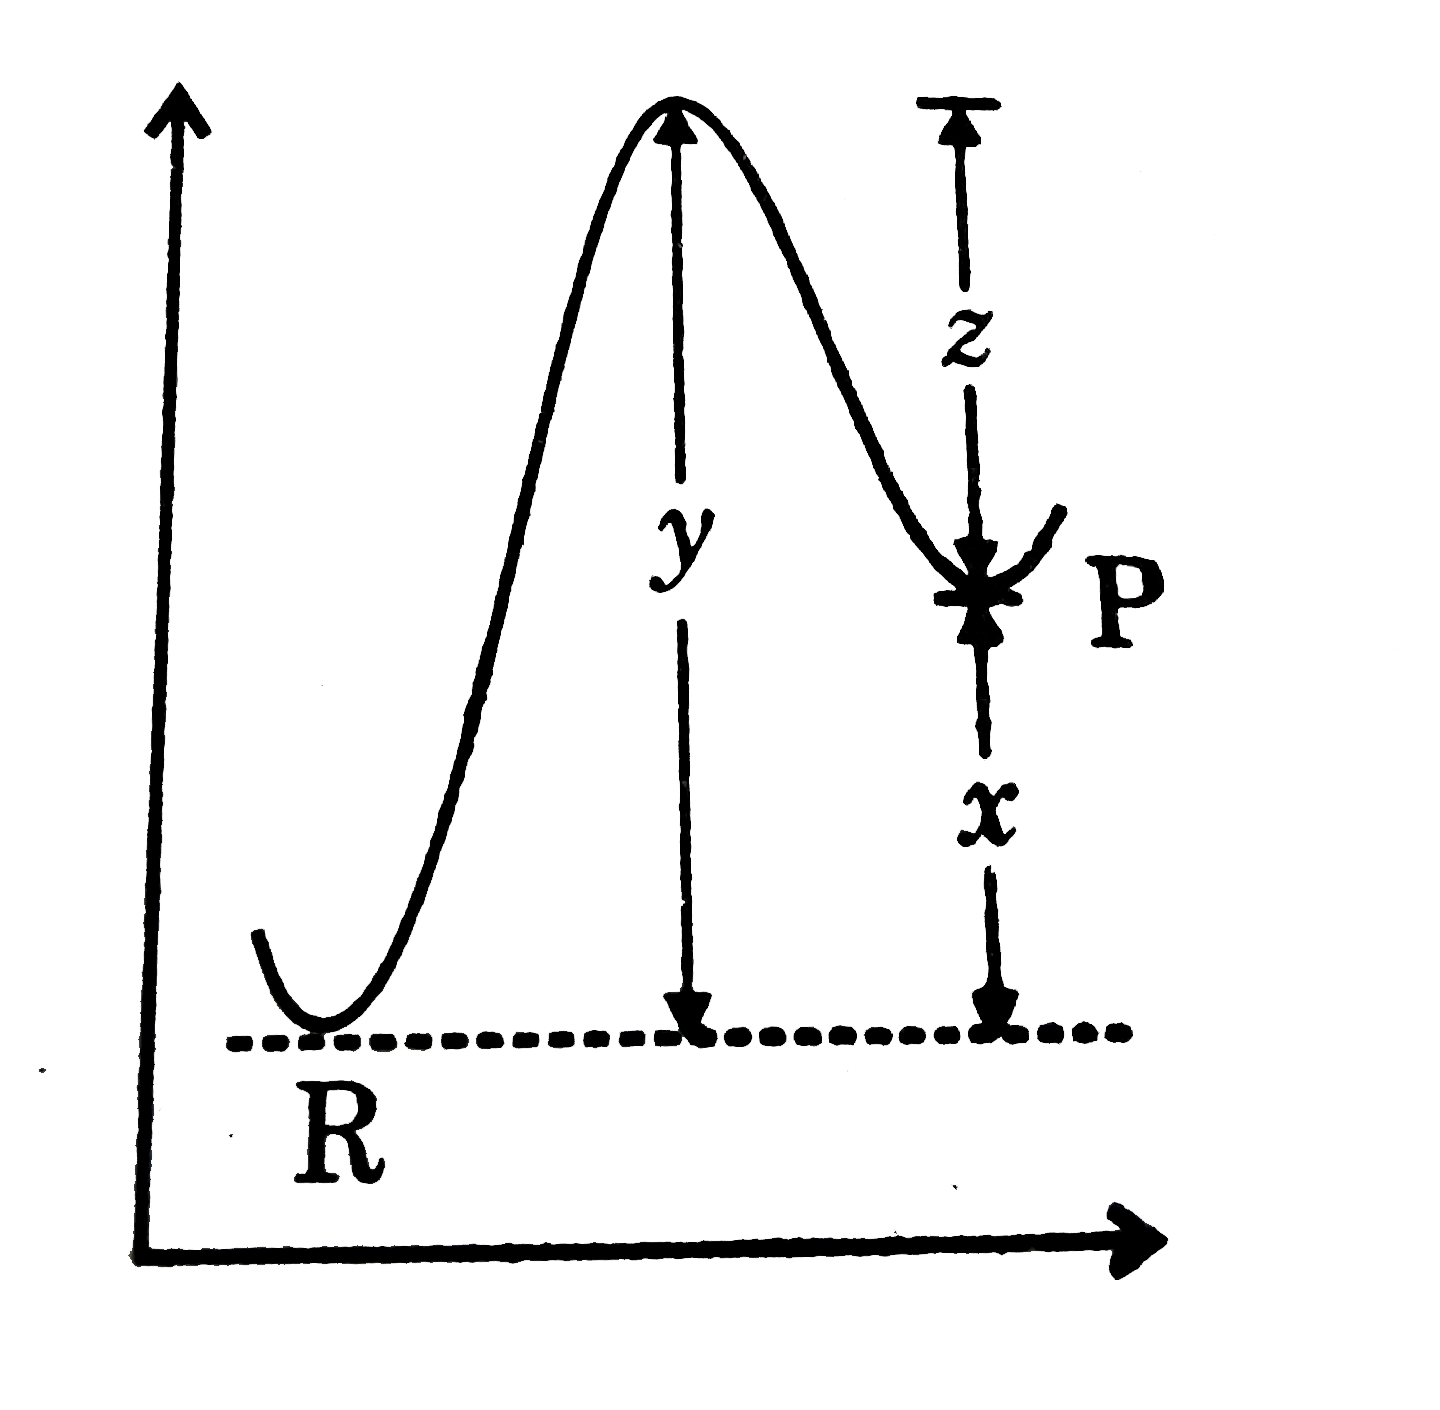
View SolutionFor the first order reaction

Following observation is made: where
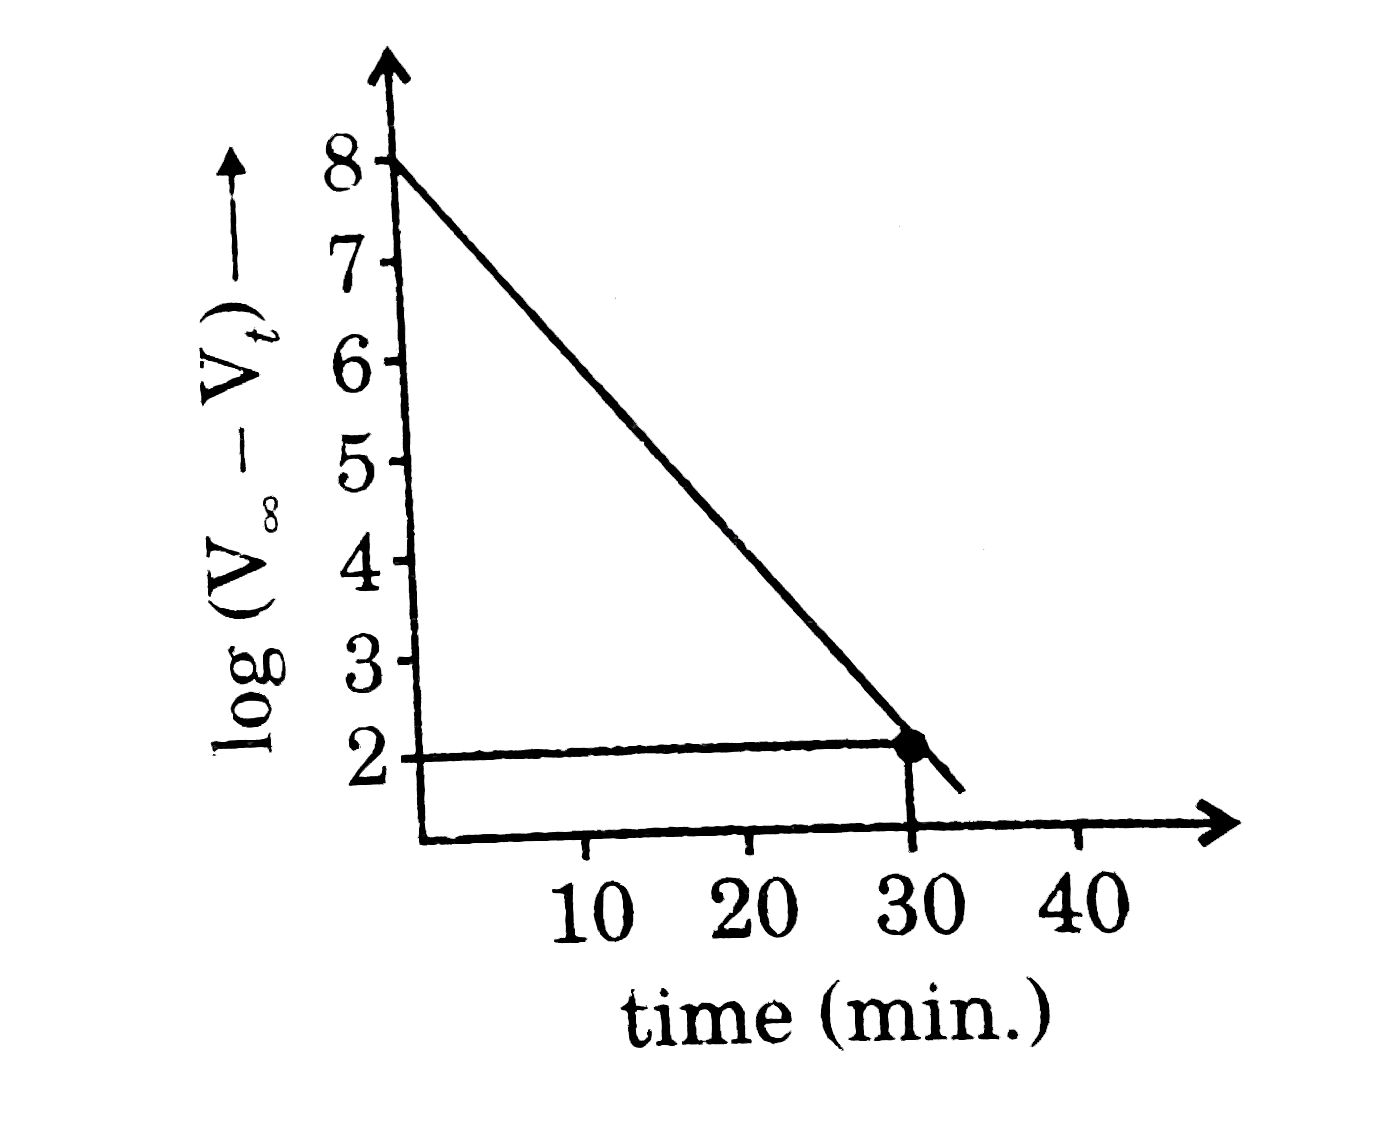
View SolutionWhen a graph between log K and
View SolutionThe slope of straight line graph between ln k us
View SolutionFor a reaction represented by
View SolutionFor a certain reaction, a plot of
View SolutionConsider the following chart.
Now with the following, select the correct code.
(P) Arrow corresponding to
(Q) Arrow corresponding to
(R) Arro corresponding to
(S) Arrow corresponding to
View SolutionBased on the following graph, mark the correct option for the reaction:
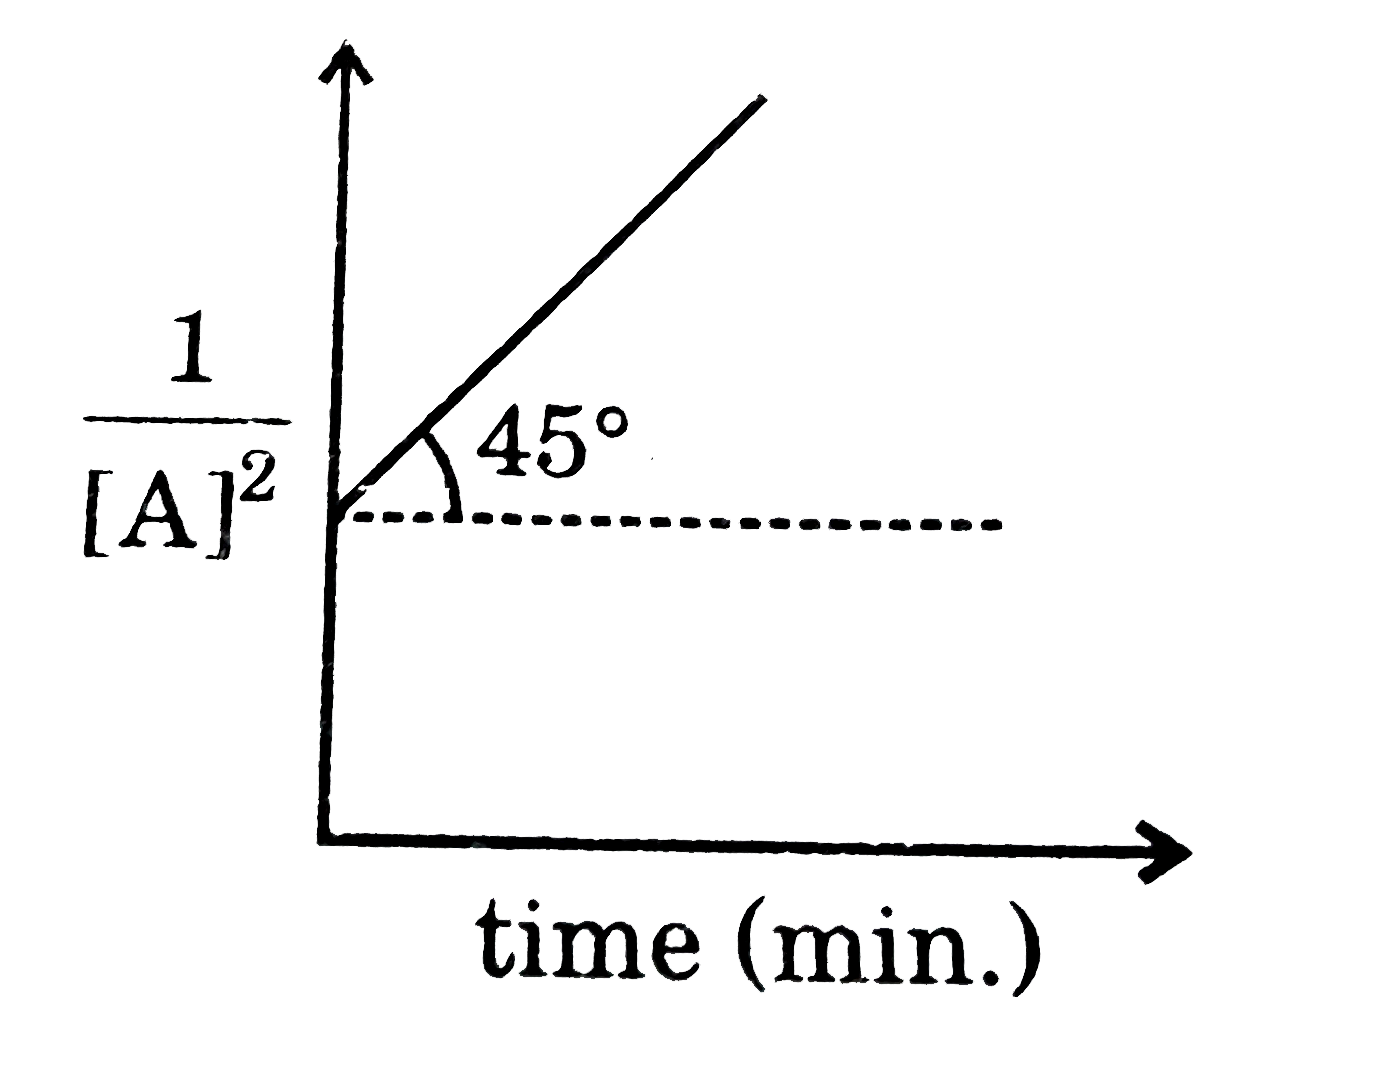
View SolutionFor the reactions (i)
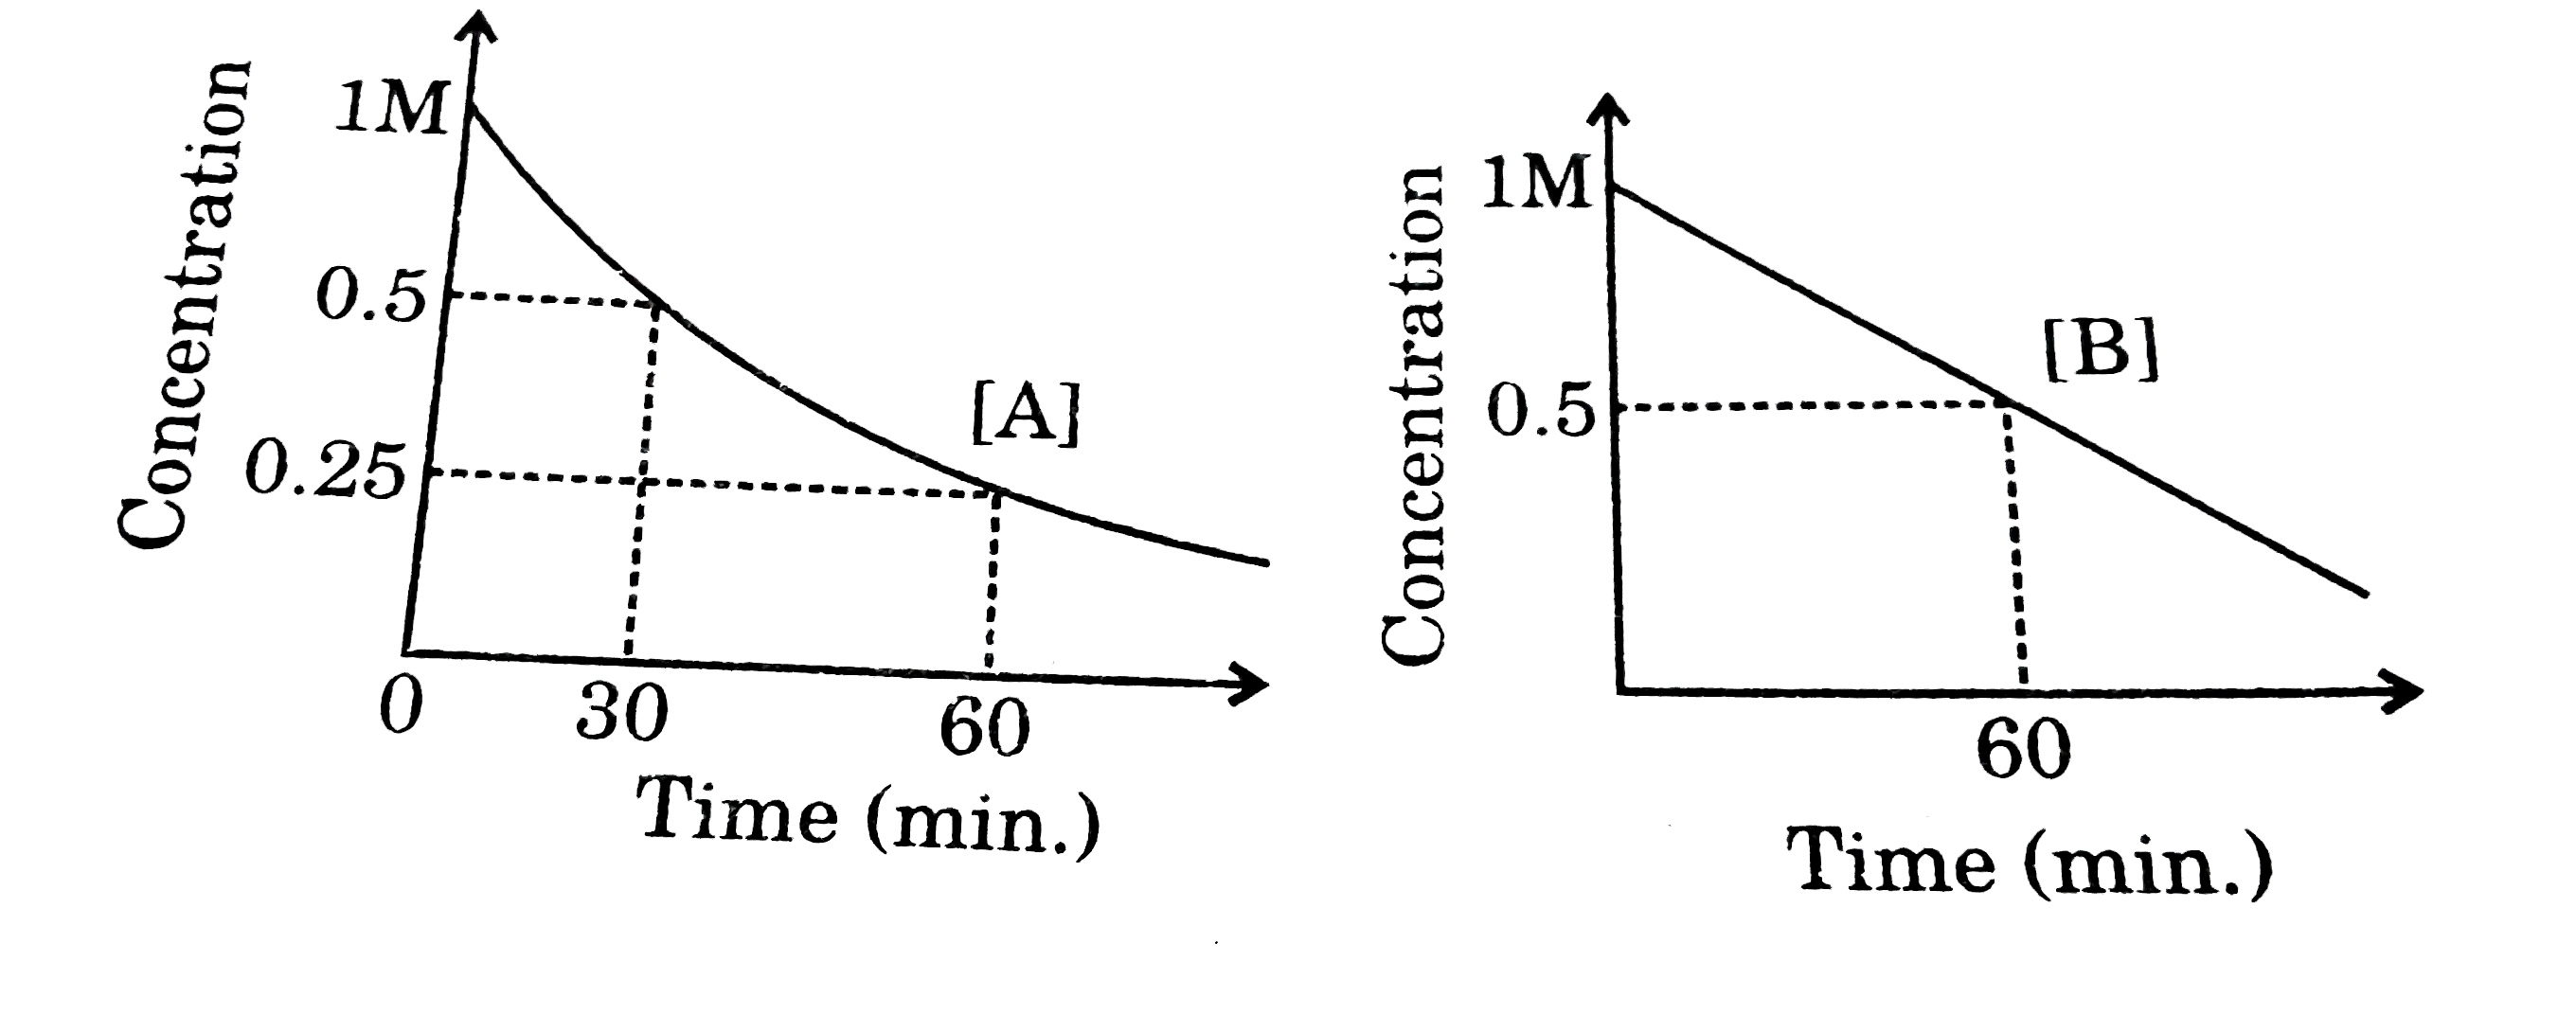
Calculate
View SolutionAccording to Arrhenius equation rate constant k is equal to
View SolutionConsider the figure and mark the correct option.
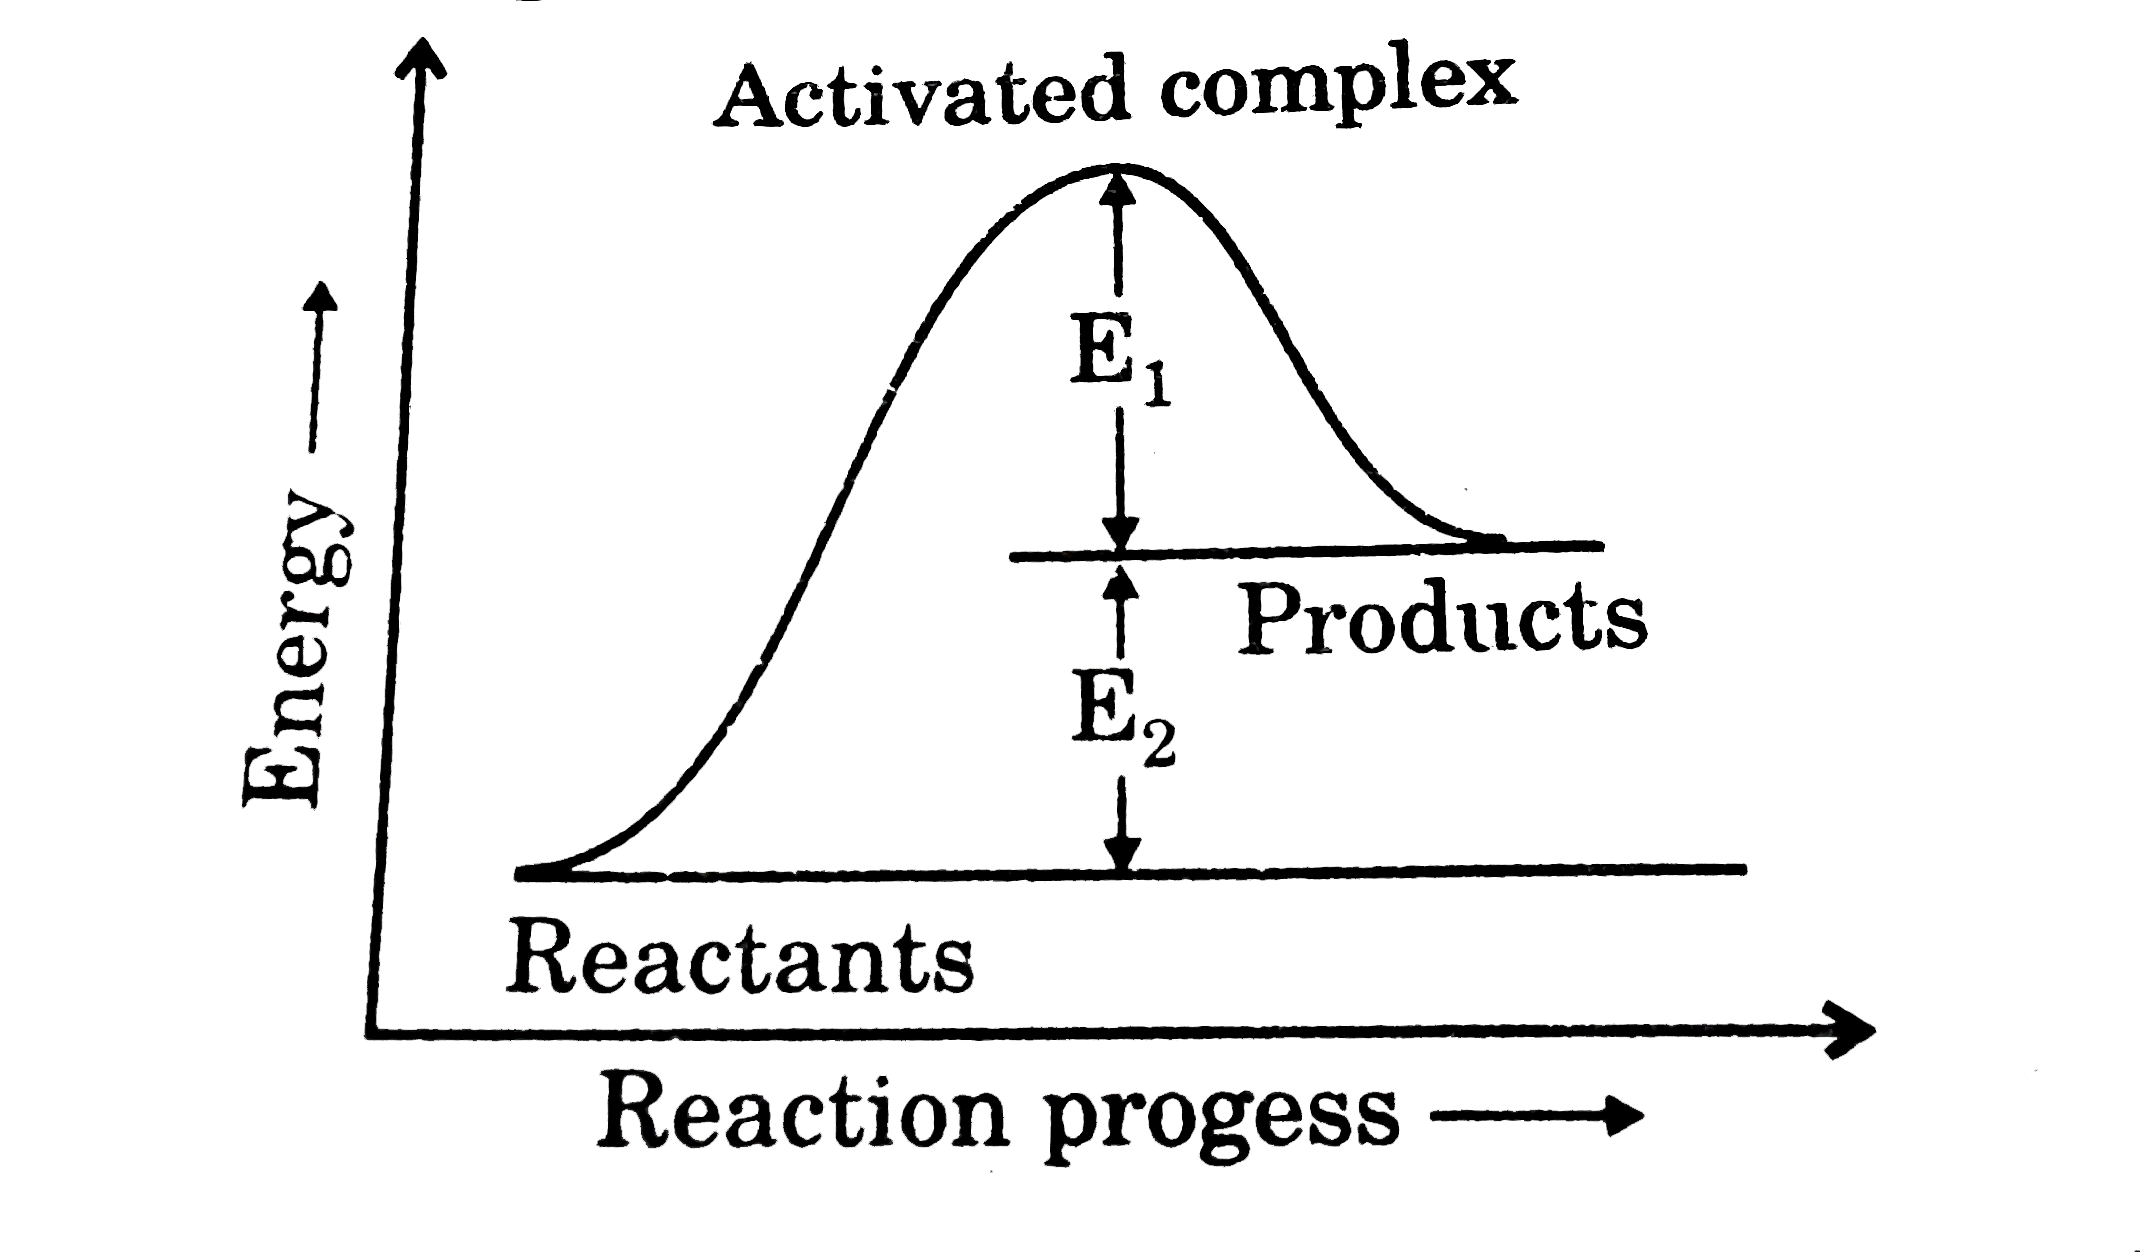
View SolutionA graph of volume of hydrogen released us. Time for the reaction between zinc and dil. HCI is given in figure below On the basis of this, mark the correct option.
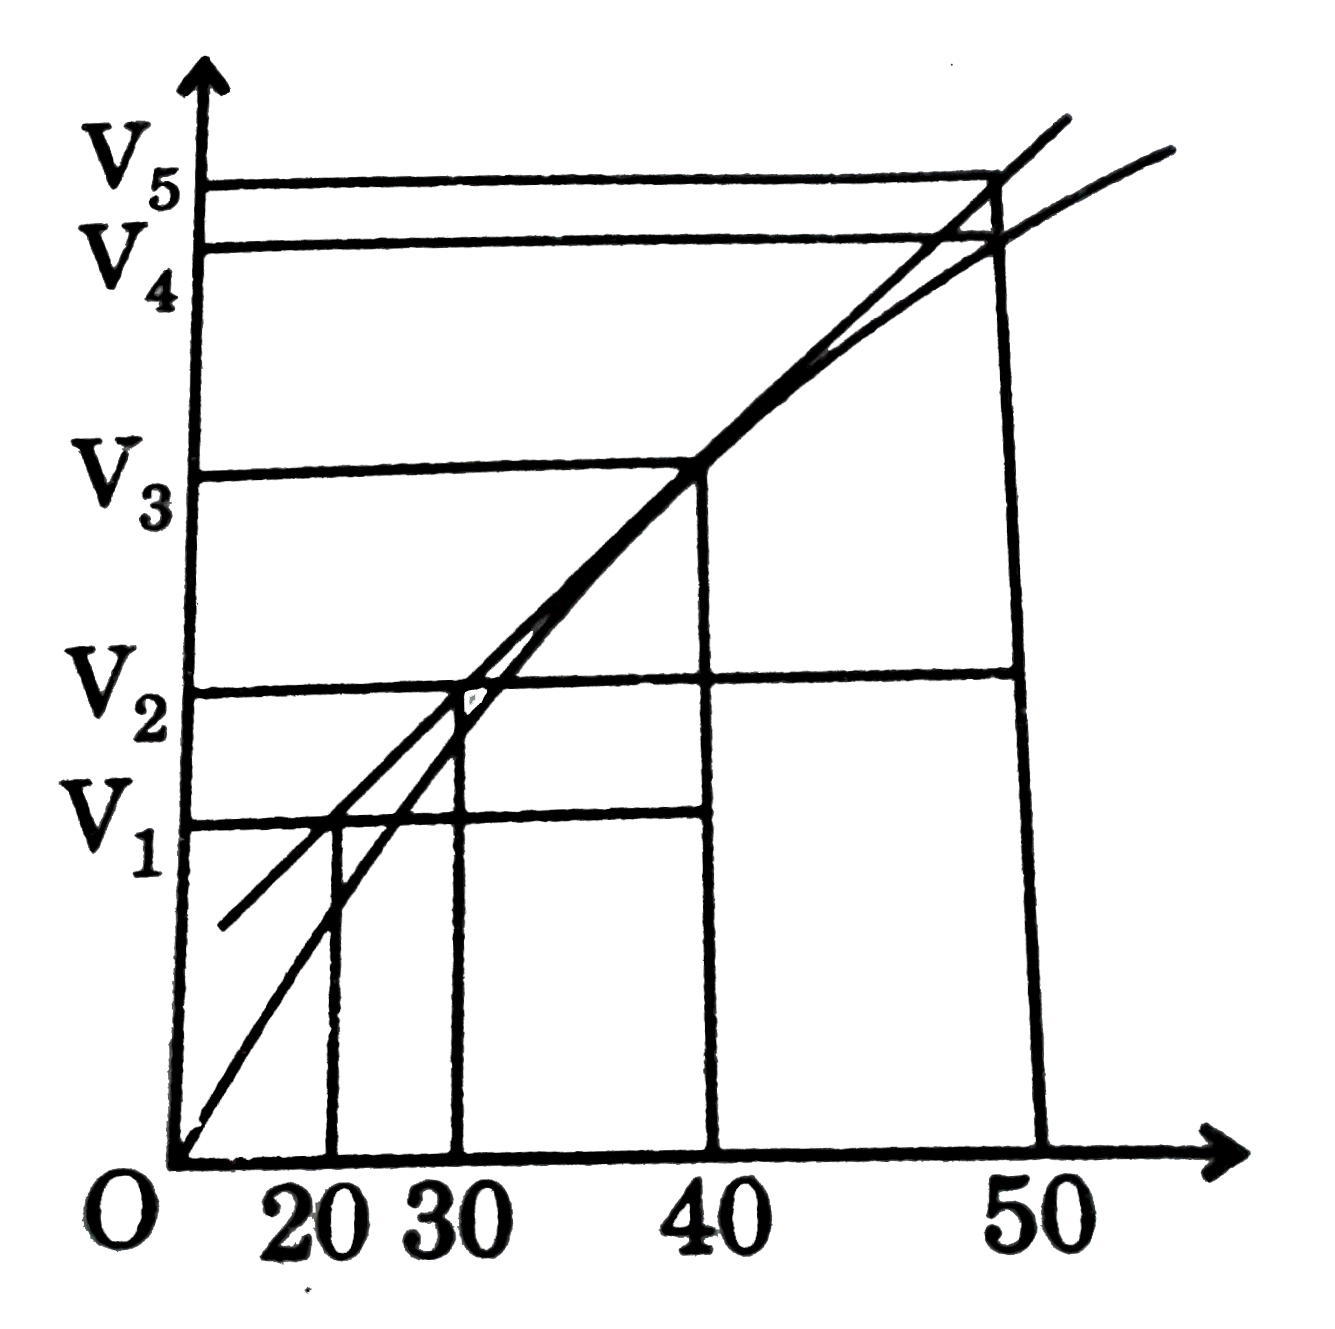
View SolutionConsider the graph given in the above questions. Which of the following options does not show instanetaneous rate of reaction at 40 th second ?
View SolutionFor any first order reaction following observation is made. If at temperature (T) half life of the reaction is 6930 sec. and at temperature (T') half life of the reaction is
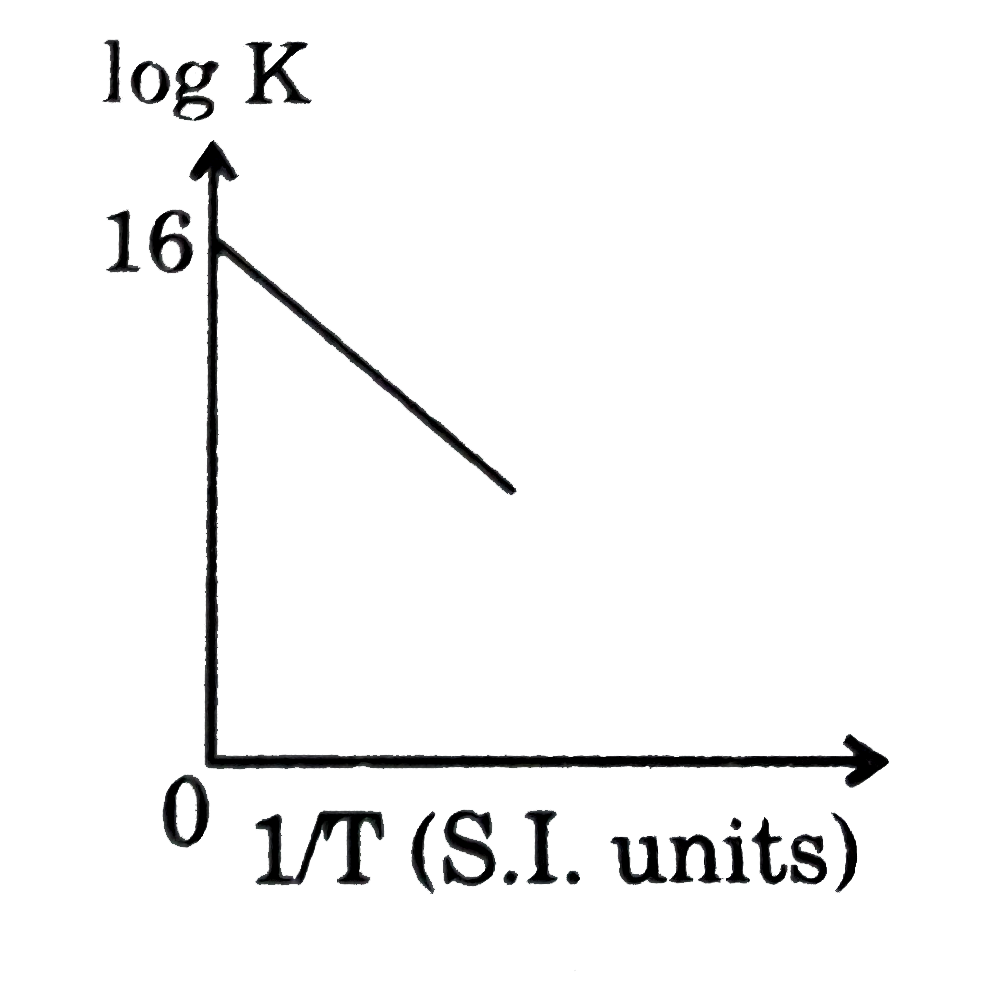
View SolutionWhich of the following graphs is correct for a first order reaction ?
View Solution
View SolutionFrom the energy profiles for the two untimolecular reactions below, how will the rates of the two reactions compare if the temperature of each reaction is increased from
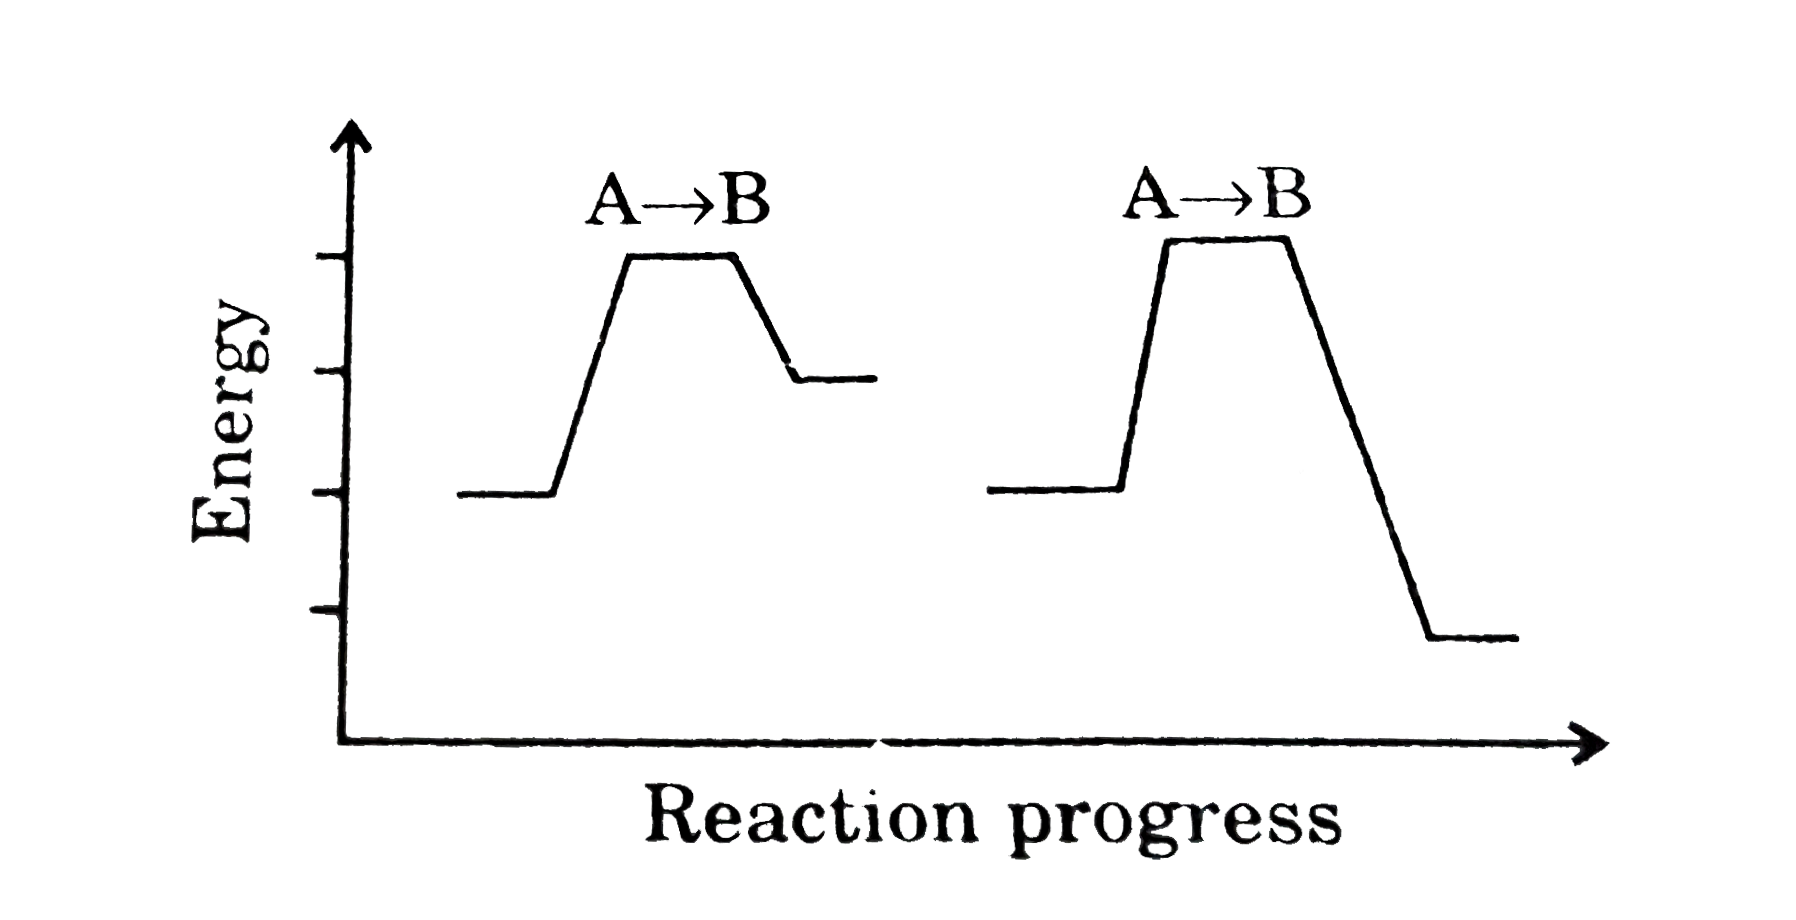
View SolutionIn a second order reaction, the plot of
View SolutionThis is the rate law for a reaction that consumes X Rate
View SolutionWhich graph is linear for a reaction that is third order in [A] ?
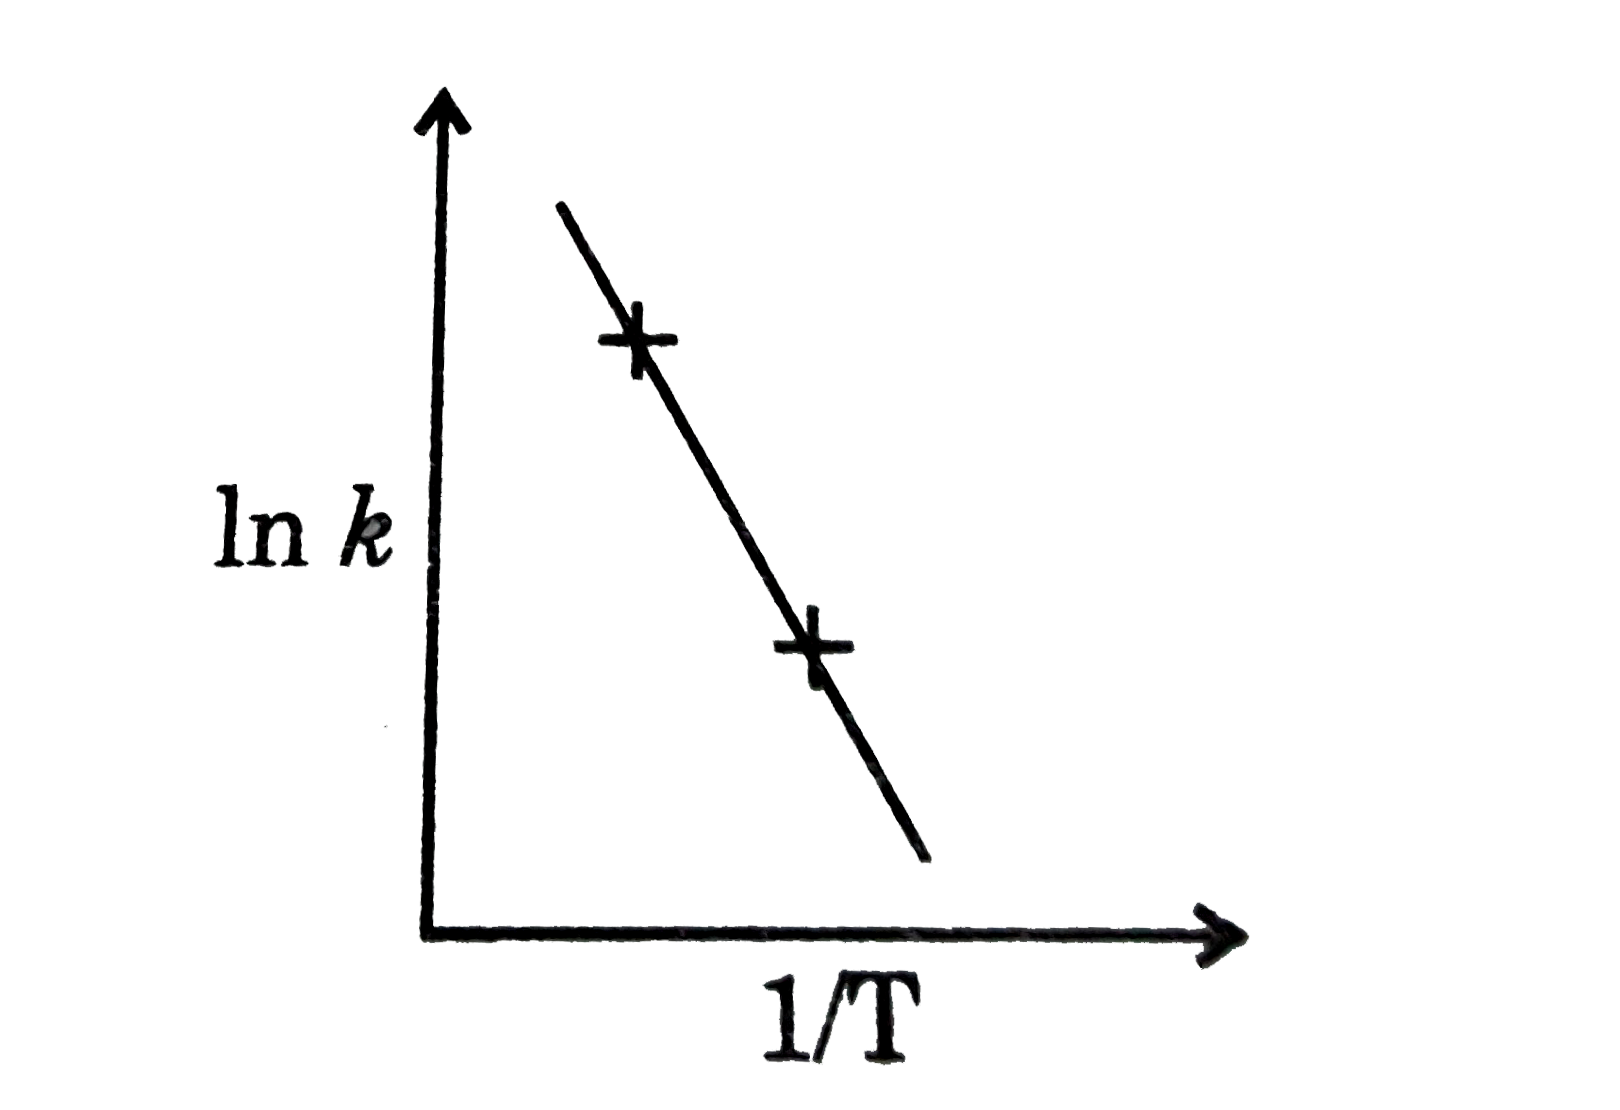
View SolutionThe value of the specific rate constant, k, for a reaction is determined at two different temperatures and plotted in the accompanying graph. What is the relationship between the slope of the graph and the activation energy,
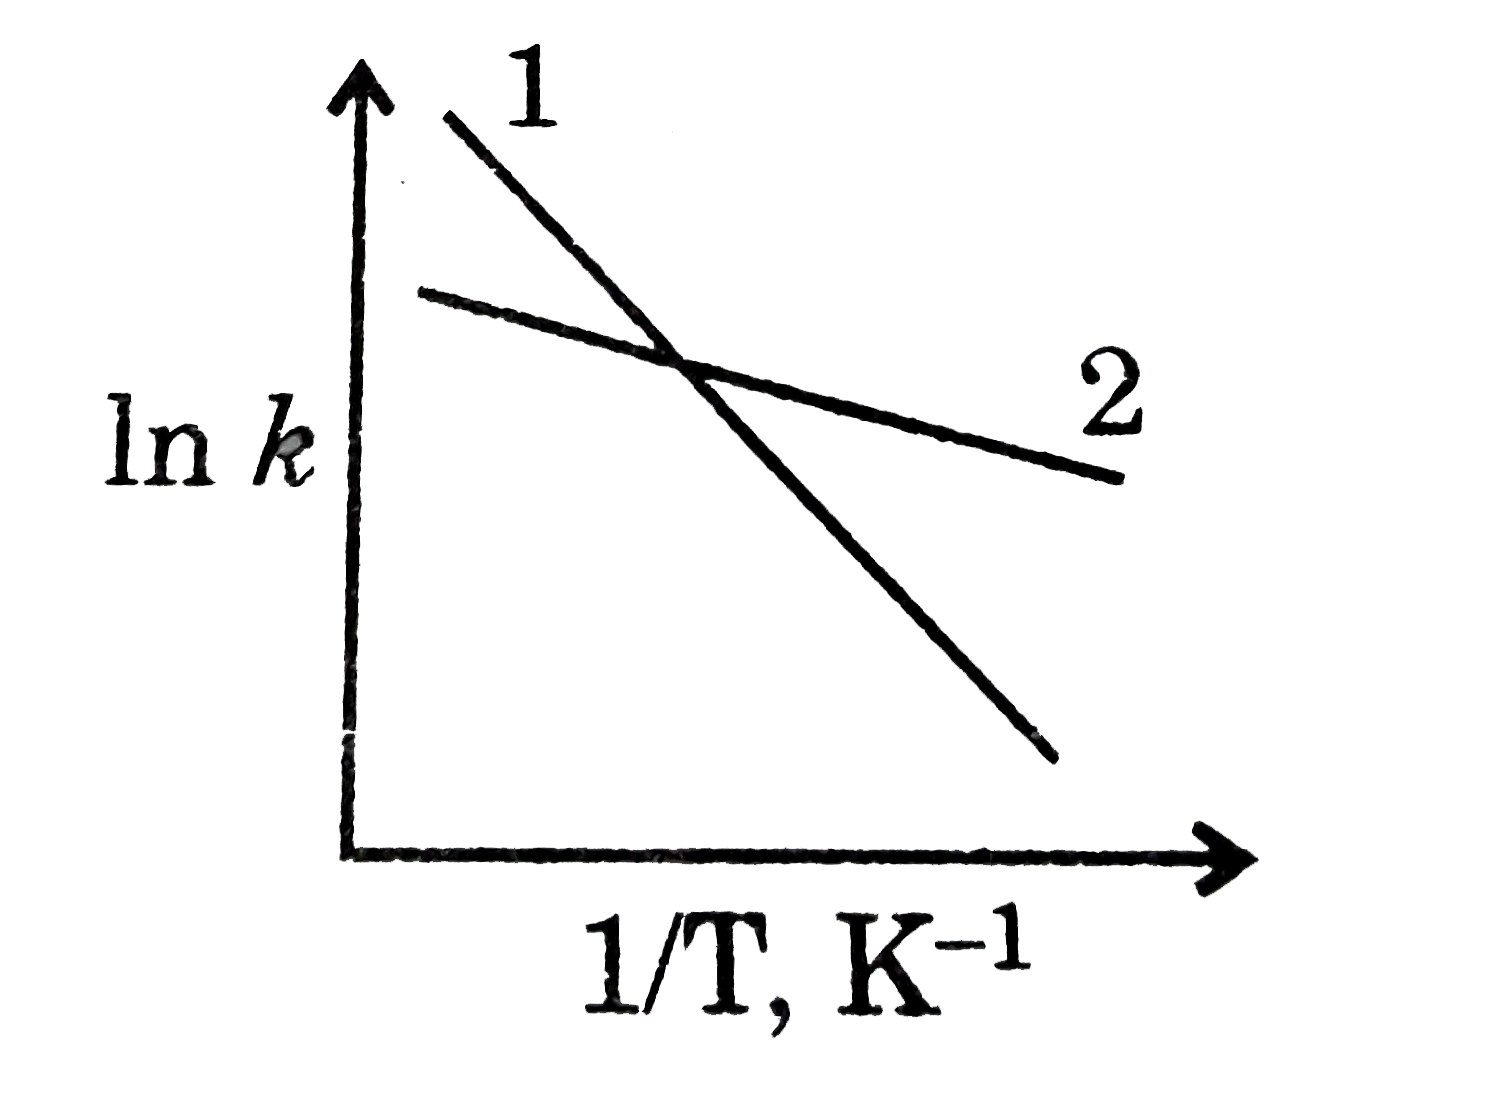
View SolutionIn adjoining diagram depicts the temperature behaviour of the rate constant k, for two reactions,1 and 2. Which statement about the k values at low temperature and the activation energies,
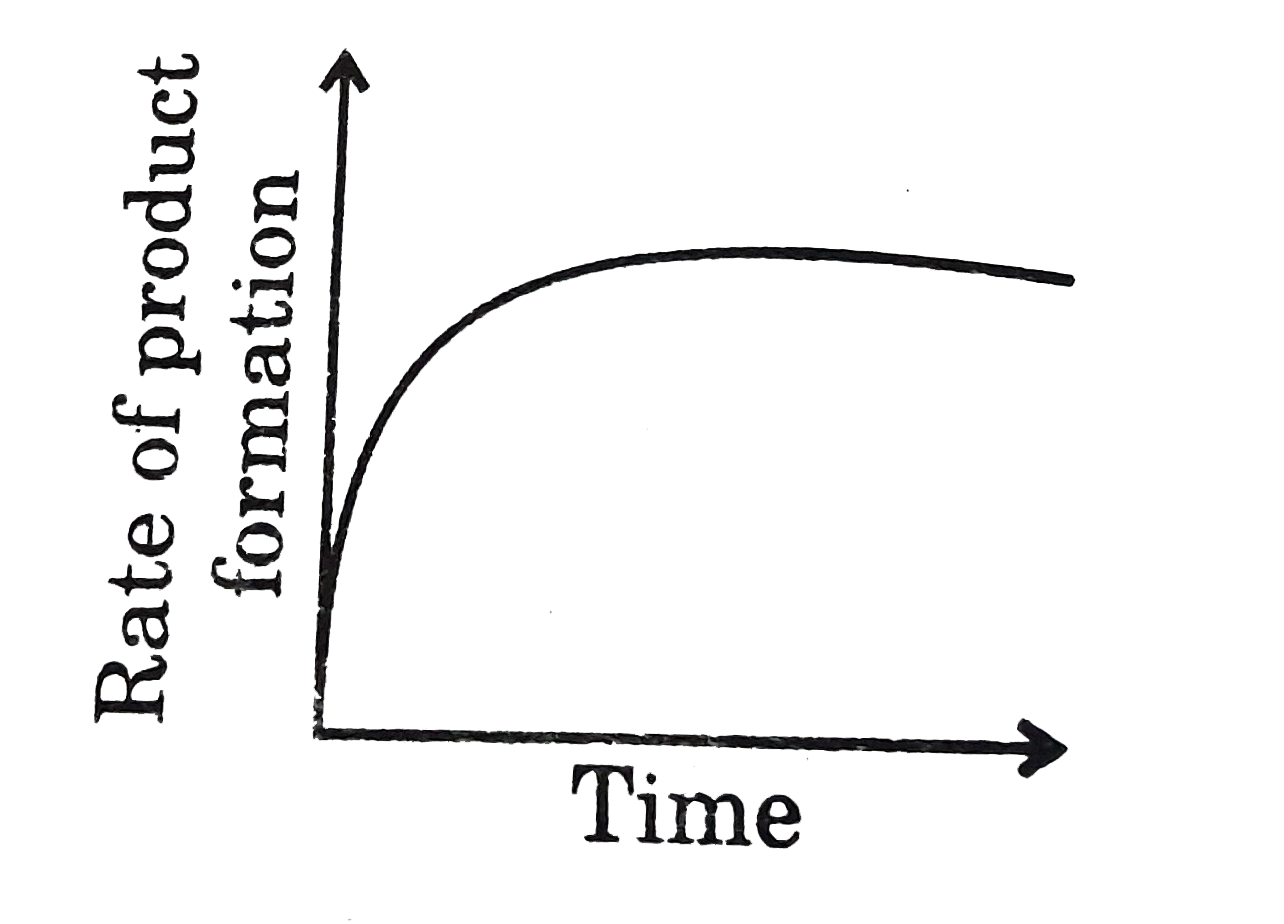
View SolutionThe rates of many substrate reaction catalyzed by enzymes vary with time as account(s) for the constant reaction rate after a certain time ?
(P) The enzyme's active sites are filled.
(Q) The amount of substrate is constant.
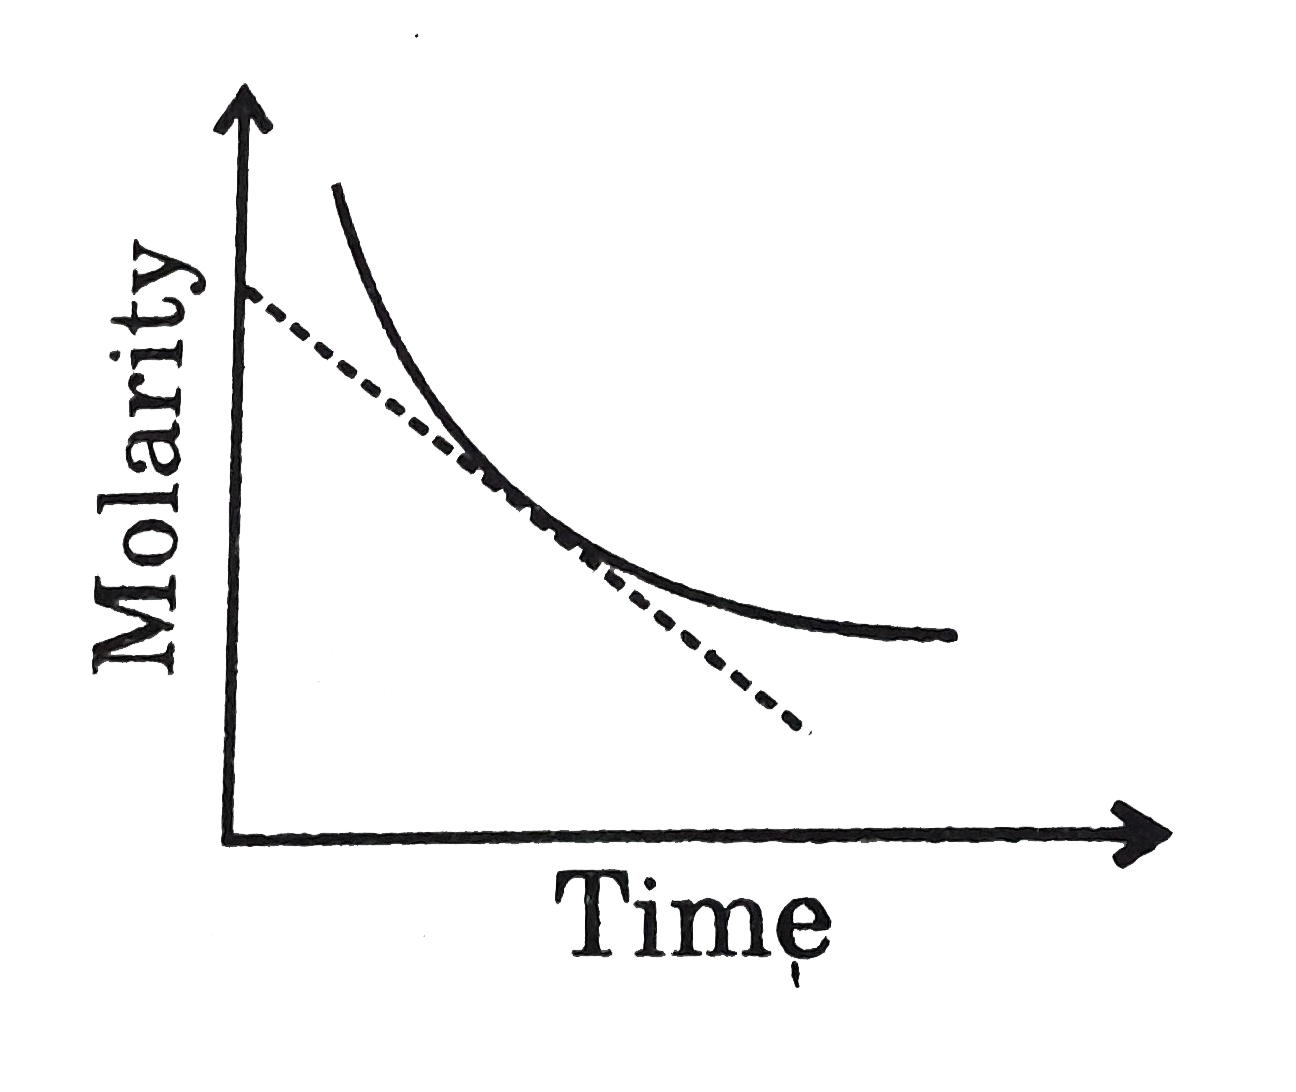
View SolutionWhat quantity is represented by the slope of the dashed line in the accompanying diagram for the concentration change in a reaction ?
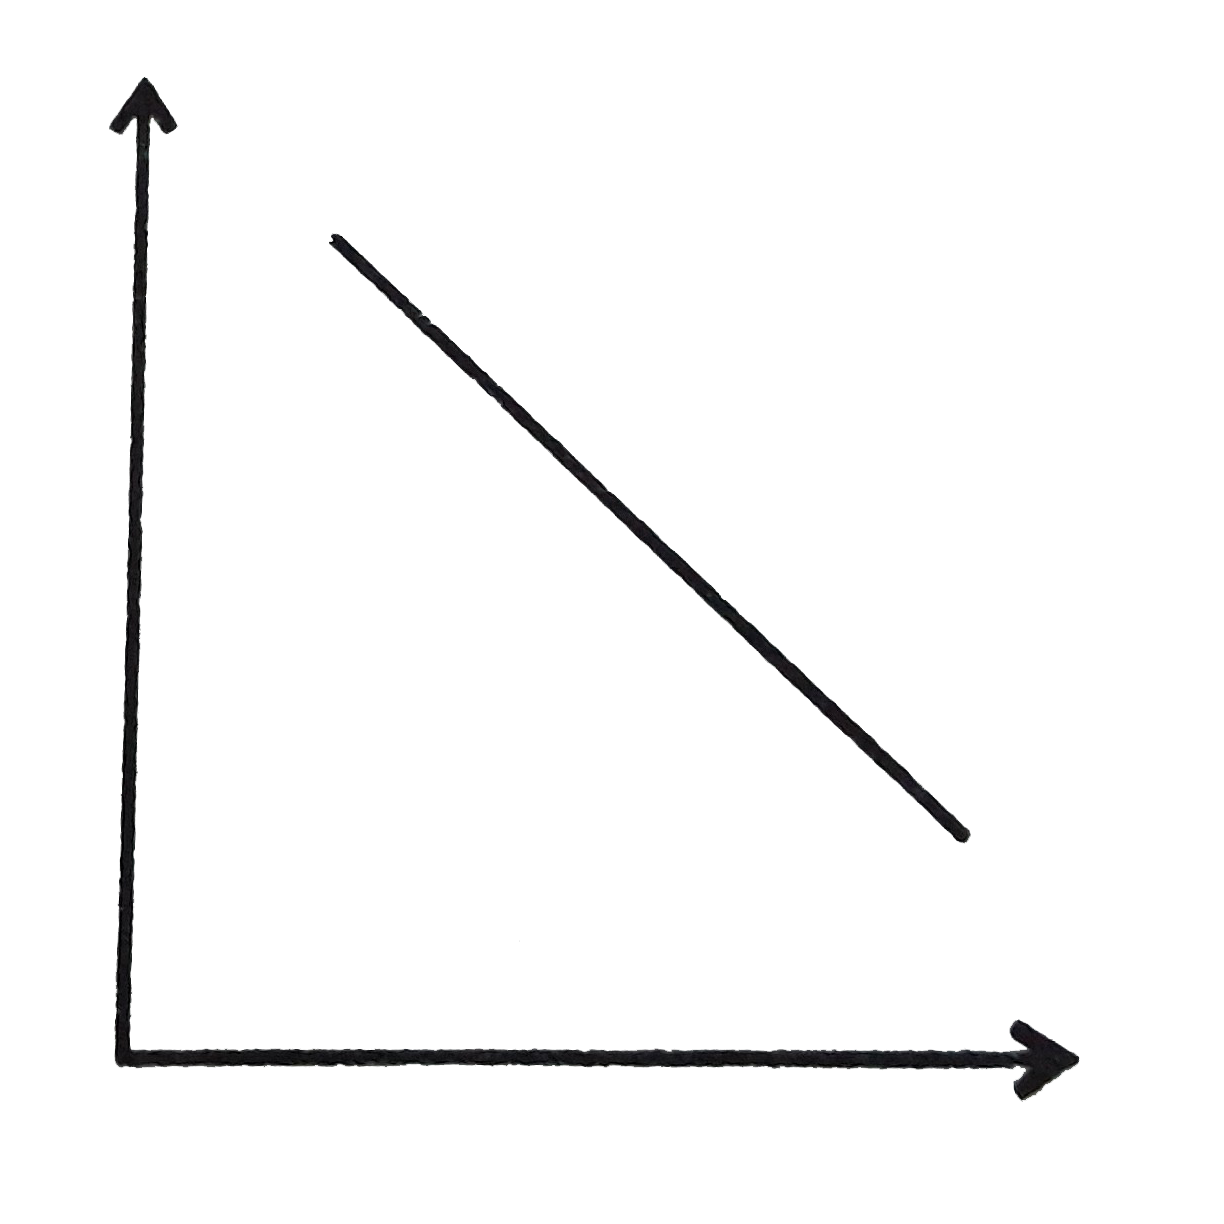
View SolutionA student analyzed tha data from a zero order reaction and obtained the graph shown. What labels should be attached to the X and Y axes, respectively ?
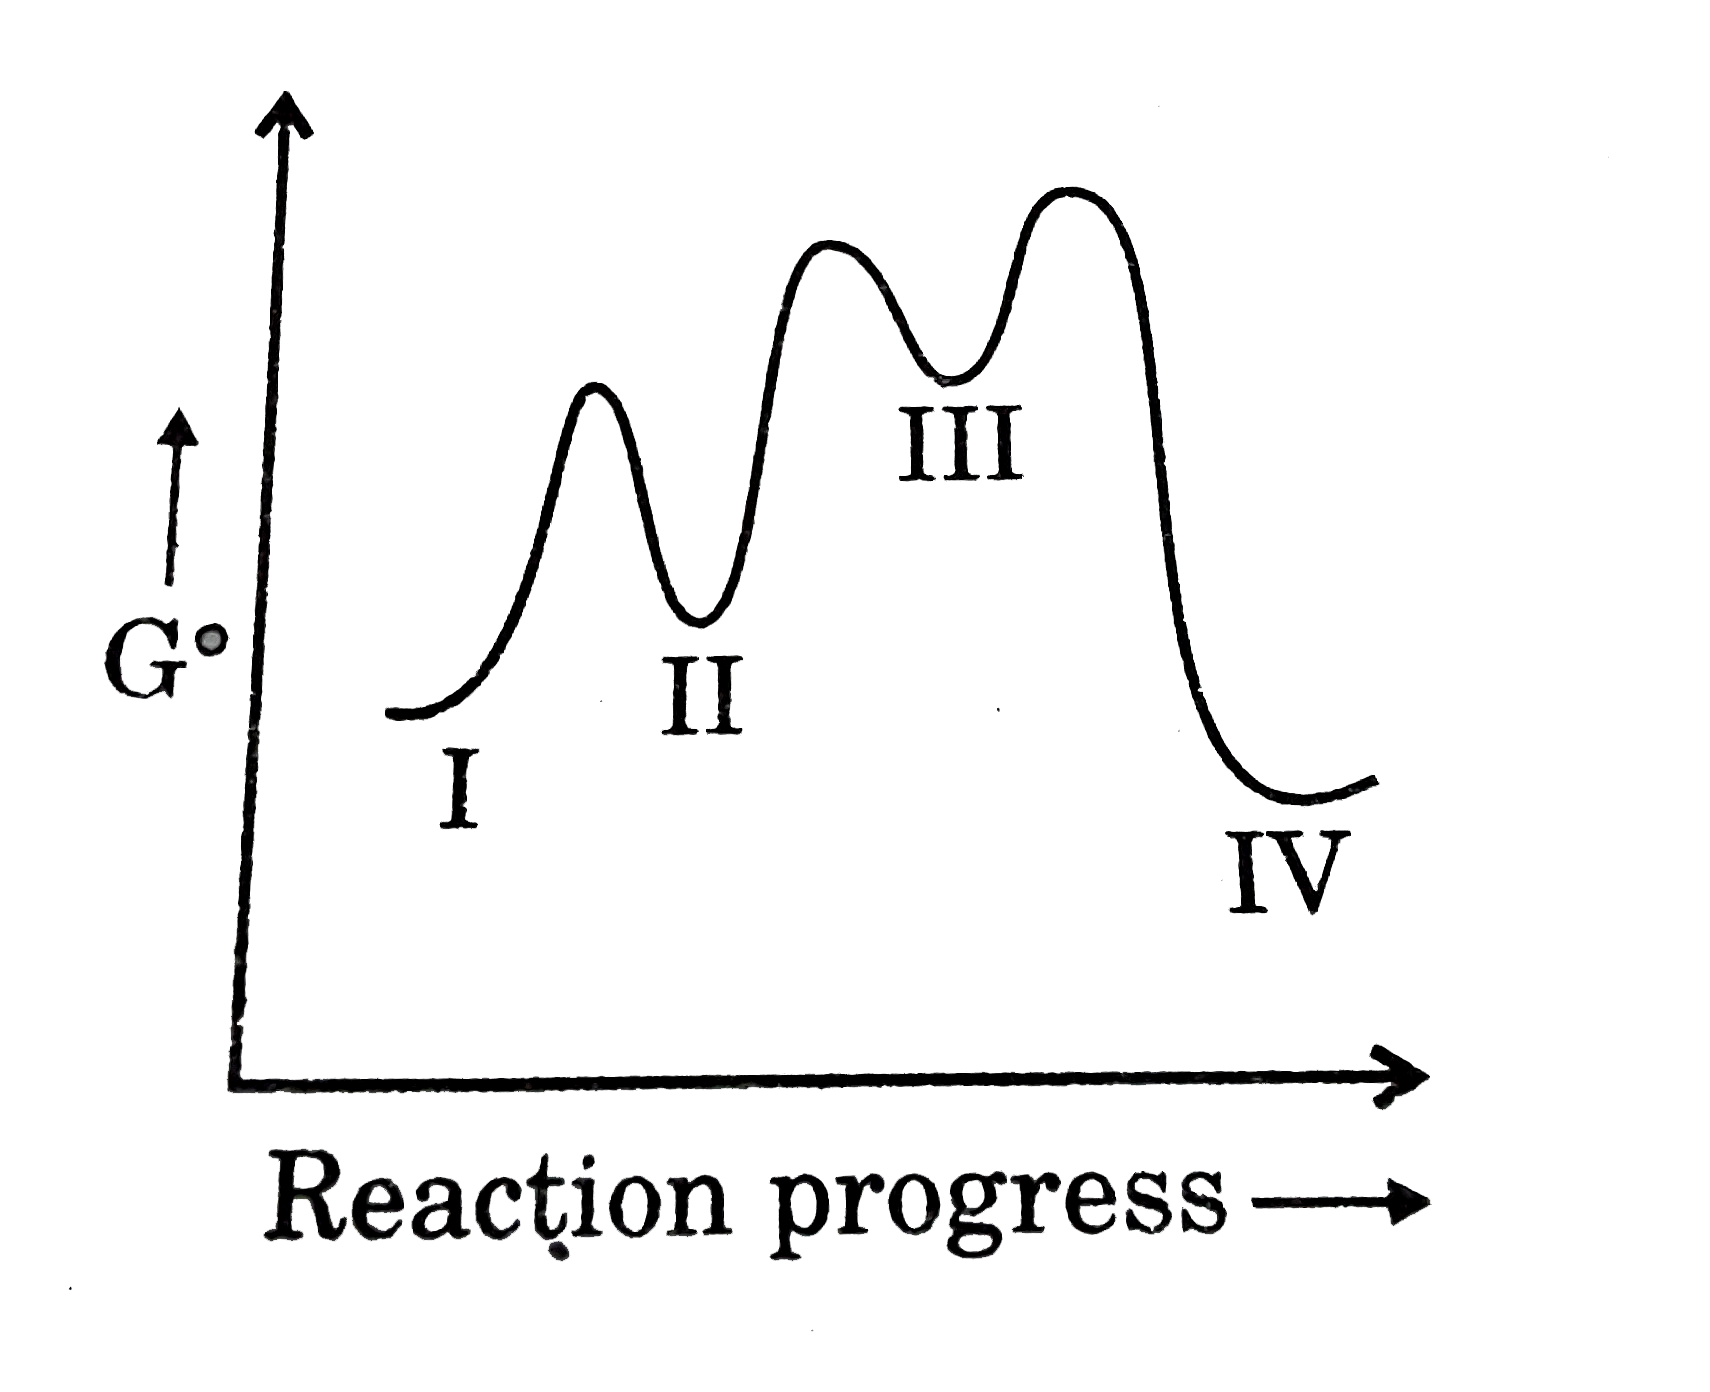
View SolutionAcccording to the reaction profile given, which reaction step is rate-determining in the forward direction ?
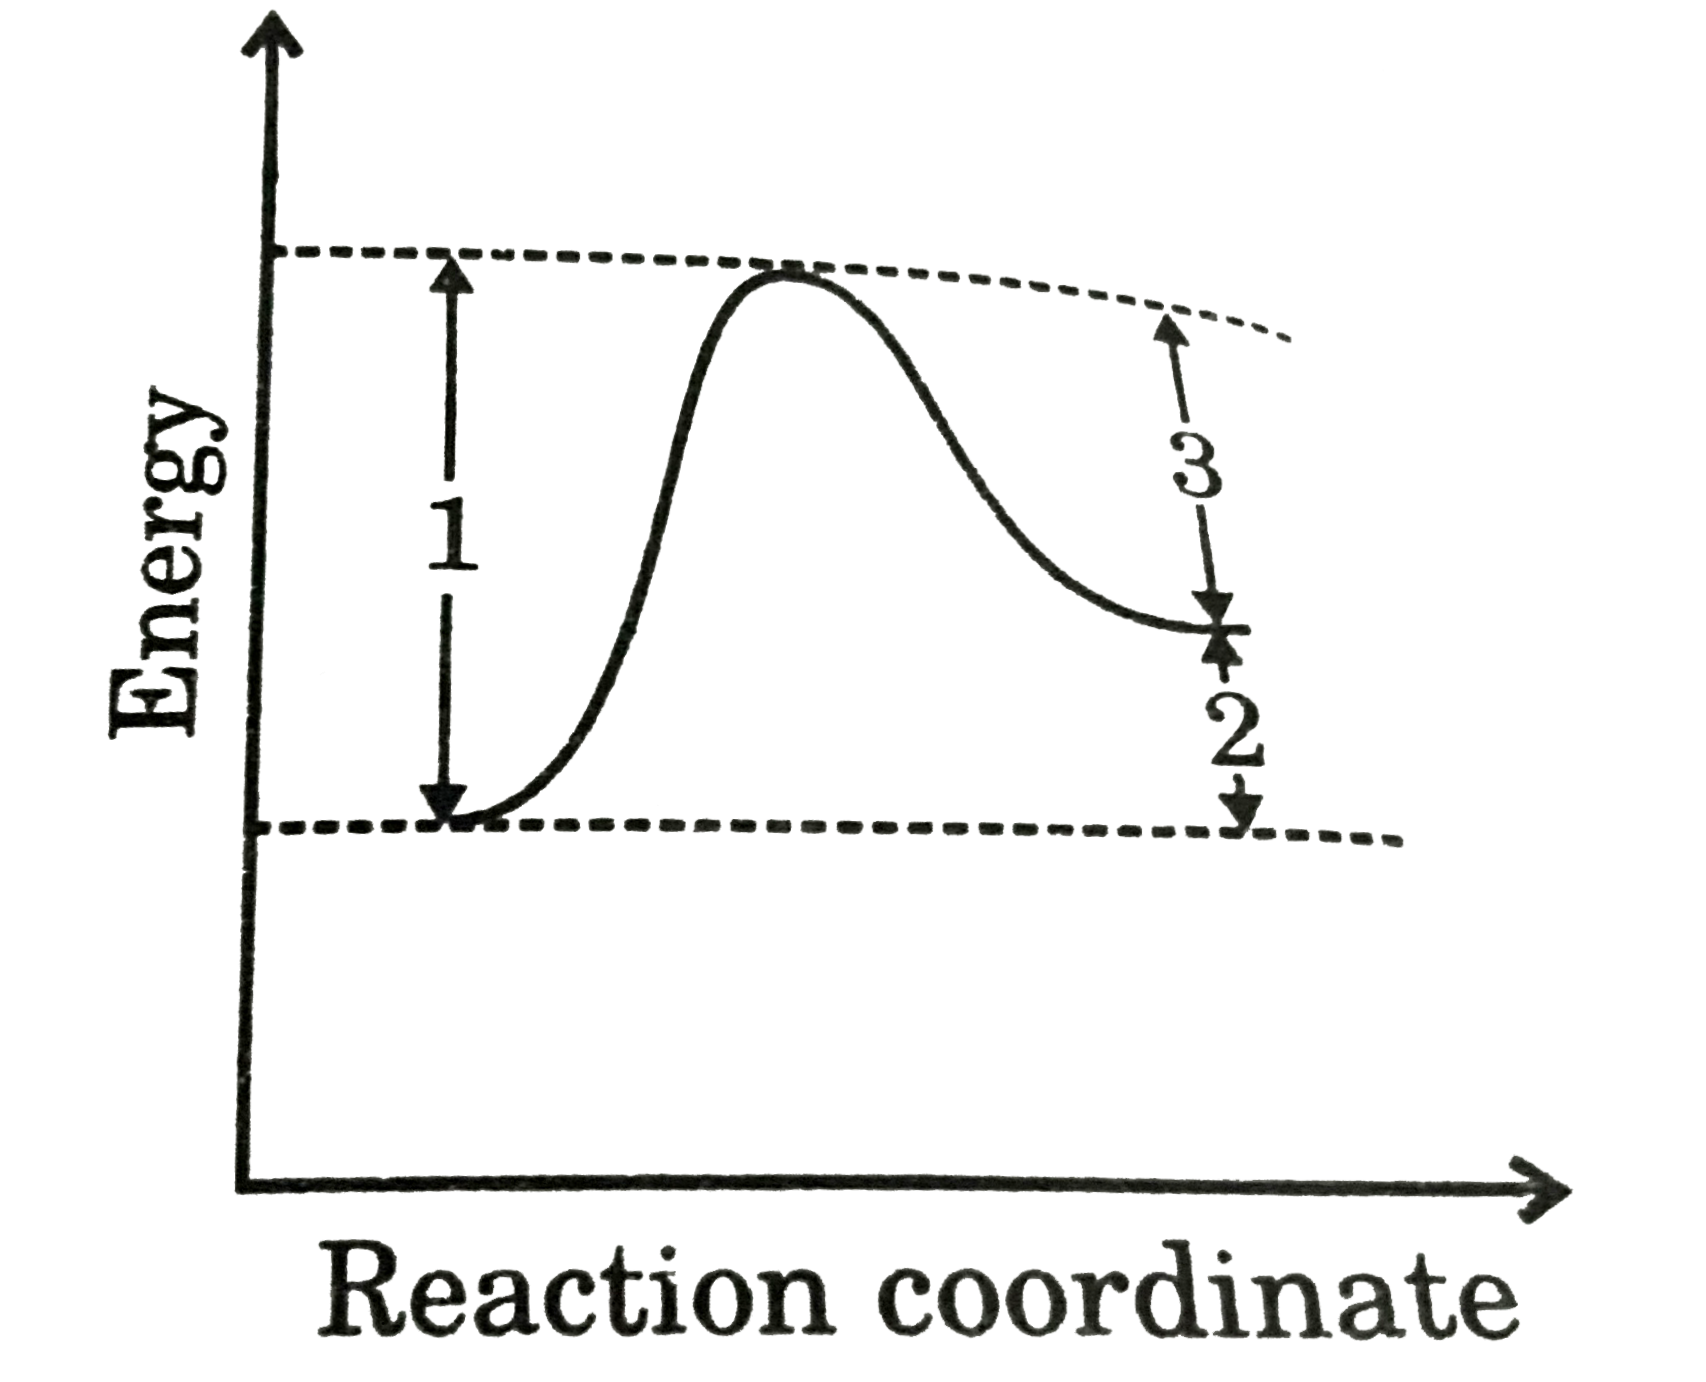
View SolutionWhich dimensions in the diagram can be charged.
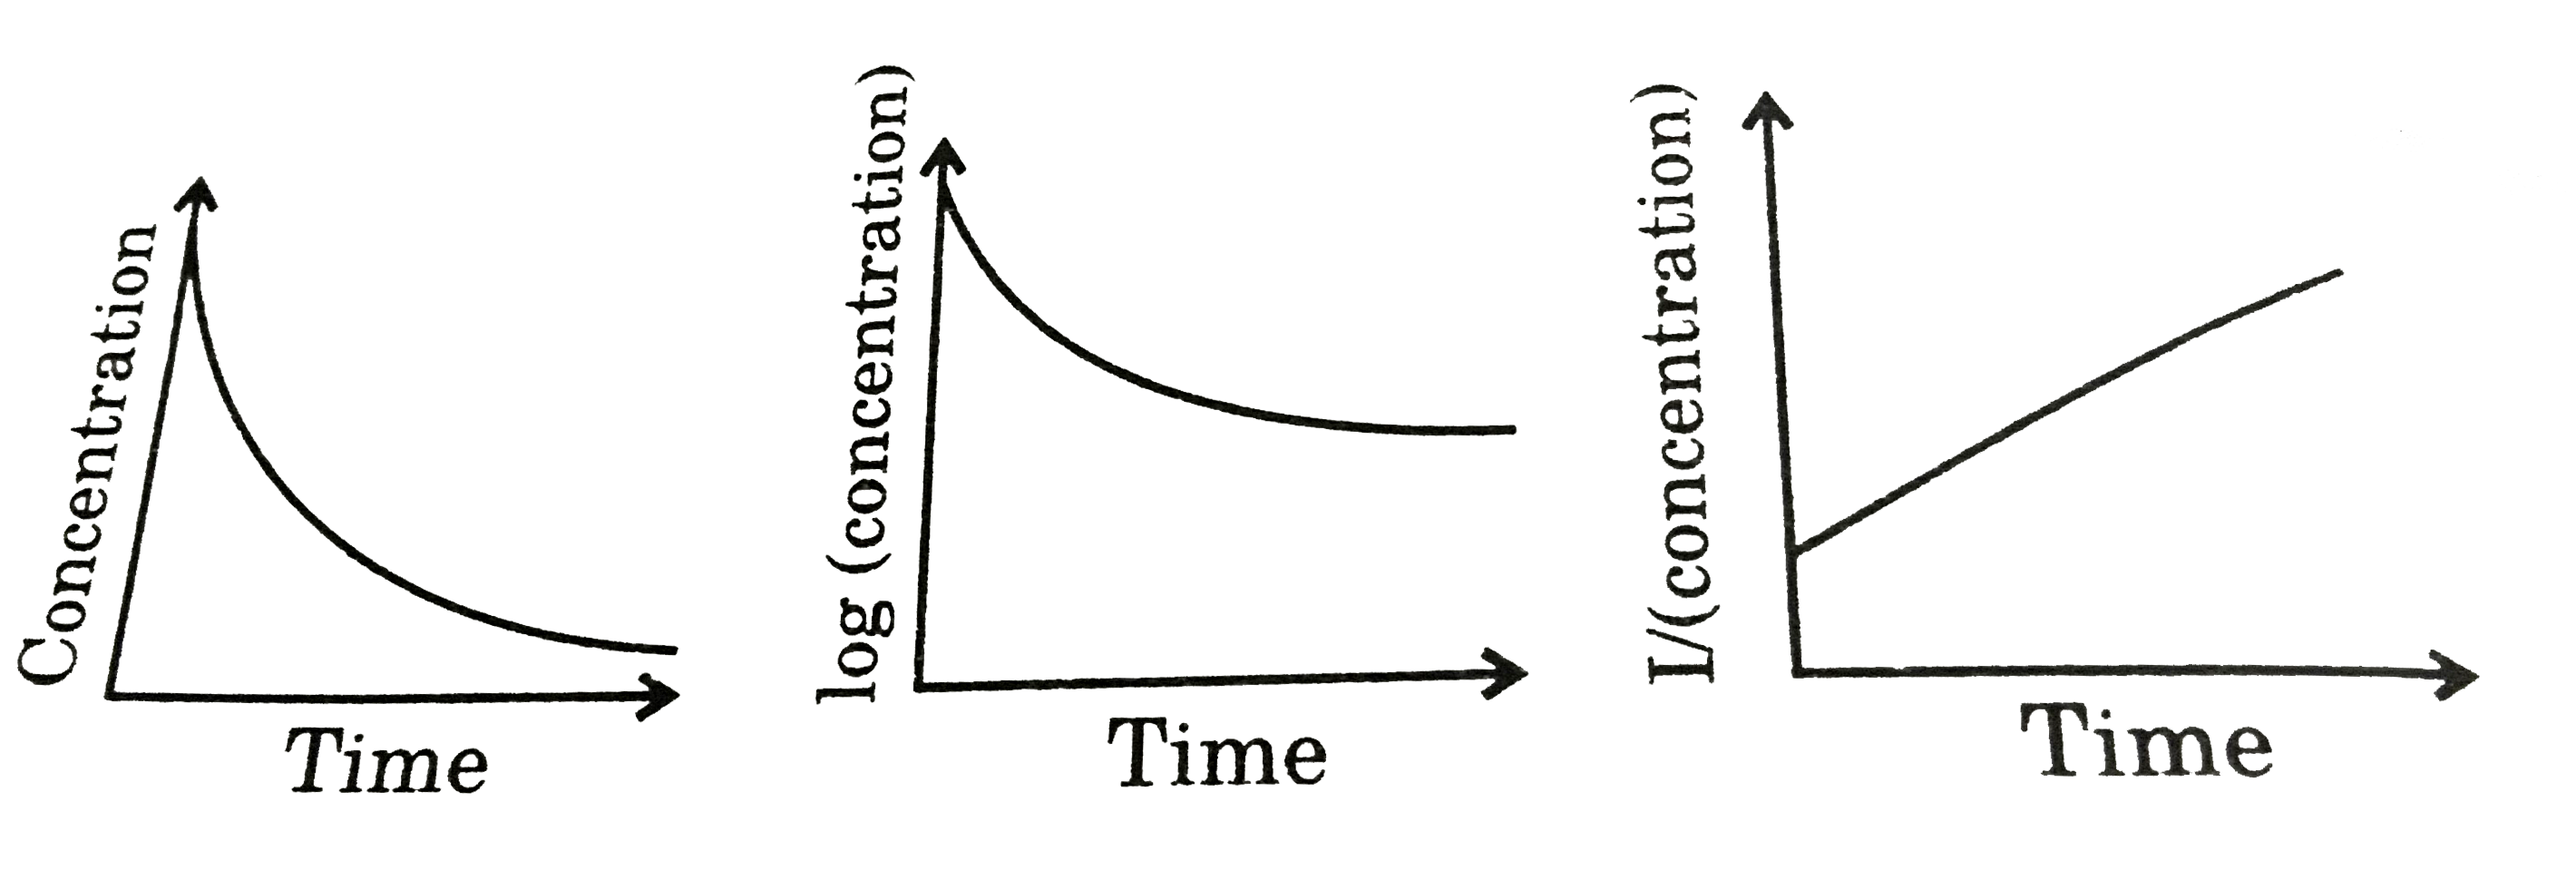
View SolutionWhat is the order of a reaction that produces the graphs shown ?
View SolutionAccording to the Arrhenius equation
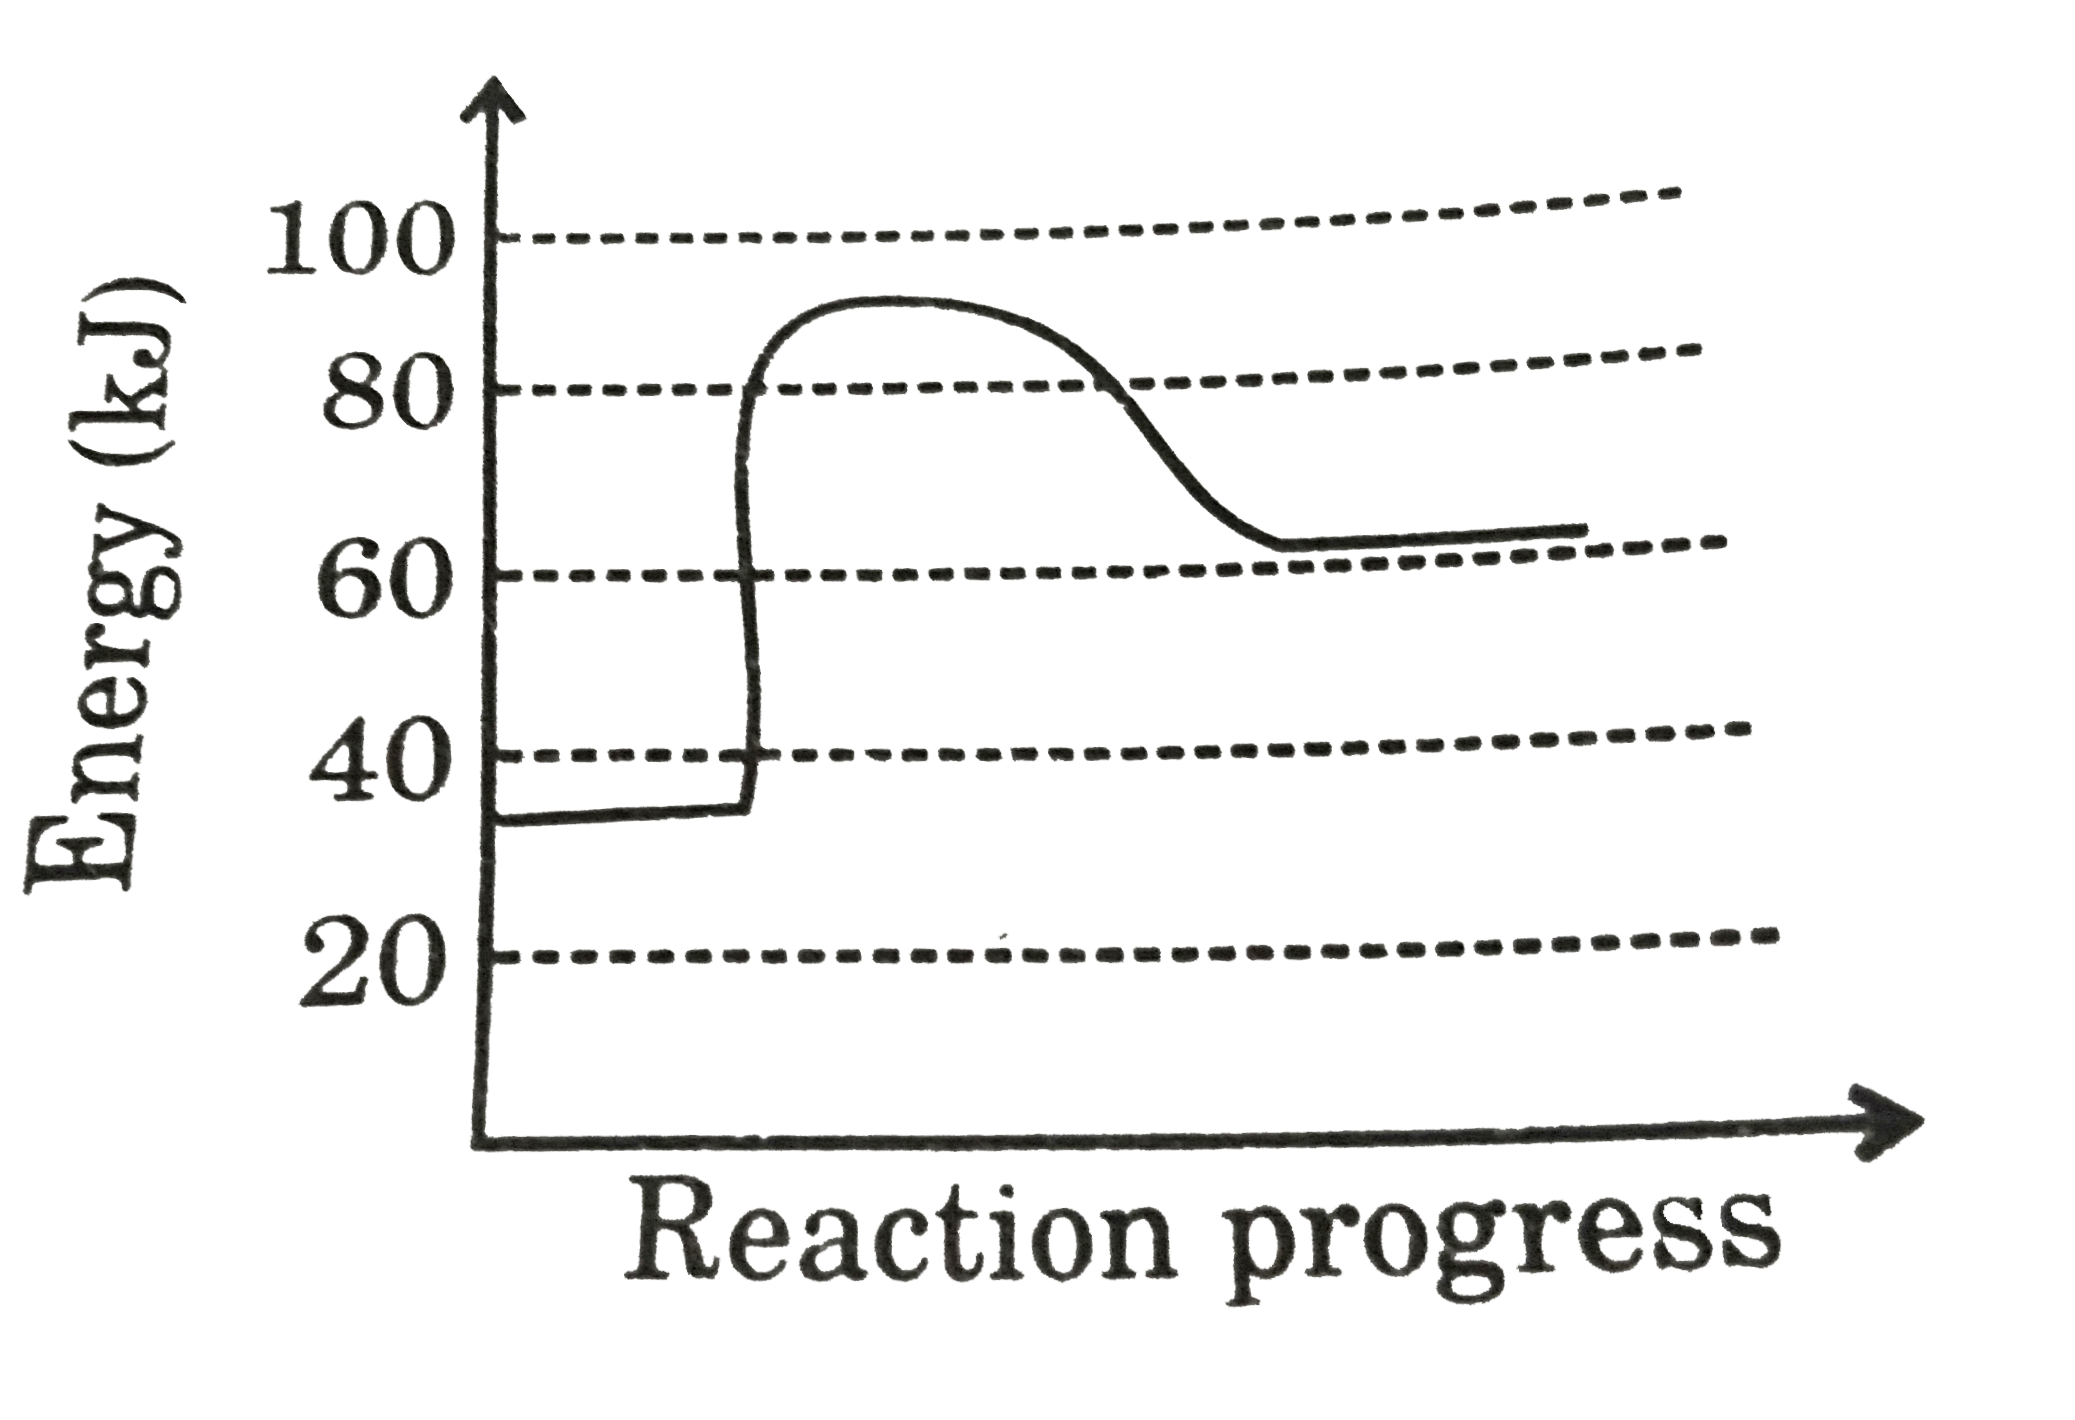
View SolutionAdjoining diagram, represents the energy profile for the reaction :
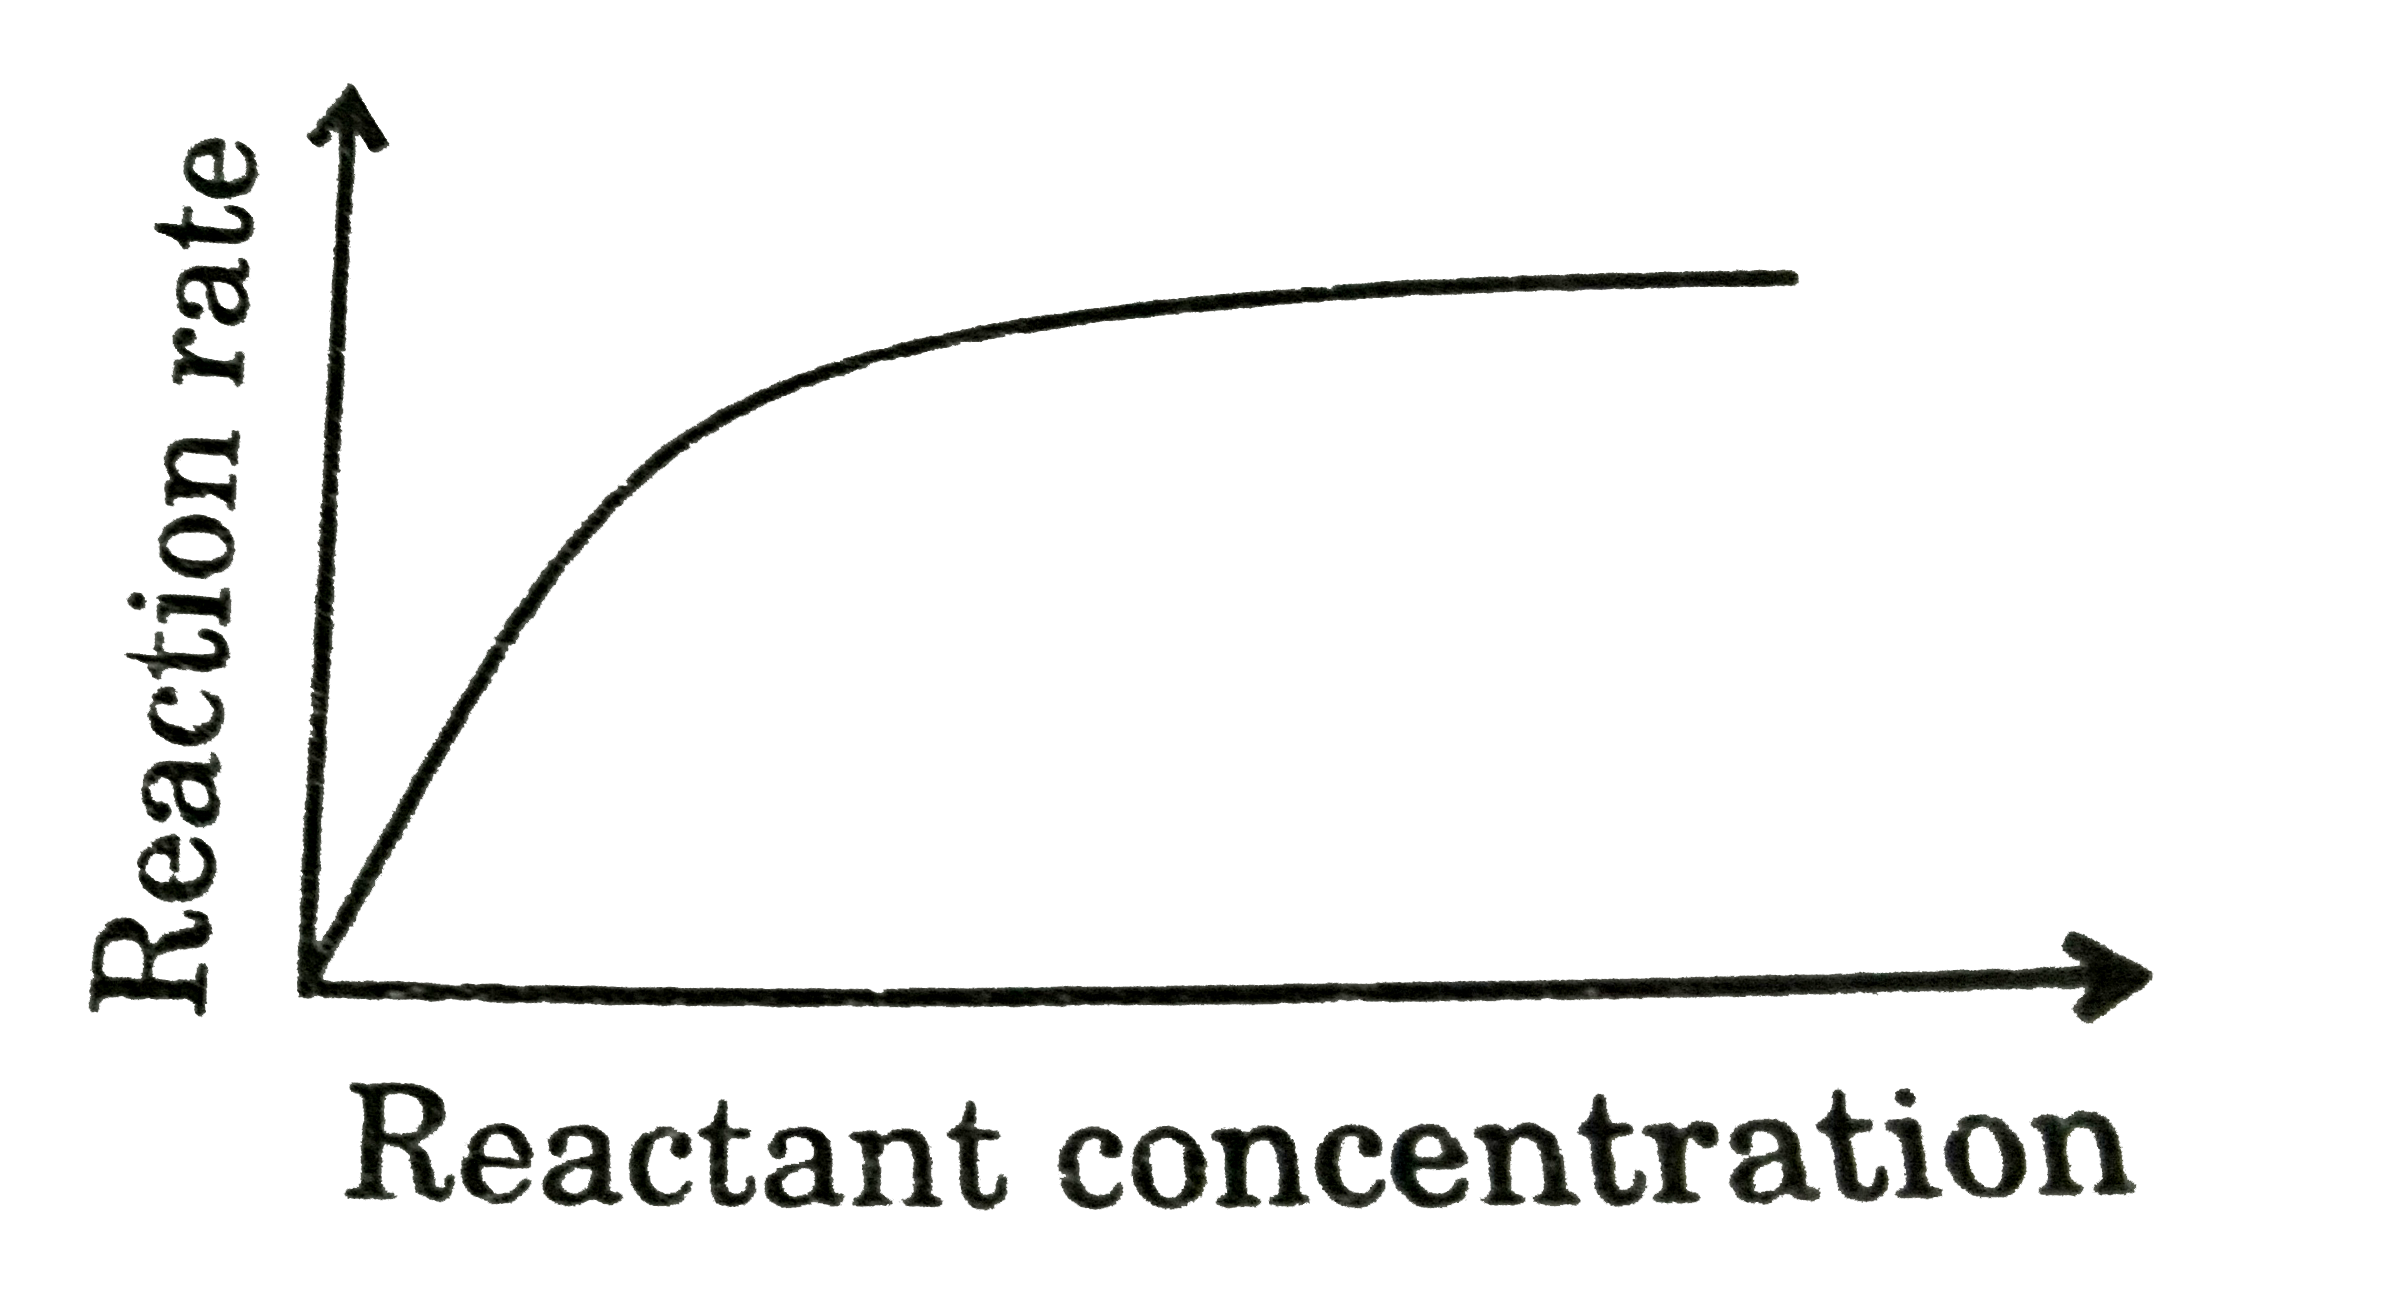
View SolutionCurves with the shape shown are often observed for reactions involving catalysts. The level portion of the curve is best attributed to the fact that:
View SolutionWhich straight line gives the activation energy for a reaction?
View SolutionA reaction follows the given concentration

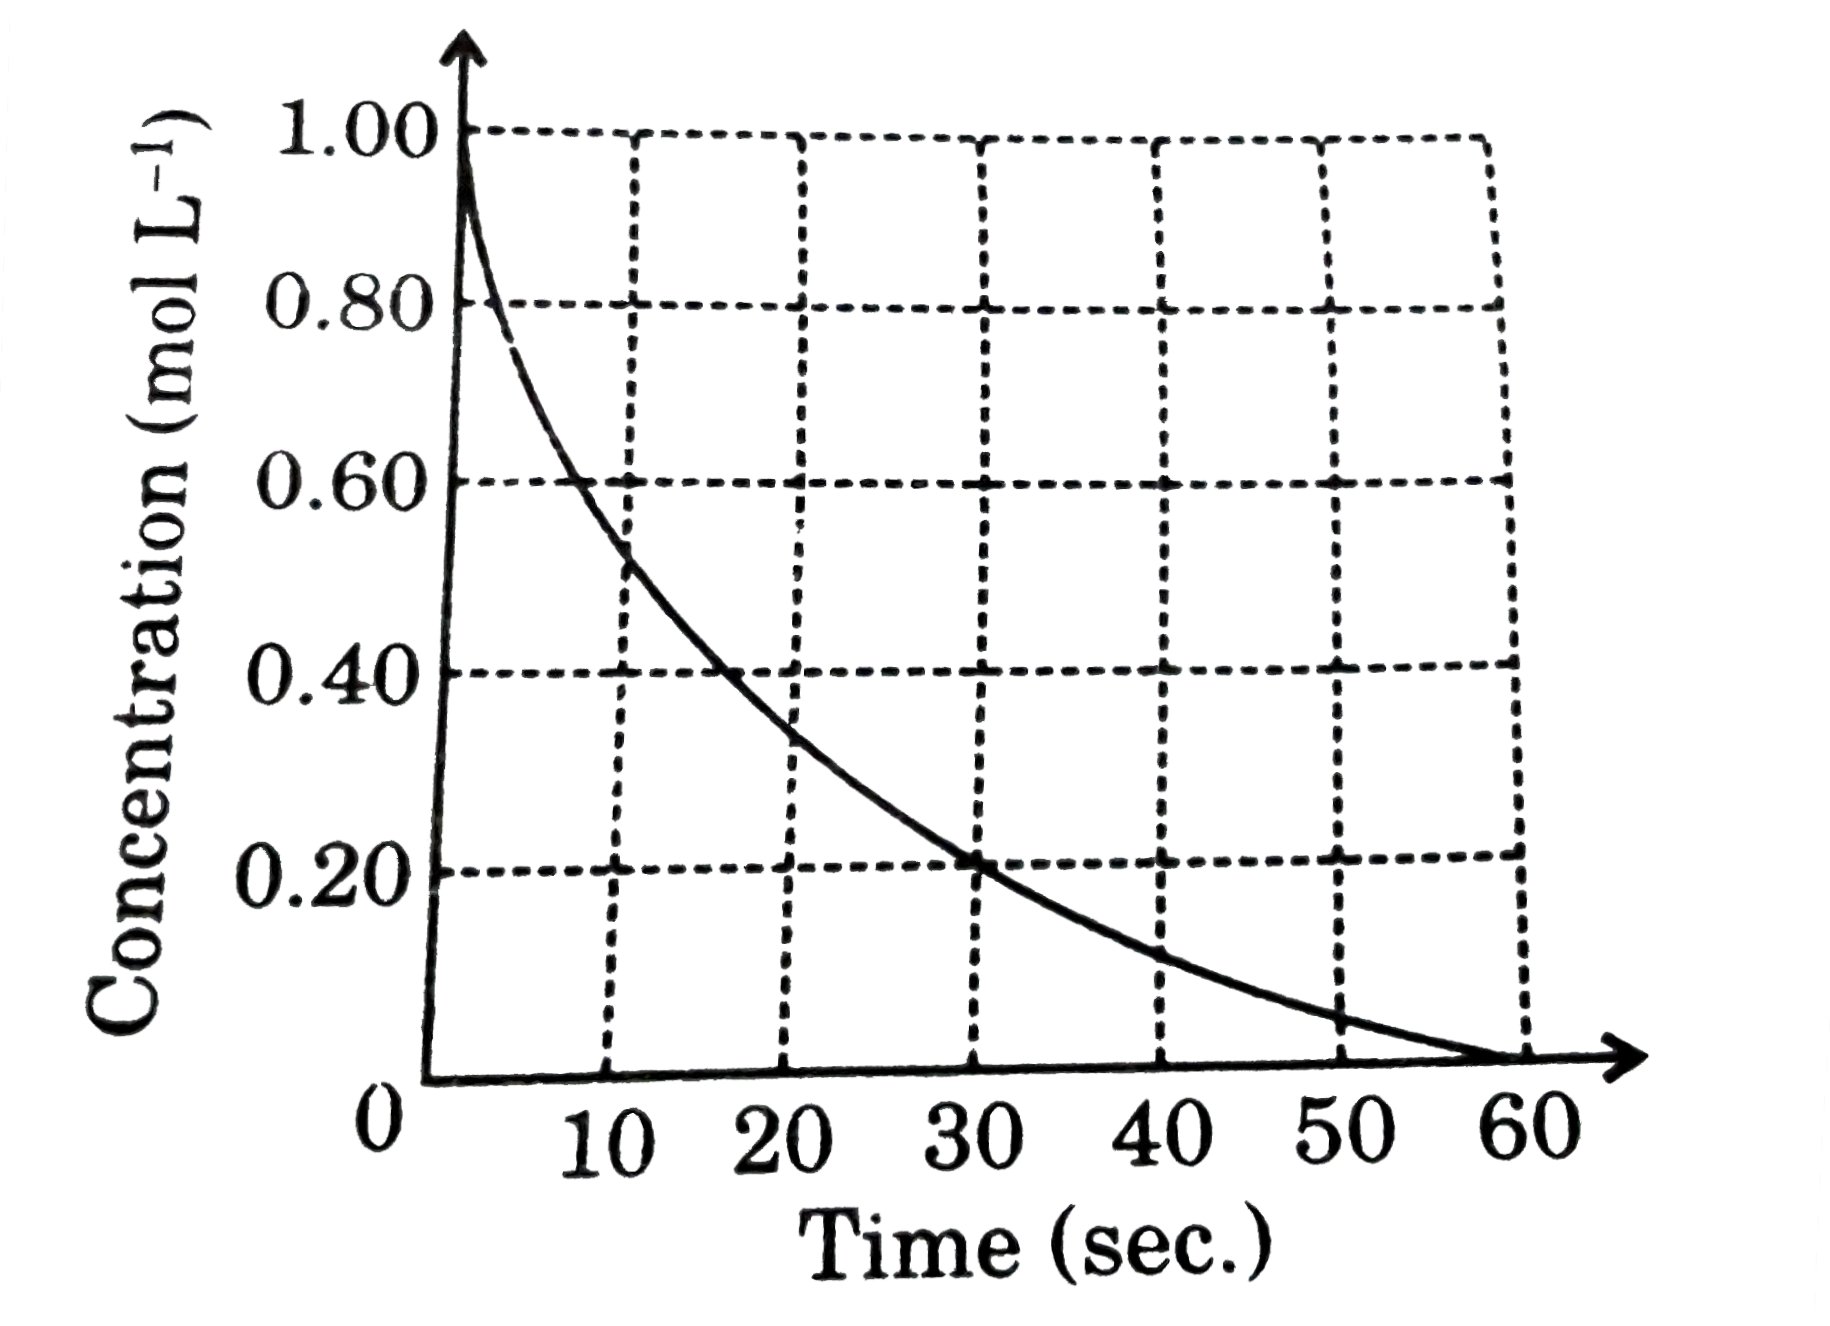
View SolutionAccording to the graph what is the rate of disappearance of the reactant at 10 seconds ?
View SolutionIn the graph the natural log of the vapour pressures of two substances are plotted vs 1/T. what can be concluded about the relative the 1/T enthalpies of vaporization
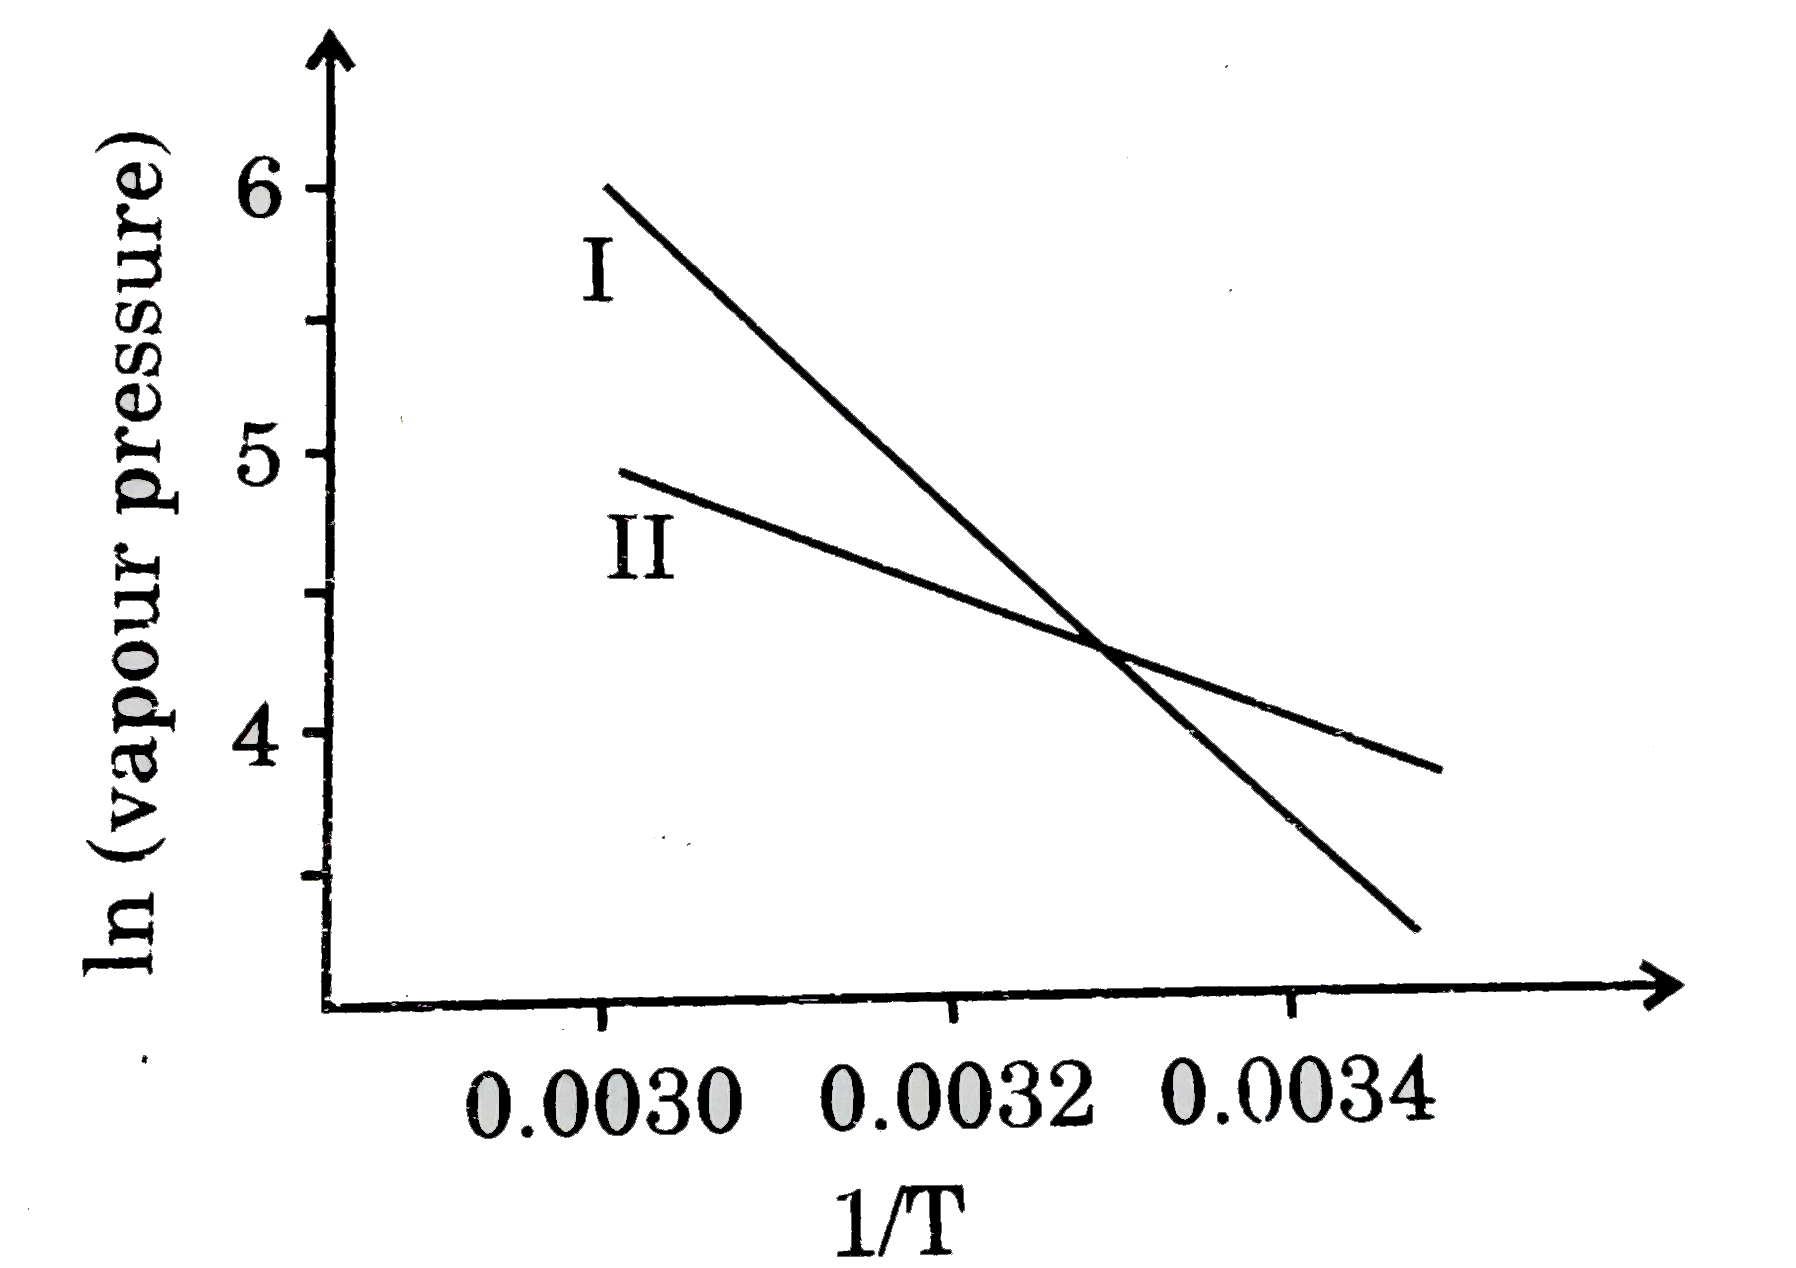
View Solution
Chemical Kinetics questions and complete solutions for chapter GRAPHICAL INTERPRETATION of GRB CHEMISTRY (HINGLISH) of Class 12
All Exercises from GRB PUBLICATION Class 12 CHEMISTRY GRAPHICAL INTERPRETATION
- A. Thermodynamics
- Atomic Sturcture
- B. Gaseous State
- C. Atomic Sturcture
- Chemical Equilibrium
- Chemical Kinetics
- Comprehension
- Comprehension 1
- Comprehension 10
- Comprehension 11
- Comprehension 12
- Comprehension 13
- Comprehension 14
- Comprehension 15
- Comprehension 16
- Comprehension 17
- Comprehension 18
- Comprehension 19
- Comprehension 2
- Comprehension 20
- Comprehension 21
- Comprehension 22
- Comprehension 23
- Comprehension 24
- Comprehension 25
- Comprehension 26
- Comprehension 27
- Comprehension 28
- Comprehension 29
- Comprehension 3
- Comprehension 4
- Comprehension 5
- Comprehension 6
- Comprehension 7
- Comprehension 8
- Comprehension 9
- D. Liquid Solutions
- E. Surface Chemistry
- Electrochemistry
- F. Ionic Equilibrium
- G. Chemical Equilibrium
- Gaseous State
- H. Chemical Kinetics
- I.Electrochemistry
- Ionic Equilibrium
- Liquid Solutions
- Match The Column Type
- Multiple Objective Type
- Subjective Type
- Surface Chemistry
- Thermodynamics