Complete Solutions to Ionic Equilibrium of chapter GRAPHICAL INTERPRETATION of Class 12 book with complete answers and questions
| Class 12 | CHEMISTRY |
| Chapter | GRAPHICAL INTERPRETATION |
| GRB PUBLICATION | Ionic Equilibrium |
| Number Of Questions | 8 |
| Academic Year | 2023-24 |
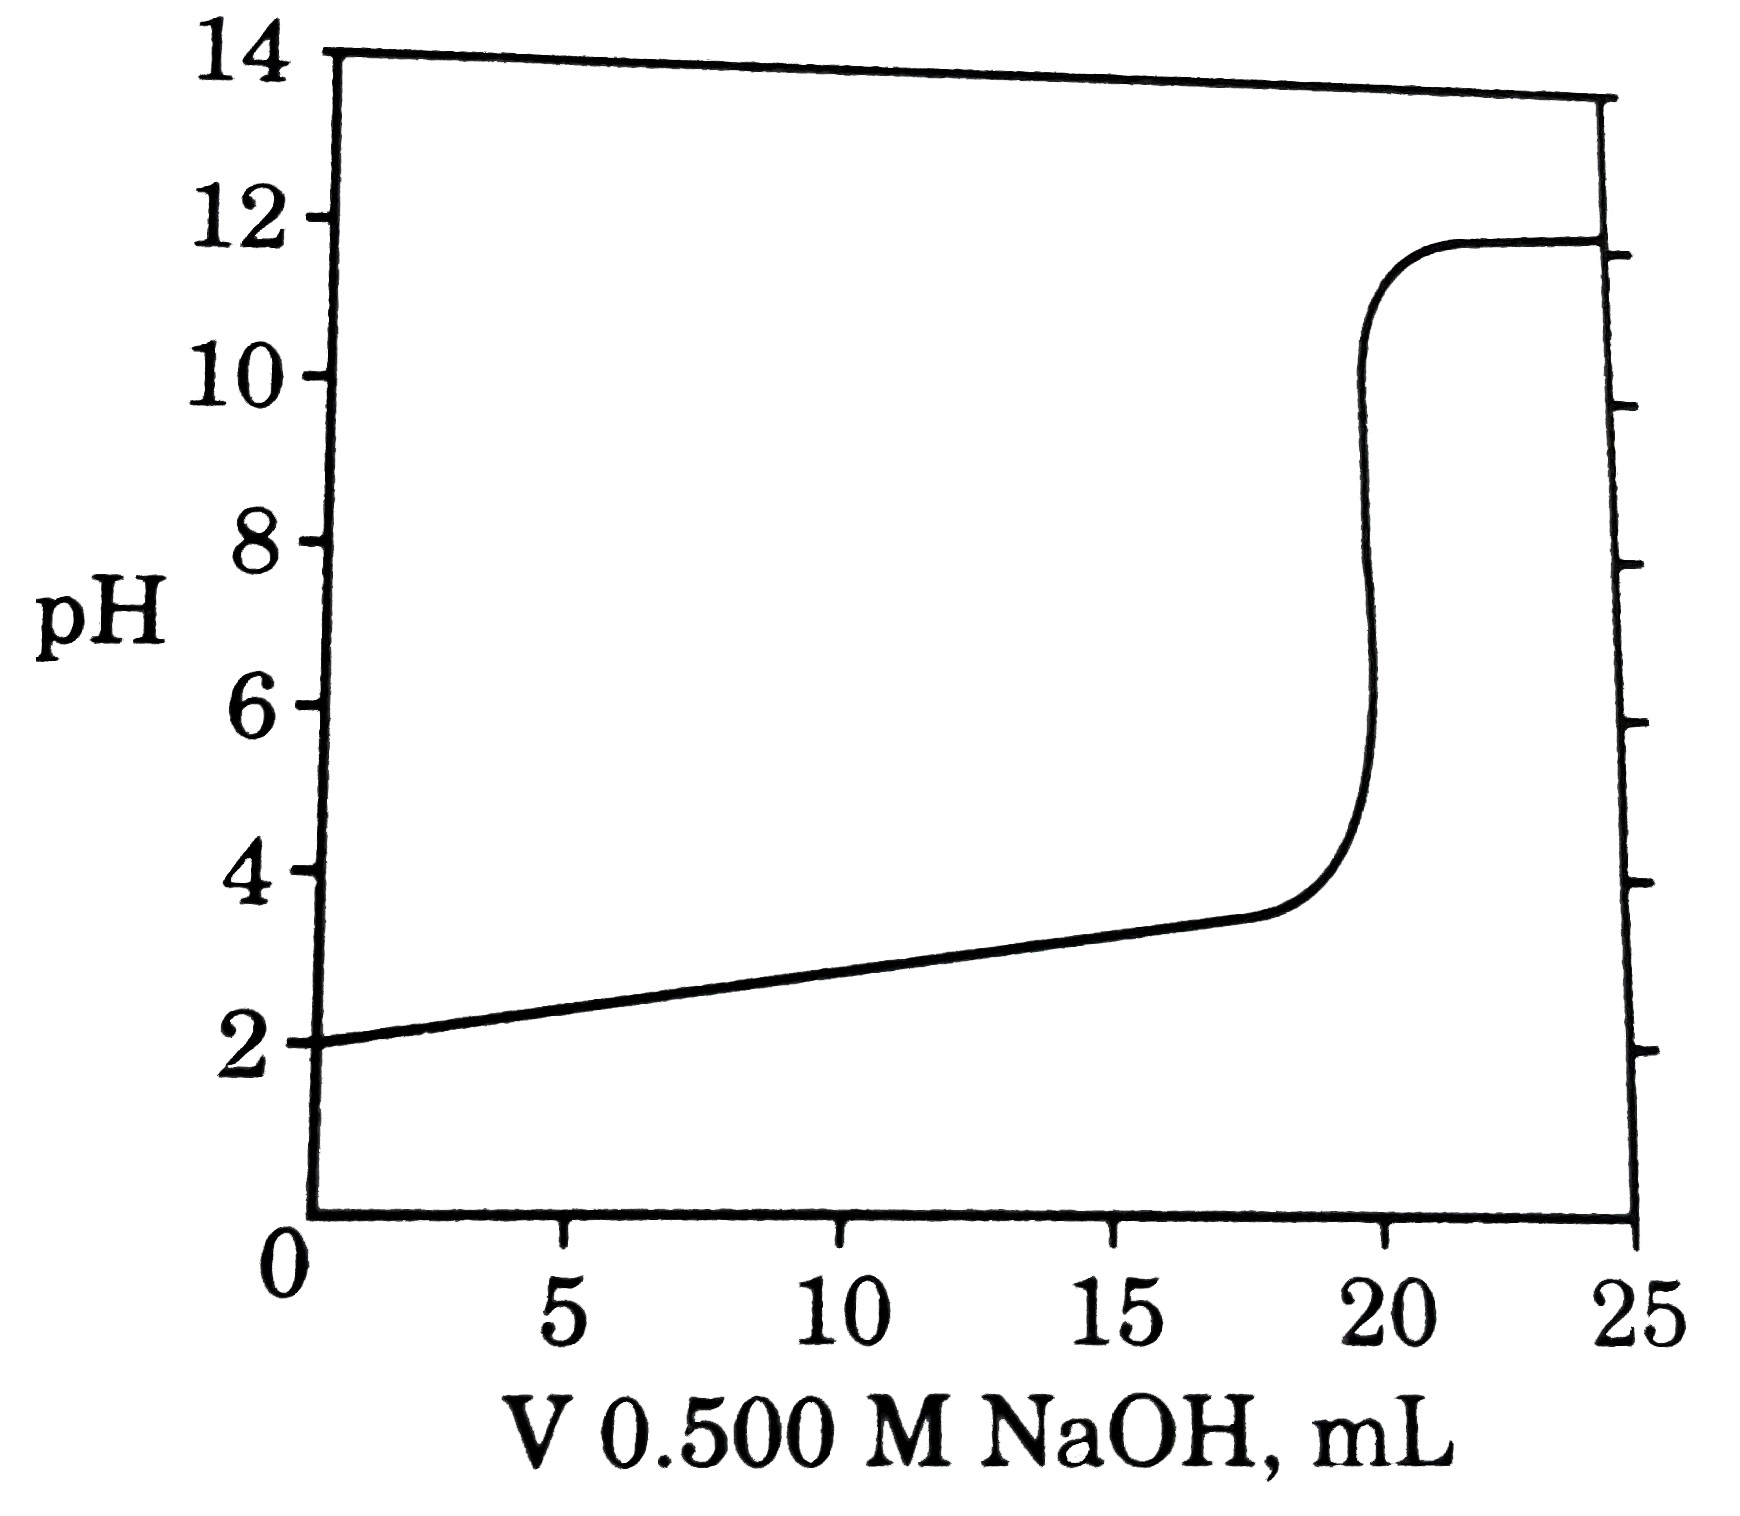
A sample of 100 mL of a solution of a weak monoprotic acid of unknown concentration is titrated with `0.500 M NaOH` to give the titration curve shown. All of the statements are correct except:
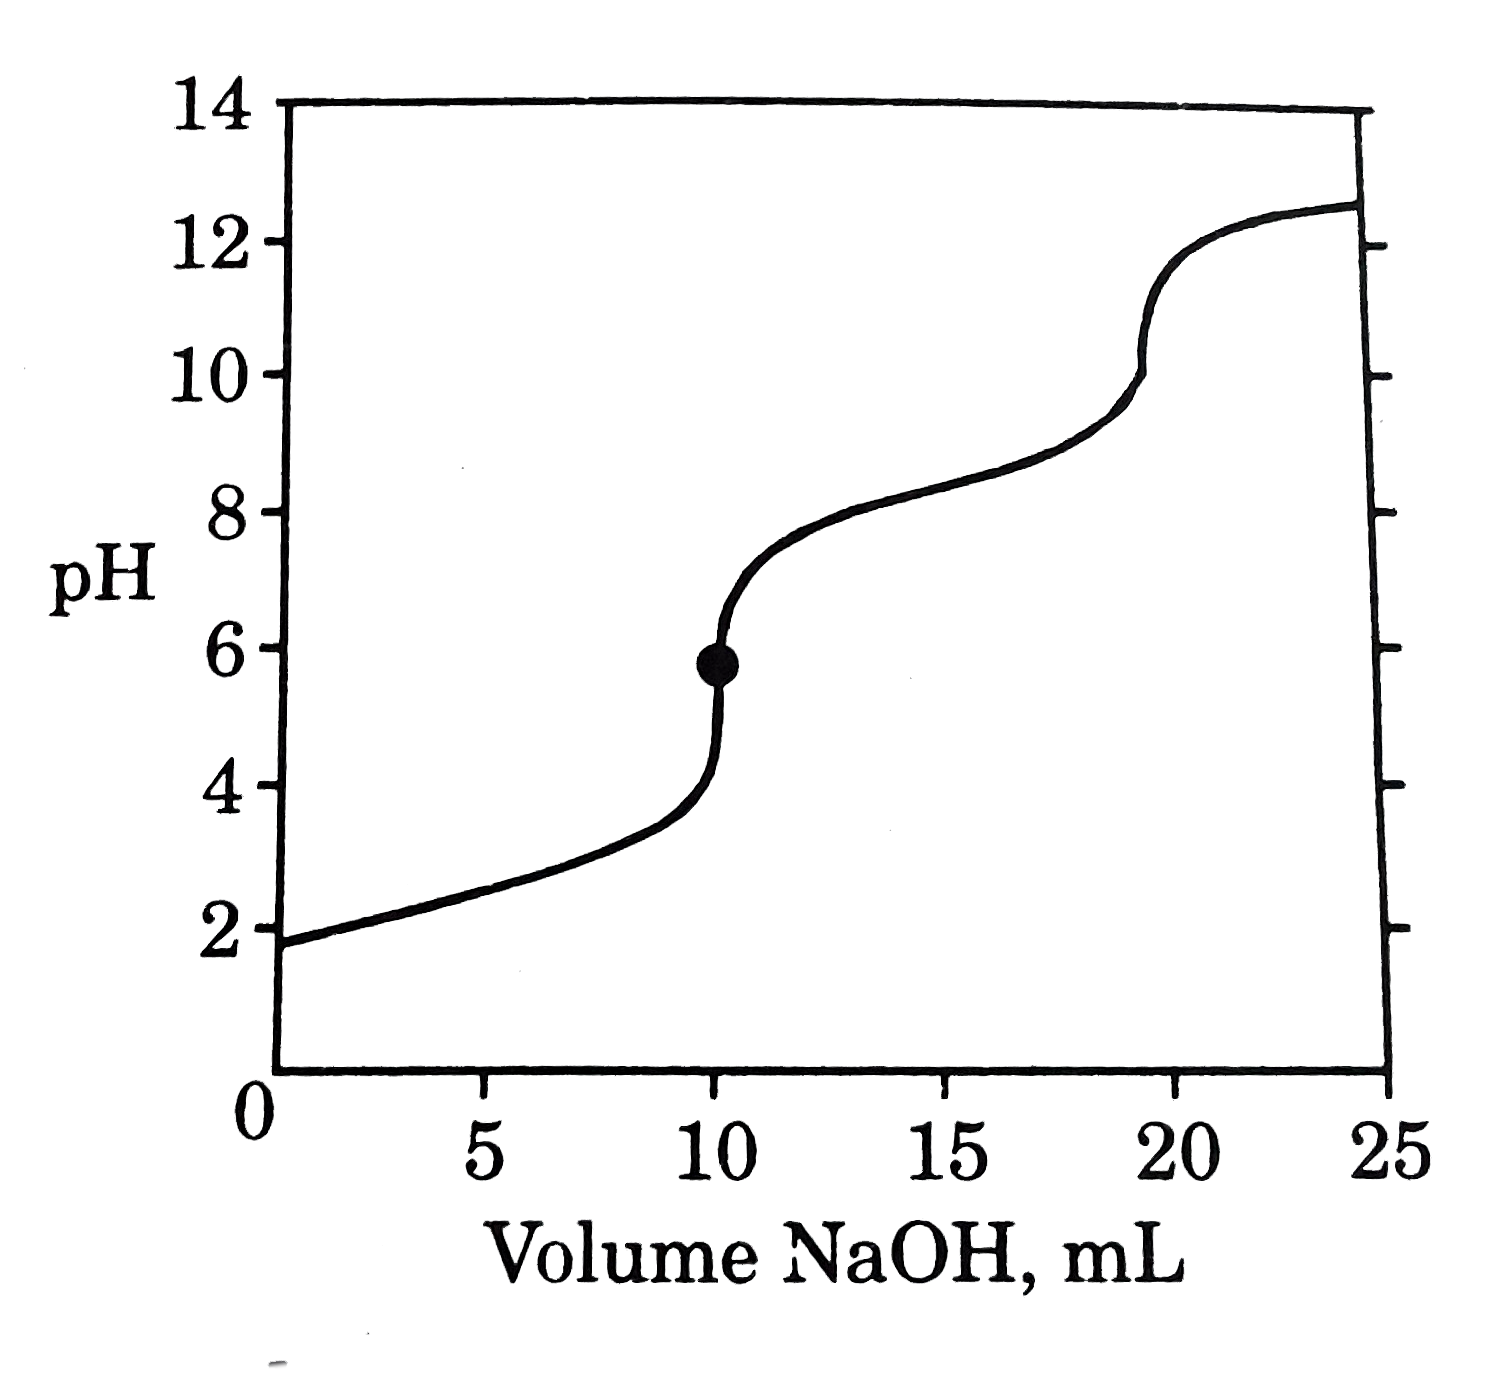
View SolutionA `0.100M` aqueous solution of `H_(2)SeO_(3)` is titrated with `1.000M NaOH` solution. At the point marked with a circle on the titration curve, which species represent at least `10%` of the total selenium in solution ?
View SolutionA buffer solution is prepared by mixing 'a' moles of `CH_(3)COONa` and 'b' moles of `CH_(3)COOH` such that `(a+b) = 1`, into water to male 1L buffer solution. If the buffer capacity of this buffer solution is plotted against moles of salt `CH_(3)COONa` 'a' then the plot obtained will be (to the scale) approximately. (As shown in fig. in options)
View SolutionWhich is/are correct statements ?
(P) In any strong acid's solution, the concentration of `[OH^(-)]` will be zero.
(Q) If `DeltaG^(@)` of a reaction is positive, then the reaction will not proceed at all in the forward direction for any concentrations of reactants and products.
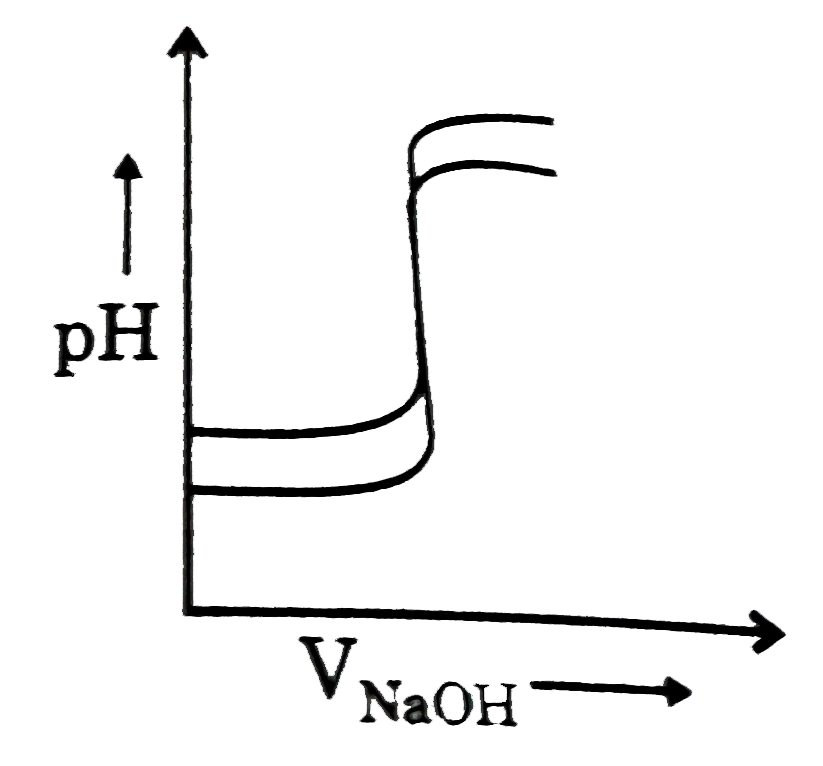
(R) Titration curves are drawn for (about the fig. shown)
(i) `1M HCI` (50 mL) with `1M NaOH` and
(ii) `0.01M HCI (50 mL)` with `0.01M NaOH` on the same graph paper they look like:
View SolutionWhich is/are correct statement ?
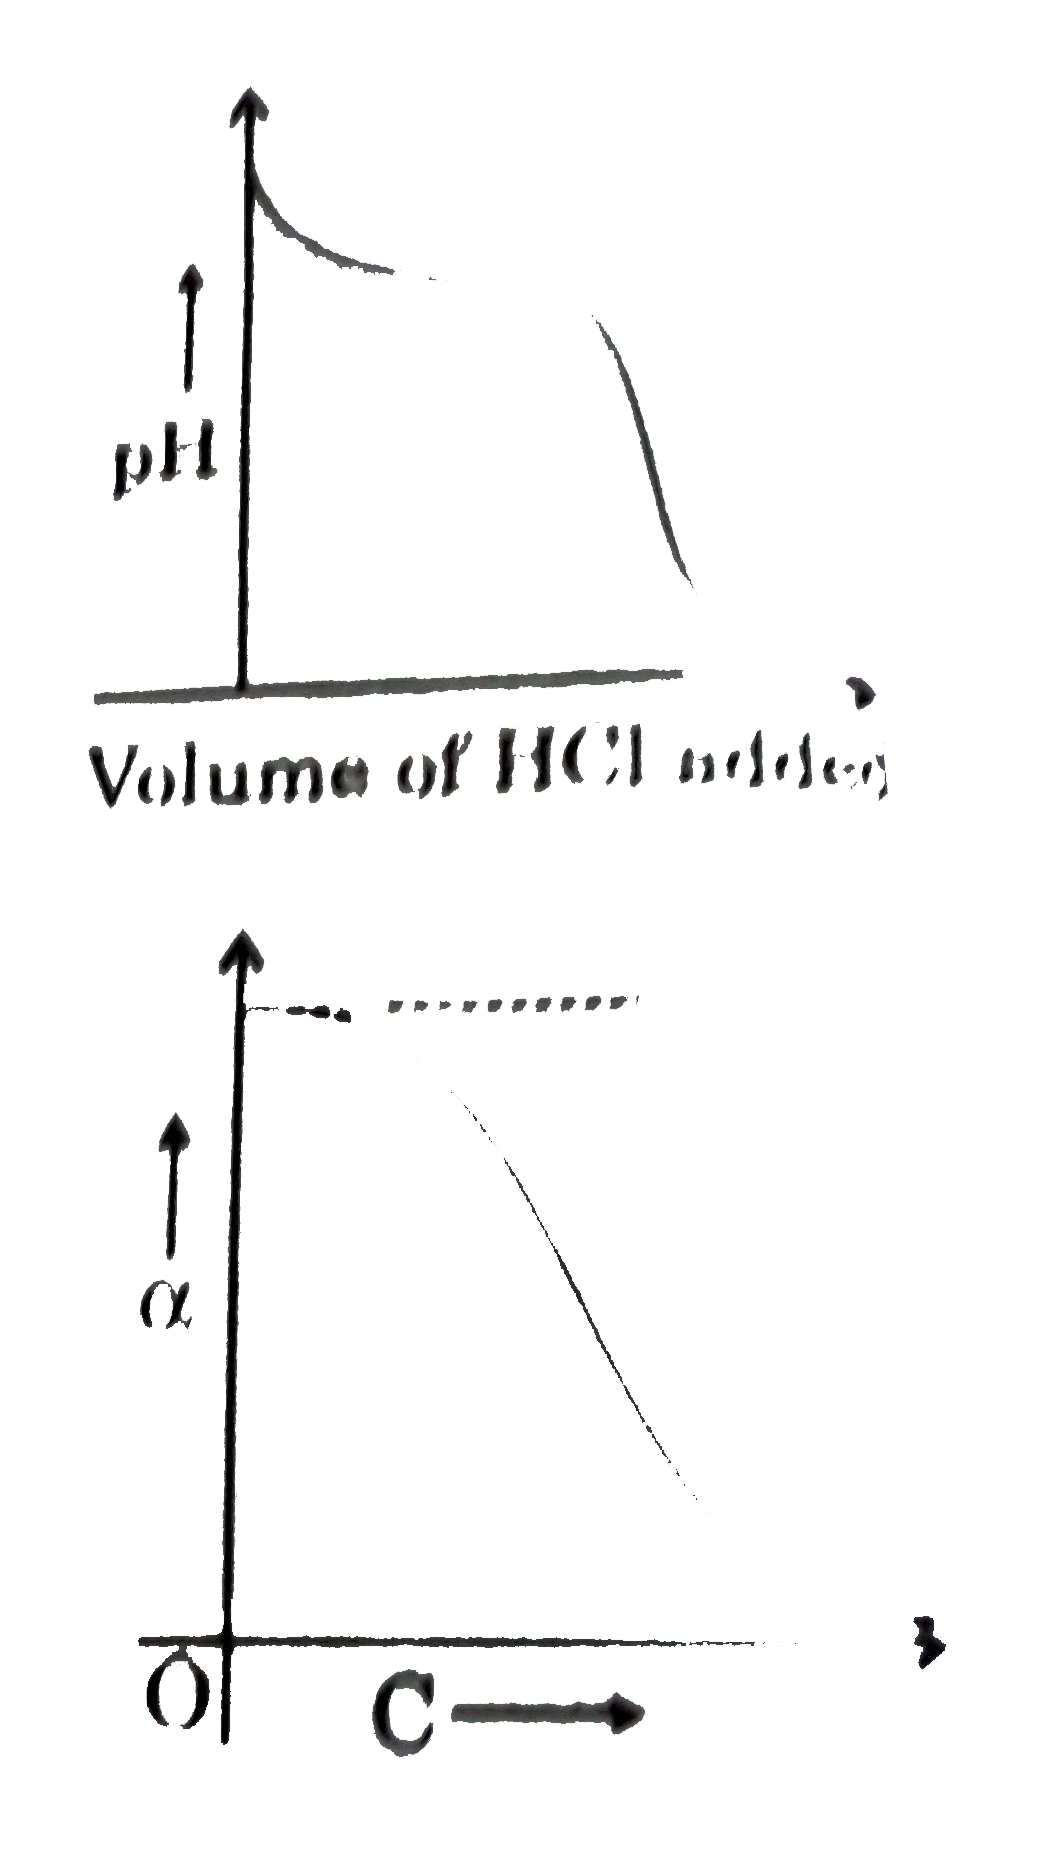
(P) When 100 mL of `0.1M NaCN` solution is titrated with `0.1 M HCI` solution the variation of pH of solution with volume added will be (as shown in fig.)
(Q) Variation of degree of dissociation `alpha` with concentration for a weak electrolyte at a particular temperature is best represented by (as shown in fig.)
(R) `0.1M` acetic acid solution is titrated aganist `0.1M NaOH` solution. the difference in pH between `1//4` and `3//4` stages of neutralization of acid will be 2 log 3.
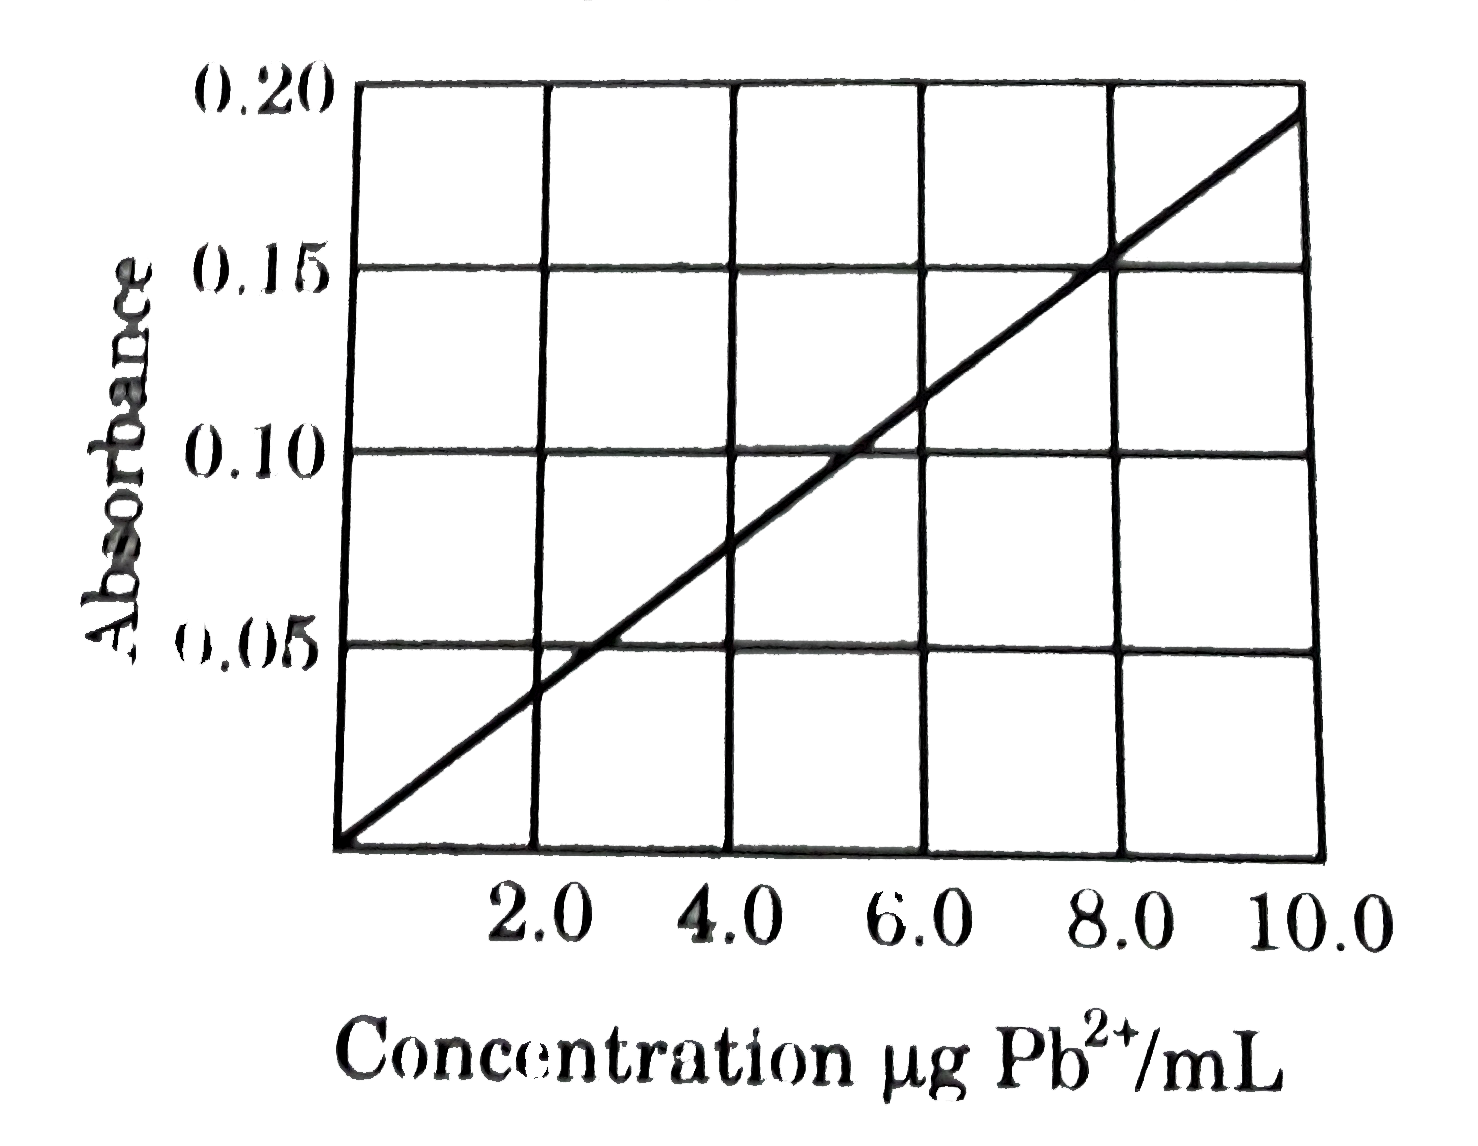
View SolutionA `25.0 mL` sample of waste water is obtained to analyze for `Pb^(2+)` ions. This sample is evaporated to dryness and redissolved in `2.0 mL` of `H_(2)O`, mixed with `2.0 mL` of a buffer solution and `2.0 mL` of a solution of dithizone then diluted to `10.0 mL`. The absorbance of the coloured `Pb^(2+)` dithizone complex is compared with the Beer-Lambert plot below. The absorbance of a proton of the final solution is `0.13`. What is the concentration of `Pb^(2+)` ions in the waste water in ppm ?
View SolutionThe curve represents the titration of a weak monoprotic acid. Ovar what `pH` range (s) will the acid being titrated, serve as a buffer when mixed with its salt ?
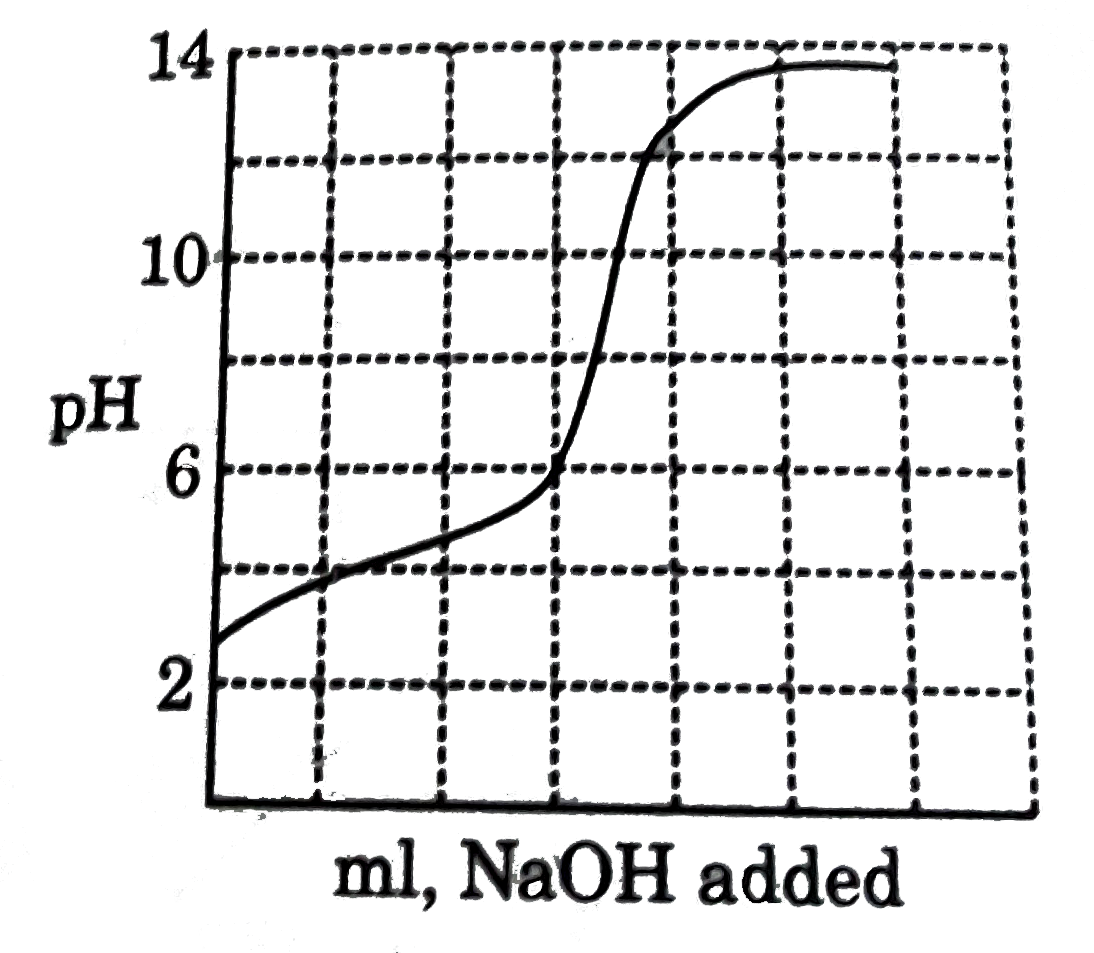
(P) `pH 4 -6`
(Q) `pH 9 -9`
(R) `pH 12 -13`
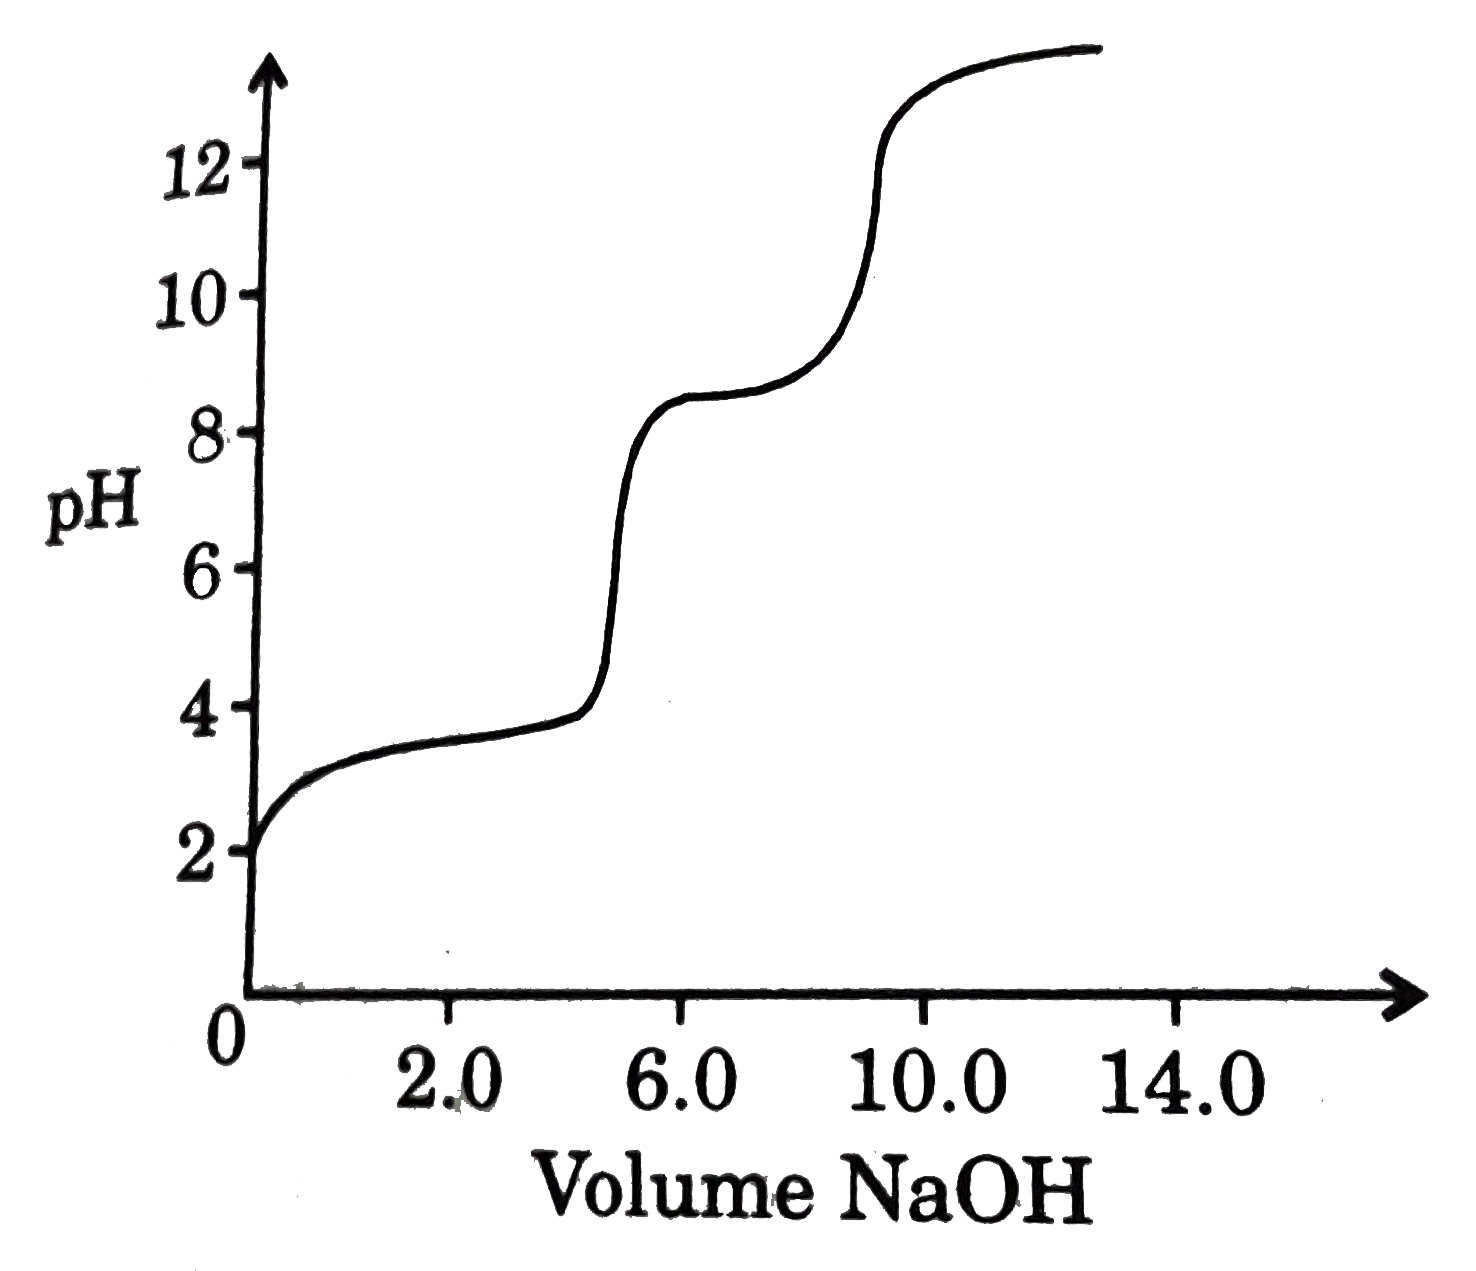
View SolutionThe curve represents the titration of :
View Solution
Ionic Equilibrium questions and complete solutions for chapter GRAPHICAL INTERPRETATION of GRB CHEMISTRY (HINGLISH) of Class 12
All Exercises from GRB PUBLICATION Class 12 CHEMISTRY GRAPHICAL INTERPRETATION
- A. Thermodynamics
- Atomic Sturcture
- B. Gaseous State
- C. Atomic Sturcture
- Chemical Equilibrium
- Chemical Kinetics
- Comprehension
- Comprehension 1
- Comprehension 10
- Comprehension 11
- Comprehension 12
- Comprehension 13
- Comprehension 14
- Comprehension 15
- Comprehension 16
- Comprehension 17
- Comprehension 18
- Comprehension 19
- Comprehension 2
- Comprehension 20
- Comprehension 21
- Comprehension 22
- Comprehension 23
- Comprehension 24
- Comprehension 25
- Comprehension 26
- Comprehension 27
- Comprehension 28
- Comprehension 29
- Comprehension 3
- Comprehension 4
- Comprehension 5
- Comprehension 6
- Comprehension 7
- Comprehension 8
- Comprehension 9
- D. Liquid Solutions
- E. Surface Chemistry
- Electrochemistry
- F. Ionic Equilibrium
- G. Chemical Equilibrium
- Gaseous State
- H. Chemical Kinetics
- I.Electrochemistry
- Ionic Equilibrium
- Liquid Solutions
- Match The Column Type
- Multiple Objective Type
- Subjective Type
- Surface Chemistry
- Thermodynamics